The median household income in Ocean Bluff-Brant Rock, MA in 2022 was $104,290, which was 9.4% greater than the median annual income of $94,488 across the entire state of Massachusetts. Compared to the median income of $56,840 in 2000 this represents an increase of 45.5%. The per capita income in 2022 was $53,562, which means an increase of 54.6% compared to 2000 when it was $24,292.
Whole page based on the data from 2000 / 2022 when the population of Ocean Bluff-Brant Rock, Massachusetts was 5,100 / 4,668
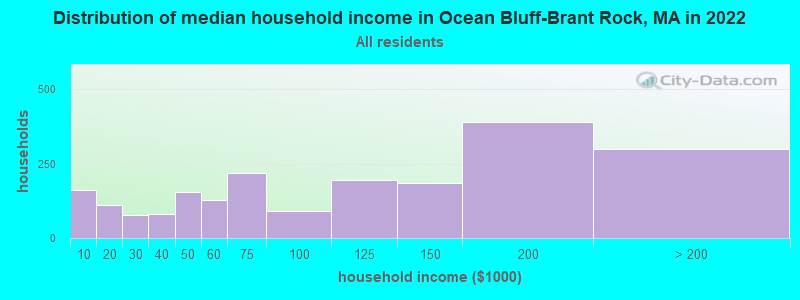
Income statistics for all residents
Median household income in Ocean Bluff-Brant Rock, MA in 2022:
Ocean Bluff-Brant Rock:
$104,290
State:
$94,488
Change in median household income between 2000 and 2022:
Ocean Bluff-Brant Rock, Massachusetts:
+83.5%
State:
+87.1%
Number of households with income < $10k:
Ocean Bluff-Brant Rock:
7.6% (160)
State:
5.2% (146,170)
Number of households with income $10k - 20k:
Ocean Bluff-Brant Rock:
5.3% (111)
State:
6.4% (180,001)
Number of households with income $20k - 30k:
Ocean Bluff-Brant Rock:
3.7% (77)
State:
5.6% (156,667)
Number of households with income $30k - 40k:
Ocean Bluff-Brant Rock:
3.8% (80)
State:
5.6% (157,168)
Number of households with income $40k - 50k:
Ocean Bluff-Brant Rock:
7.4% (154)
Massachusetts:
5.4% (151,455)
Number of households with income $50k - 60k:
Ocean Bluff-Brant Rock:
6.2% (129)
Massachusetts:
5.1% (142,726)
Number of households with income $60k - 75k:
Ocean Bluff-Brant Rock:
10.5% (219)
State:
7.6% (212,203)
Number of households with income $75k - 100k:
Ocean Bluff-Brant Rock:
4.4% (92)
State:
11.3% (317,064)
Number of households with income $100k - 125k:
Ocean Bluff-Brant Rock:
9.4% (196)
State:
9.7% (270,603)
Number of households with income $125k - 150k:
Ocean Bluff-Brant Rock:
8.8% (184)
State:
8.0% (223,140)
Number of households with income $150k - 200k:
Ocean Bluff-Brant Rock:
18.6% (390)
Massachusetts:
11.0% (308,695)
Number of households with income > $200k:
Ocean Bluff-Brant Rock:
14.3% (300)
Massachusetts:
19.0% (531,884)
Aggregate household income in Ocean Bluff-Brant Rock in 2022: $245,012,252
Median family income in Ocean Bluff-Brant Rock in 2022:
Ocean Bluff-Brant Rock:
$126,229
Massachusetts:
$120,263
Number of families with income < $10k:
Ocean Bluff-Brant Rock:
2.6% (37)
Massachusetts:
2.9% (49,671)
Number of families with income $10k - 20k:
Ocean Bluff-Brant Rock:
5.6% (78)
Massachusetts:
2.9% (50,542)
Number of families with income $20k - 30k:
Ocean Bluff-Brant Rock:
1.5% (21)
State:
3.9% (66,398)
Number of families with income $30k - 40k:
Ocean Bluff-Brant Rock:
0.5% (7)
State:
4.5% (78,234)
Number of families with income $40k - 50k:
Ocean Bluff-Brant Rock:
10.9% (152)
Massachusetts:
4.5% (77,656)
Number of families with income $50k - 60k:
Ocean Bluff-Brant Rock:
2.8% (38)
State:
4.5% (77,928)
Number of families with income $60k - 75k:
Ocean Bluff-Brant Rock:
7.2% (101)
State:
7.0% (120,295)
Number of families with income $75k - 100k:
Ocean Bluff-Brant Rock:
4.5% (62)
Massachusetts:
11.1% (192,172)
Number of families with income $100k - 125k:
Ocean Bluff-Brant Rock:
10.9% (152)
Massachusetts:
10.6% (182,105)
Number of families with income $125k - 150k:
Ocean Bluff-Brant Rock:
11.2% (156)
State:
9.3% (159,566)
Number of families with income $150k - 200k:
Ocean Bluff-Brant Rock:
24.0% (334)
Massachusetts:
13.4% (231,410)
Number of families with income > $200k:
Ocean Bluff-Brant Rock:
18.3% (255)
Massachusetts:
25.4% (438,378)
Median non-family income in Ocean Bluff-Brant Rock in 2022:
Ocean Bluff-Brant Rock:
$58,002
State:
$55,979
Change in median non-family income between 2000 and 2022:
Ocean Bluff-Brant Rock, Massachusetts:
+38.7%
State:
+88.0%
Median per capita income in Ocean Bluff-Brant Rock in 2022:
Ocean Bluff-Brant Rock:
$53,563
State:
$54,025
Change in median per capita income between 2000 and 2022:
Ocean Bluff-Brant Rock, Massachusetts:
+120.5%
State:
+108.2%
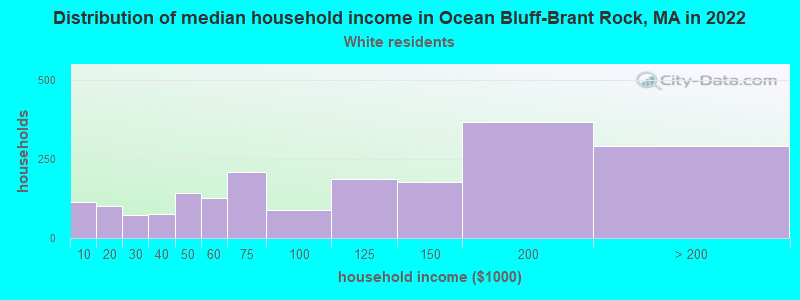
Income statistics for White residents
Median household income in Ocean Bluff-Brant Rock, MA in 2022:
Ocean Bluff-Brant Rock:
$105,956
Massachusetts:
$101,391
Change in median household income between 2000 and 2022:
Ocean Bluff-Brant Rock, Massachusetts:
+87.1%
State:
+93.3%
Number of households with income < $10k:
Ocean Bluff-Brant Rock:
5.8% (113)
Massachusetts:
4.4% (91,120)
Number of households with income $10k - 20k:
Ocean Bluff-Brant Rock:
5.2% (102)
State:
5.9% (122,055)
Number of households with income $20k - 30k:
Ocean Bluff-Brant Rock:
3.8% (74)
State:
5.1% (105,311)
Number of households with income $30k - 40k:
Ocean Bluff-Brant Rock:
3.9% (77)
State:
5.3% (110,239)
Number of households with income $40k - 50k:
Ocean Bluff-Brant Rock:
7.4% (144)
State:
5.0% (104,636)
Number of households with income $50k - 60k:
Ocean Bluff-Brant Rock:
6.5% (127)
State:
4.8% (99,486)
Number of households with income $60k - 75k:
Ocean Bluff-Brant Rock:
10.6% (208)
Massachusetts:
7.5% (155,124)
Number of households with income $75k - 100k:
Ocean Bluff-Brant Rock:
4.5% (89)
State:
11.4% (236,252)
Number of households with income $100k - 125k:
Ocean Bluff-Brant Rock:
9.5% (187)
State:
9.9% (204,731)
Number of households with income $125k - 150k:
Ocean Bluff-Brant Rock:
9.1% (178)
State:
8.5% (175,324)
Number of households with income $150k - 200k:
Ocean Bluff-Brant Rock:
18.8% (368)
Massachusetts:
11.7% (242,980)
Number of households with income > $200k:
Ocean Bluff-Brant Rock:
14.9% (292)
Massachusetts:
20.5% (425,966)
Aggregate household income in Ocean Bluff-Brant Rock in 2022: $235,284,654
Median family income in Ocean Bluff-Brant Rock in 2022:
Ocean Bluff-Brant Rock:
$127,162
State:
$133,153
Number of families with income < $10k:
Ocean Bluff-Brant Rock:
2.6% (35)
State:
2.0% (25,038)
Number of families with income $10k - 20k:
Ocean Bluff-Brant Rock:
5.4% (72)
Massachusetts:
2.1% (26,403)
Number of families with income $20k - 30k:
Ocean Bluff-Brant Rock:
1.7% (23)
Massachusetts:
2.6% (32,525)
Number of families with income $30k - 40k:
Ocean Bluff-Brant Rock:
0.5% (6)
State:
3.9% (48,079)
Number of families with income $40k - 50k:
Ocean Bluff-Brant Rock:
10.8% (145)
State:
3.8% (46,908)
Number of families with income $50k - 60k:
Ocean Bluff-Brant Rock:
2.7% (36)
State:
3.8% (46,476)
Number of families with income $60k - 75k:
Ocean Bluff-Brant Rock:
7.5% (100)
State:
6.4% (79,040)
Number of families with income $75k - 100k:
Ocean Bluff-Brant Rock:
4.6% (61)
State:
11.1% (137,395)
Number of families with income $100k - 125k:
Ocean Bluff-Brant Rock:
10.4% (139)
Massachusetts:
11.1% (136,771)
Number of families with income $125k - 150k:
Ocean Bluff-Brant Rock:
11.4% (152)
State:
10.0% (123,709)
Number of families with income $150k - 200k:
Ocean Bluff-Brant Rock:
24.0% (321)
Massachusetts:
14.7% (181,602)
Number of families with income > $200k:
Ocean Bluff-Brant Rock:
18.6% (249)
State:
28.5% (351,887)
Median non-family income in Ocean Bluff-Brant Rock in 2022:
Ocean Bluff-Brant Rock:
$57,099
Massachusetts:
$59,323
Change in median non-family income between 2000 and 2022:
Ocean Bluff-Brant Rock, Massachusetts:
+38.6%
Massachusetts:
+94.3%
Median per capita income in Ocean Bluff-Brant Rock in 2022:
Ocean Bluff-Brant Rock:
$55,602
Massachusetts:
$60,804
Change in median per capita income between 2000 and 2022:
Ocean Bluff-Brant Rock, Massachusetts:
+129.2%
Massachusetts:
+118.7%
Income statistics for Black or African American residents
Median per capita income in Ocean Bluff-Brant Rock in 2022:
Ocean Bluff-Brant Rock:
$8,252
State:
$33,524
Change in median per capita income between 2000 and 2022:: -78.9%
Ocean Bluff-Brant Rock, Massachusetts:
-78.9%
State:
+109.4%
Income statistics for Hispanic or Latino residents
Aggregate household income in Ocean Bluff-Brant Rock in 2022: $2,733,886
Median per capita income in Ocean Bluff-Brant Rock in 2022:
Ocean Bluff-Brant Rock:
$32,795
Massachusetts:
$28,993
Change in median per capita income between 2000 and 2022:
Ocean Bluff-Brant Rock, Massachusetts:
+13.1%
Massachusetts:
+142.4%
Income statistics for Multirace residents
Number of households with income < $10k:
Ocean Bluff-Brant Rock:
0.0% (0)
State:
6.6% (15,127)
Number of households with income $10k - 20k:
Ocean Bluff-Brant Rock:
0.0% (0)
Massachusetts:
9.2% (21,158)
Number of households with income $20k - 30k:
Ocean Bluff-Brant Rock:
0.0% (0)
State:
7.8% (18,016)
Number of households with income $30k - 40k:
Ocean Bluff-Brant Rock:
0.0% (0)
State:
7.9% (18,260)
Number of households with income $40k - 50k:
Ocean Bluff-Brant Rock:
0.0% (0)
State:
5.6% (13,027)
Number of households with income $50k - 60k:
Ocean Bluff-Brant Rock:
0.0% (0)
State:
5.6% (12,909)
Number of households with income $60k - 75k:
Ocean Bluff-Brant Rock:
0.0% (0)
State:
9.0% (20,800)
Number of households with income $75k - 100k:
Ocean Bluff-Brant Rock:
0.0% (0)
State:
12.1% (27,875)
Number of households with income $100k - 125k:
Ocean Bluff-Brant Rock:
100.0% (13)
State:
8.1% (18,754)
Number of households with income $125k - 150k:
Ocean Bluff-Brant Rock:
0.0% (0)
State:
6.8% (15,621)
Number of households with income $150k - 200k:
Ocean Bluff-Brant Rock:
0.0% (0)
State:
9.4% (21,618)
Number of households with income > $200k:
Ocean Bluff-Brant Rock:
0.0% (0)
State:
12.0% (27,592)
Aggregate household income in Ocean Bluff-Brant Rock in 2022: $2,236,562
Median per capita income in Ocean Bluff-Brant Rock in 2022:
Ocean Bluff-Brant Rock:
$15,768
State:
$34,029
Change in median per capita income between 2000 and 2022:: -29.3%
Ocean Bluff-Brant Rock, Massachusetts:
-29.3%
State:
+132.1%
Discuss Ocean Bluff-Brant Rock, Massachusetts (MA) on our hugely popular Massachusetts forum.