The median household income in Olmos Park, TX in 2022 was $175,708, which was 58.9% greater than the median annual income of $72,284 across the entire state of Texas. Compared to the median income of $87,560 in 2000 this represents an increase of 50.2%. The per capita income in 2022 was $131,918, which means an increase of 50.2% compared to 2000 when it was $65,697.
Whole page based on the data from 2000 / 2022 when the population of Olmos Park, Texas was 2,343 / 2,338
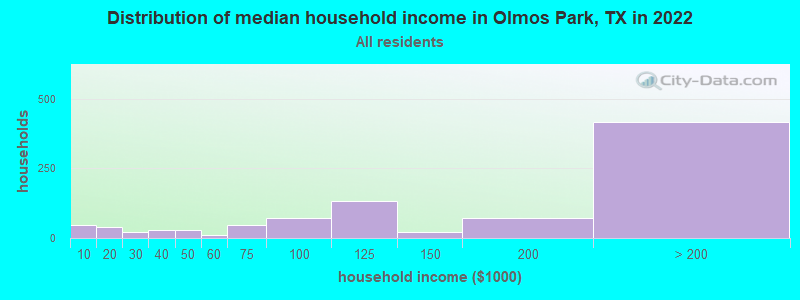
Income statistics for all residents
Median household income in Olmos Park, TX in 2022:
Olmos Park:
$175,709
State:
$72,284
Change in median household income between 2000 and 2022:
Olmos Park, Texas:
+100.7%
State:
+81.0%
Number of households with income < $10k:
Olmos Park:
5.1% (48)
Texas:
5.5% (611,011)
Number of households with income $10k - 20k:
Olmos Park:
4.1% (38)
Texas:
6.7% (743,157)
Number of households with income $20k - 30k:
Olmos Park:
2.4% (22)
State:
7.2% (803,381)
Number of households with income $30k - 40k:
Olmos Park:
2.9% (27)
Texas:
7.8% (866,080)
Number of households with income $40k - 50k:
Olmos Park:
3.2% (30)
Texas:
7.3% (810,440)
Number of households with income $50k - 60k:
Olmos Park:
1.1% (10)
State:
7.2% (799,783)
Number of households with income $60k - 75k:
Olmos Park:
5.1% (48)
State:
9.9% (1,095,384)
Number of households with income $75k - 100k:
Olmos Park:
7.7% (72)
Texas:
12.8% (1,419,057)
Number of households with income $100k - 125k:
Olmos Park:
14.1% (132)
State:
9.5% (1,054,577)
Number of households with income $125k - 150k:
Olmos Park:
2.1% (20)
State:
6.7% (741,518)
Number of households with income $150k - 200k:
Olmos Park:
7.6% (71)
State:
8.7% (961,776)
Number of households with income > $200k:
Olmos Park:
44.6% (417)
State:
10.7% (1,181,544)
Aggregate household income in Olmos Park in 2022: $303,698,880
Median family income in Olmos Park in 2022:
Olmos Park:
$246,063
State:
$86,267
Number of families with income < $10k:
Olmos Park:
3.3% (18)
Texas:
4.0% (297,884)
Number of families with income $20k - 30k:
Olmos Park:
1.8% (10)
State:
5.8% (430,949)
Number of families with income $30k - 40k:
Olmos Park:
0.8% (4)
State:
6.6% (493,535)
Number of families with income $40k - 50k:
Olmos Park:
1.6% (9)
State:
6.7% (499,663)
Number of families with income $60k - 75k:
Olmos Park:
4.1% (22)
State:
9.5% (710,229)
Number of families with income $75k - 100k:
Olmos Park:
4.6% (25)
State:
13.6% (1,015,480)
Number of families with income $100k - 125k:
Olmos Park:
5.8% (32)
State:
10.7% (797,961)
Number of families with income $125k - 150k:
Olmos Park:
3.6% (20)
State:
8.1% (602,985)
Number of families with income $150k - 200k:
Olmos Park:
9.6% (53)
State:
10.7% (804,459)
Number of families with income > $200k:
Olmos Park:
64.9% (357)
State:
13.5% (1,013,514)
Median non-family income in Olmos Park in 2022:
Olmos Park:
$88,907
State:
$45,999
Change in median non-family income between 2000 and 2022:
Olmos Park, Texas:
+137.9%
State:
+79.5%
Median per capita income in Olmos Park in 2022:
Olmos Park:
$131,918
State:
$38,123
Change in median per capita income between 2000 and 2022:
Olmos Park, Texas:
+100.8%
Texas:
+94.3%
Income statistics for White residents
Median household income in Olmos Park, TX in 2022:
Olmos Park:
$196,459
State:
$82,032
Change in median household income between 2000 and 2022:
Olmos Park, Texas:
+111.6%
Texas:
+91.0%
Number of households with income < $10k:
Olmos Park:
3.1% (21)
State:
4.7% (273,716)
Number of households with income $10k - 20k:
Olmos Park:
3.4% (23)
State:
5.5% (322,702)
Number of households with income $20k - 30k:
Olmos Park:
2.2% (15)
State:
6.2% (363,947)
Number of households with income $30k - 40k:
Olmos Park:
2.8% (19)
State:
6.8% (399,275)
Number of households with income $40k - 50k:
Olmos Park:
3.1% (21)
State:
6.5% (383,417)
Number of households with income $50k - 60k:
Olmos Park:
1.2% (8)
Texas:
6.6% (388,535)
Number of households with income $60k - 75k:
Olmos Park:
4.7% (32)
State:
9.7% (566,295)
Number of households with income $75k - 100k:
Olmos Park:
5.1% (35)
Texas:
13.0% (760,276)
Number of households with income $100k - 125k:
Olmos Park:
16.2% (111)
State:
10.2% (597,596)
Number of households with income $125k - 150k:
Olmos Park:
2.3% (16)
State:
7.4% (436,830)
Number of households with income $150k - 200k:
Olmos Park:
8.6% (59)
State:
9.9% (583,067)
Number of households with income > $200k:
Olmos Park:
47.5% (326)
Texas:
13.5% (792,647)
Aggregate household income in Olmos Park in 2022: $231,700,661
Median family income in Olmos Park in 2022:
Olmos Park:
$268,488
State:
$101,788
Number of families with income < $10k:
Olmos Park:
2.9% (12)
State:
2.8% (108,142)
Number of families with income $20k - 30k:
Olmos Park:
1.3% (5)
Texas:
4.1% (157,688)
Number of families with income $30k - 40k:
Olmos Park:
0.7% (3)
State:
5.2% (198,847)
Number of families with income $40k - 50k:
Olmos Park:
1.3% (5)
State:
5.6% (216,490)
Number of families with income $60k - 75k:
Olmos Park:
3.1% (13)
State:
9.0% (346,106)
Number of families with income $75k - 100k:
Olmos Park:
4.1% (17)
State:
13.7% (527,363)
Number of families with income $100k - 125k:
Olmos Park:
6.1% (26)
State:
11.6% (448,411)
Number of families with income $125k - 150k:
Olmos Park:
3.8% (16)
State:
9.2% (355,798)
Number of families with income $150k - 200k:
Olmos Park:
10.2% (43)
Texas:
12.5% (480,185)
Number of families with income > $200k:
Olmos Park:
66.6% (282)
Texas:
17.6% (677,490)
Median non-family income in Olmos Park in 2022:
Olmos Park:
$112,511
State:
$50,587
Median per capita income in Olmos Park in 2022:
Olmos Park:
$148,973
State:
$47,740
Change in median per capita income between 2000 and 2022:
Olmos Park, Texas:
+116.5%
Texas:
+114.3%
Income statistics for Black or African American residents
Aggregate household income in Olmos Park in 2022: $5,602,915
Median per capita income in Olmos Park in 2022:
Olmos Park:
$123,309
State:
$30,490
Income statistics for Asian residents
Median per capita income in Olmos Park in 2022:
Olmos Park:
$93,607
Texas:
$48,626
Income statistics for Hispanic or Latino residents
Number of households with income < $10k:
Olmos Park:
13.5% (20)
State:
5.8% (213,953)
Number of households with income $10k - 20k:
Olmos Park:
0.0% (0)
Texas:
8.0% (297,456)
Number of households with income $20k - 30k:
Olmos Park:
3.4% (5)
State:
9.2% (340,166)
Number of households with income $30k - 40k:
Olmos Park:
3.4% (5)
State:
9.5% (354,336)
Number of households with income $40k - 50k:
Olmos Park:
6.1% (9)
Texas:
8.8% (327,013)
Number of households with income $50k - 60k:
Olmos Park:
0.0% (0)
State:
8.3% (308,818)
Number of households with income $60k - 75k:
Olmos Park:
2.0% (3)
Texas:
10.9% (405,109)
Number of households with income $75k - 100k:
Olmos Park:
17.6% (26)
State:
13.8% (511,639)
Number of households with income $100k - 125k:
Olmos Park:
6.1% (9)
State:
8.6% (319,728)
Number of households with income $125k - 150k:
Olmos Park:
0.0% (0)
Texas:
5.7% (210,932)
Number of households with income $150k - 200k:
Olmos Park:
0.0% (0)
State:
6.4% (236,055)
Number of households with income > $200k:
Olmos Park:
48.0% (71)
State:
5.1% (189,259)
Aggregate household income in Olmos Park in 2022: $49,530,224
Median family income in Olmos Park in 2022:
Olmos Park:
$241,969
State:
$65,080
Number of families with income $20k - 30k:
Olmos Park:
6.6% (6)
State:
8.6% (238,528)
Number of families with income $40k - 50k:
Olmos Park:
11.6% (10)
Texas:
8.6% (240,188)
Number of families with income $60k - 75k:
Olmos Park:
4.1% (3)
Texas:
10.9% (302,688)
Number of families with income $75k - 100k:
Olmos Park:
4.5% (4)
Texas:
14.3% (398,554)
Number of families with income > $200k:
Olmos Park:
73.1% (61)
State:
5.9% (165,129)
Median non-family income in Olmos Park in 2022:
Olmos Park:
$89,100
Texas:
$39,934
Median per capita income in Olmos Park in 2022:
Olmos Park:
$155,859
Texas:
$24,862
Income statistics for Multirace residents
Number of households with income < $10k:
Olmos Park:
24.2% (32)
State:
5.5% (122,324)
Number of households with income $10k - 20k:
Olmos Park:
0.0% (0)
Texas:
8.2% (182,232)
Number of households with income $20k - 30k:
Olmos Park:
0.0% (0)
Texas:
8.5% (189,456)
Number of households with income $30k - 40k:
Olmos Park:
0.0% (0)
State:
8.9% (197,499)
Number of households with income $40k - 50k:
Olmos Park:
0.0% (0)
State:
8.7% (191,735)
Number of households with income $50k - 60k:
Olmos Park:
0.0% (0)
State:
8.0% (177,535)
Number of households with income $60k - 75k:
Olmos Park:
3.8% (5)
State:
10.5% (232,479)
Number of households with income $75k - 100k:
Olmos Park:
32.6% (43)
State:
13.1% (290,448)
Number of households with income $100k - 125k:
Olmos Park:
0.0% (0)
Texas:
8.6% (191,595)
Number of households with income $125k - 150k:
Olmos Park:
0.0% (0)
Texas:
6.0% (133,361)
Number of households with income $150k - 200k:
Olmos Park:
0.0% (0)
State:
7.2% (159,195)
Number of households with income > $200k:
Olmos Park:
39.4% (52)
State:
6.7% (148,064)
Aggregate household income in Olmos Park in 2022: $20,635,954
Median family income in Olmos Park in 2022:
Olmos Park:
$235,450
State:
$69,780
Number of families with income $60k - 75k:
Olmos Park:
8.6% (5)
State:
10.5% (169,549)
Number of families with income $75k - 100k:
Olmos Park:
11.4% (6)
State:
14.0% (226,284)
Number of families with income > $200k:
Olmos Park:
80.0% (45)
State:
7.9% (127,299)
Median per capita income in Olmos Park in 2022:
Olmos Park:
$95,092
State:
$26,785
Income statistics for other residents
Median per capita income in Olmos Park in 2022:
Olmos Park:
$18,225
State:
$23,899
Change in median per capita income between 2000 and 2022:
Olmos Park, Texas:
+108.7%
State:
+135.2%
Discuss Olmos Park, Texas (TX) on our hugely popular Texas forum.