The median household income in Orange, MA in 2022 was $55,497, which was 70.3% less than the median annual income of $94,488 across the entire state of Massachusetts. Compared to the median income of $35,826 in 2000 this represents an increase of 35.4%. The per capita income in 2022 was $26,671, which means an increase of 41.7% compared to 2000 when it was $15,550.
Whole page based on the data from 2000 / 2022 when the population of Orange, Massachusetts was 3,945 / 3,726
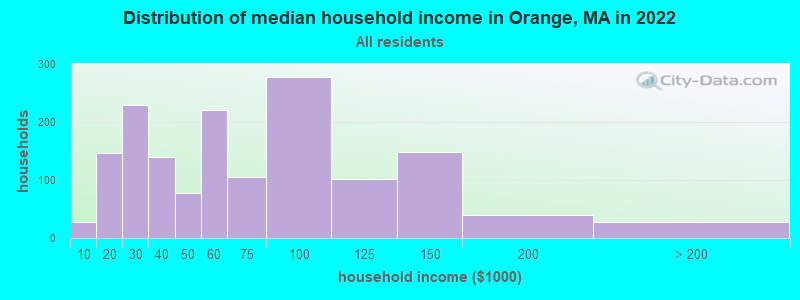
Income statistics for all residents
Median household income in Orange, MA in 2022:
Orange:
$55,497
State:
$94,488
Change in median household income between 2000 and 2022:
Orange, Massachusetts:
+54.9%
State:
+87.1%
Number of households with income < $10k:
Orange:
1.8% (27)
Massachusetts:
5.2% (146,170)
Number of households with income $10k - 20k:
Orange:
9.5% (147)
Massachusetts:
6.4% (180,001)
Number of households with income $20k - 30k:
Orange:
14.9% (230)
State:
5.6% (156,667)
Number of households with income $30k - 40k:
Orange:
9.1% (140)
State:
5.6% (157,168)
Number of households with income $40k - 50k:
Orange:
5.1% (78)
State:
5.4% (151,455)
Number of households with income $50k - 60k:
Orange:
14.3% (220)
Massachusetts:
5.1% (142,726)
Number of households with income $60k - 75k:
Orange:
6.8% (105)
State:
7.6% (212,203)
Number of households with income $75k - 100k:
Orange:
18.0% (278)
State:
11.3% (317,064)
Number of households with income $100k - 125k:
Orange:
6.5% (101)
State:
9.7% (270,603)
Number of households with income $125k - 150k:
Orange:
9.7% (149)
Massachusetts:
8.0% (223,140)
Number of households with income $150k - 200k:
Orange:
2.6% (40)
Massachusetts:
11.0% (308,695)
Number of households with income > $200k:
Orange:
1.8% (27)
State:
19.0% (531,884)
Aggregate household income in Orange in 2022: $97,065,969
Median family income in Orange in 2022:
Orange:
$68,156
State:
$120,263
Number of families with income < $10k:
Orange:
2.1% (21)
State:
2.9% (49,671)
Number of families with income $10k - 20k:
Orange:
8.9% (87)
State:
2.9% (50,542)
Number of families with income $20k - 30k:
Orange:
11.2% (109)
Massachusetts:
3.9% (66,398)
Number of families with income $30k - 40k:
Orange:
9.7% (95)
Massachusetts:
4.5% (78,234)
Number of families with income $40k - 50k:
Orange:
4.7% (46)
State:
4.5% (77,656)
Number of families with income $50k - 60k:
Orange:
11.9% (116)
Massachusetts:
4.5% (77,928)
Number of families with income $60k - 75k:
Orange:
7.9% (77)
State:
7.0% (120,295)
Number of families with income $75k - 100k:
Orange:
15.8% (153)
Massachusetts:
11.1% (192,172)
Number of families with income $100k - 125k:
Orange:
9.8% (95)
State:
10.6% (182,105)
Number of families with income $125k - 150k:
Orange:
12.6% (123)
Massachusetts:
9.3% (159,566)
Number of families with income $150k - 200k:
Orange:
2.6% (25)
Massachusetts:
13.4% (231,410)
Number of families with income > $200k:
Orange:
2.8% (28)
Massachusetts:
25.4% (438,378)
Median non-family income in Orange in 2022:
Orange:
$37,247
State:
$55,979
Change in median non-family income between 2000 and 2022:
Orange, Massachusetts:
+105.1%
Massachusetts:
+88.0%
Median per capita income in Orange in 2022:
Orange:
$26,671
State:
$54,025
Change in median per capita income between 2000 and 2022:
Orange, Massachusetts:
+71.5%
State:
+108.2%
Income statistics for White residents
Median household income in Orange, MA in 2022:
Orange:
$57,123
Massachusetts:
$101,391
Change in median household income between 2000 and 2022:
Orange, Massachusetts:
+59.3%
State:
+93.3%
Number of households with income < $10k:
Orange:
1.5% (22)
State:
4.4% (91,120)
Number of households with income $10k - 20k:
Orange:
9.7% (146)
State:
5.9% (122,055)
Number of households with income $20k - 30k:
Orange:
14.2% (214)
Massachusetts:
5.1% (105,311)
Number of households with income $30k - 40k:
Orange:
9.4% (142)
Massachusetts:
5.3% (110,239)
Number of households with income $40k - 50k:
Orange:
5.1% (77)
Massachusetts:
5.0% (104,636)
Number of households with income $50k - 60k:
Orange:
12.6% (190)
Massachusetts:
4.8% (99,486)
Number of households with income $60k - 75k:
Orange:
7.1% (107)
State:
7.5% (155,124)
Number of households with income $75k - 100k:
Orange:
19.6% (295)
State:
11.4% (236,252)
Number of households with income $100k - 125k:
Orange:
6.9% (104)
Massachusetts:
9.9% (204,731)
Number of households with income $125k - 150k:
Orange:
9.4% (141)
Massachusetts:
8.5% (175,324)
Number of households with income $150k - 200k:
Orange:
2.7% (40)
State:
11.7% (242,980)
Number of households with income > $200k:
Orange:
1.8% (27)
State:
20.5% (425,966)
Aggregate household income in Orange in 2022: $95,201,340
Median family income in Orange in 2022:
Orange:
$68,455
State:
$133,153
Number of families with income < $10k:
Orange:
1.8% (17)
State:
2.0% (25,038)
Number of families with income $10k - 20k:
Orange:
9.3% (87)
State:
2.1% (26,403)
Number of families with income $20k - 30k:
Orange:
11.0% (103)
Massachusetts:
2.6% (32,525)
Number of families with income $30k - 40k:
Orange:
10.3% (96)
Massachusetts:
3.9% (48,079)
Number of families with income $40k - 50k:
Orange:
4.9% (46)
Massachusetts:
3.8% (46,908)
Number of families with income $50k - 60k:
Orange:
8.9% (84)
State:
3.8% (46,476)
Number of families with income $60k - 75k:
Orange:
8.8% (83)
State:
6.4% (79,040)
Number of families with income $75k - 100k:
Orange:
16.7% (156)
State:
11.1% (137,395)
Number of families with income $100k - 125k:
Orange:
10.4% (98)
State:
11.1% (136,771)
Number of families with income $125k - 150k:
Orange:
12.3% (115)
State:
10.0% (123,709)
Number of families with income $150k - 200k:
Orange:
2.7% (25)
State:
14.7% (181,602)
Number of families with income > $200k:
Orange:
3.0% (28)
Massachusetts:
28.5% (351,887)
Median non-family income in Orange in 2022:
Orange:
$40,871
State:
$59,323
Change in median non-family income between 2000 and 2022:
Orange, Massachusetts:
+121.7%
Massachusetts:
+94.3%
Median per capita income in Orange in 2022:
Orange:
$28,751
State:
$60,804
Change in median per capita income between 2000 and 2022:
Orange, Massachusetts:
+81.1%
State:
+118.7%
Income statistics for Black or African American residents
Median per capita income in Orange in 2022:
Orange:
$1,718
Massachusetts:
$33,524
Change in median per capita income between 2000 and 2022:: -87.3%
Orange, Massachusetts:
-87.3%
Massachusetts:
+109.4%
Income statistics for Asian residents
Median per capita income in Orange in 2022:
Orange:
$10,699
State:
$58,900
Change in median per capita income between 2000 and 2022:
Orange, Massachusetts:
+47.6%
State:
+174.6%
Income statistics for Hispanic or Latino residents
Median household income in Orange, MA in 2022:
Orange:
$53,178
Massachusetts:
$61,523
Change in median household income between 2000 and 2022:: -47.5%
Orange, Massachusetts:
-47.5%
State:
+125.4%
Number of households with income < $10k:
Orange:
0.0% (0)
Massachusetts:
8.8% (25,307)
Number of households with income $10k - 20k:
Orange:
0.0% (0)
State:
10.0% (28,653)
Number of households with income $20k - 30k:
Orange:
0.0% (0)
State:
8.8% (25,189)
Number of households with income $30k - 40k:
Orange:
17.9% (7)
State:
7.2% (20,822)
Number of households with income $40k - 50k:
Orange:
0.0% (0)
State:
7.2% (20,817)
Number of households with income $50k - 60k:
Orange:
61.5% (24)
Massachusetts:
6.5% (18,748)
Number of households with income $60k - 75k:
Orange:
20.5% (8)
Massachusetts:
8.8% (25,390)
Number of households with income $75k - 100k:
Orange:
0.0% (0)
State:
12.0% (34,488)
Number of households with income $100k - 125k:
Orange:
0.0% (0)
Massachusetts:
8.6% (24,599)
Number of households with income $125k - 150k:
Orange:
0.0% (0)
State:
6.2% (17,743)
Number of households with income $150k - 200k:
Orange:
0.0% (0)
State:
7.3% (21,017)
Number of households with income > $200k:
Orange:
0.0% (0)
State:
8.6% (24,606)
Aggregate household income in Orange in 2022: $1,863,219
Median family income in Orange in 2022:
Orange:
$52,680
Massachusetts:
$66,072
Number of families with income < $10k:
Orange:
19.1% (8)
State:
6.2% (12,456)
Number of families with income $50k - 60k:
Orange:
58.7% (24)
Massachusetts:
7.3% (14,643)
Number of families with income $60k - 75k:
Orange:
22.2% (9)
State:
10.6% (21,252)
Median per capita income in Orange in 2022:
Orange:
$11,503
Massachusetts:
$28,993
Change in median per capita income between 2000 and 2022:: -31.0%
Orange, Massachusetts:
-31.0%
Massachusetts:
+142.4%
Income statistics for American Indian and Alaska Native residents
Number of households with income < $10k:
Orange:
0.0% (0)
State:
6.6% (451)
Number of households with income $10k - 20k:
Orange:
30.8% (4)
State:
7.0% (476)
Number of households with income $20k - 30k:
Orange:
0.0% (0)
State:
2.8% (192)
Number of households with income $30k - 40k:
Orange:
0.0% (0)
State:
3.2% (218)
Number of households with income $40k - 50k:
Orange:
0.0% (0)
State:
2.9% (199)
Number of households with income $50k - 60k:
Orange:
0.0% (0)
Massachusetts:
9.9% (677)
Number of households with income $60k - 75k:
Orange:
0.0% (0)
State:
11.5% (781)
Number of households with income $75k - 100k:
Orange:
69.2% (9)
Massachusetts:
9.2% (629)
Number of households with income $100k - 125k:
Orange:
0.0% (0)
Massachusetts:
6.0% (406)
Number of households with income $125k - 150k:
Orange:
0.0% (0)
State:
13.5% (921)
Number of households with income $150k - 200k:
Orange:
0.0% (0)
State:
12.6% (859)
Number of households with income > $200k:
Orange:
0.0% (0)
Massachusetts:
14.7% (1,003)
Median per capita income in Orange in 2022:
Orange:
$27,107
State:
$39,434
Income statistics for Multirace residents
Number of households with income < $10k:
Orange:
0.0% (0)
Massachusetts:
6.6% (15,127)
Number of households with income $10k - 20k:
Orange:
0.0% (0)
State:
9.2% (21,158)
Number of households with income $20k - 30k:
Orange:
30.4% (21)
Massachusetts:
7.8% (18,016)
Number of households with income $30k - 40k:
Orange:
0.0% (0)
State:
7.9% (18,260)
Number of households with income $40k - 50k:
Orange:
0.0% (0)
Massachusetts:
5.6% (13,027)
Number of households with income $50k - 60k:
Orange:
46.4% (32)
Massachusetts:
5.6% (12,909)
Number of households with income $60k - 75k:
Orange:
0.0% (0)
State:
9.0% (20,800)
Number of households with income $75k - 100k:
Orange:
0.0% (0)
State:
12.1% (27,875)
Number of households with income $100k - 125k:
Orange:
4.3% (3)
State:
8.1% (18,754)
Number of households with income $125k - 150k:
Orange:
18.8% (13)
State:
6.8% (15,621)
Number of households with income $150k - 200k:
Orange:
0.0% (0)
Massachusetts:
9.4% (21,618)
Number of households with income > $200k:
Orange:
0.0% (0)
State:
12.0% (27,592)
Aggregate household income in Orange in 2022: $2,339,066
Median per capita income in Orange in 2022:
Orange:
$7,000
State:
$34,029
Discuss Orange, Massachusetts (MA) on our hugely popular Massachusetts forum.