Orwell, Vermont (VT) income map, earnings map, and wages data
The median household income in Orwell, VT in 2022 was $74,717, which was about the same as the median annual income of $73,991 across the entire state of Vermont. Compared to the median income of $40,978 in 2000 this represents an increase of 45.2%. The per capita income in 2022 was $40,623, which means an increase of 51.2% compared to 2000 when it was $19,835.
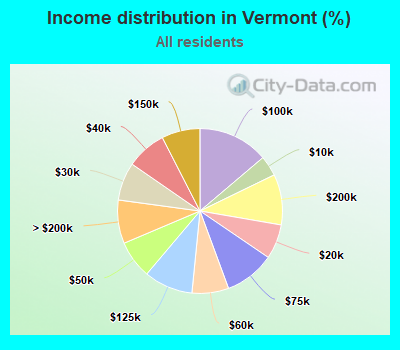
Income statistics for all residents
Median household income in Orwell, VT in 2022:| Orwell: | $74,717 |
| State: | $73,991 |
Change in median household income between 2000 and 2022:| Orwell, Vermont: | +82.3% |
| Vermont: | +81.1% |
Number of households with income < $10k:| Orwell: | 4.1% (5,706) |
| Vermont: | 4.0% (11,050) |
Number of households with income $10k - 20k:| Orwell: | 6.9% (9,609) |
| State: | 6.8% (18,853) |
Number of households with income $20k - 30k:| Orwell: | 7.5% (10,497) |
| Vermont: | 7.5% (20,673) |
Number of households with income $30k - 40k:| Orwell: | 7.8% (10,945) |
| State: | 7.8% (21,750) |
Number of households with income $40k - 50k:| Orwell: | 7.4% (10,410) |
| State: | 7.4% (20,642) |
Number of households with income $50k - 60k:| Orwell: | 7.2% (10,026) |
| State: | 7.2% (19,901) |
Number of households with income $60k - 75k:| Orwell: | 9.9% (13,820) |
| Vermont: | 9.9% (27,351) |
Number of households with income $75k - 100k:| Orwell: | 13.7% (19,198) |
| State: | 13.8% (38,275) |
Number of households with income $100k - 125k:| Orwell: | 9.6% (13,421) |
| State: | 9.6% (26,632) |
Number of households with income $125k - 150k:| Orwell: | 7.5% (10,492) |
| Vermont: | 7.5% (20,857) |
Number of households with income $150k - 200k:| Orwell: | 9.9% (13,865) |
| State: | 9.9% (27,469) |
Number of households with income > $200k:| Orwell: | 8.5% (11,877) |
| Vermont: | 8.5% (23,637) |
Aggregate household income in Orwell in 2022: $144,752,353
Median family income in Orwell in 2022:| Orwell: | $86,018 |
| State: | $96,345 |
Median non-family income in Orwell in 2022:| Orwell: | $47,375 |
| State: | $46,022 |
Change in median non-family income between 2000 and 2022:| Orwell, Vermont: | +87.9% |
| State: | +87.4% |
Median per capita income in Orwell in 2022:| Orwell: | $40,624 |
| State: | $42,251 |
Change in median per capita income between 2000 and 2022:| Orwell, Vermont: | +104.8% |
| State: | +104.9% |
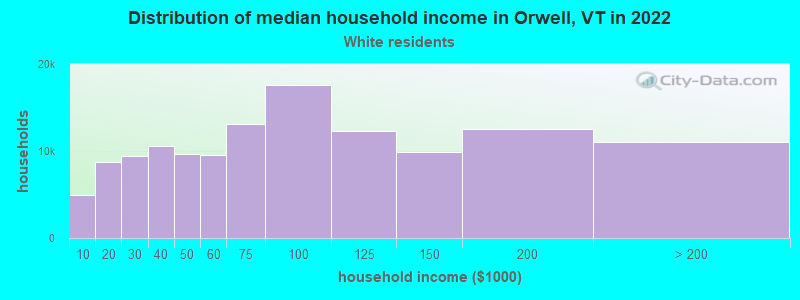
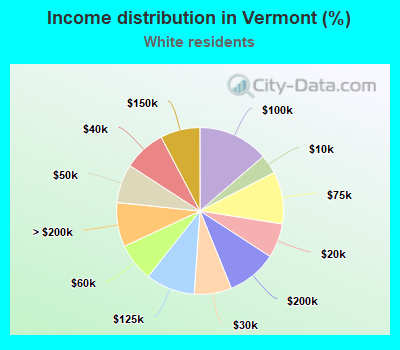
Income statistics for White residents
Median household income in Orwell, VT in 2022:| Orwell: | $74,590 |
| Vermont: | $73,591 |
Change in median household income between 2000 and 2022:| Orwell, Vermont: | +80.8% |
| Vermont: | +79.2% |
Number of households with income < $10k:| Orwell: | 3.8% (4,890) |
| State: | 3.7% (9,508) |
Number of households with income $10k - 20k:| Orwell: | 6.7% (8,697) |
| Vermont: | 6.7% (17,064) |
Number of households with income $20k - 30k:| Orwell: | 7.3% (9,418) |
| Vermont: | 7.2% (18,552) |
Number of households with income $30k - 40k:| Orwell: | 8.1% (10,521) |
| State: | 8.2% (20,886) |
Number of households with income $40k - 50k:| Orwell: | 7.5% (9,682) |
| State: | 7.5% (19,216) |
Number of households with income $50k - 60k:| Orwell: | 7.4% (9,524) |
| State: | 7.4% (18,898) |
Number of households with income $60k - 75k:| Orwell: | 10.2% (13,130) |
| State: | 10.1% (25,944) |
Number of households with income $75k - 100k:| Orwell: | 13.6% (17,546) |
| Vermont: | 13.7% (34,991) |
Number of households with income $100k - 125k:| Orwell: | 9.5% (12,287) |
| Vermont: | 9.5% (24,409) |
Number of households with income $125k - 150k:| Orwell: | 7.7% (9,929) |
| State: | 7.7% (19,710) |
Number of households with income $150k - 200k:| Orwell: | 9.7% (12,489) |
| State: | 9.7% (24,802) |
Number of households with income > $200k:| Orwell: | 8.5% (11,035) |
| Vermont: | 8.6% (21,983) |
Aggregate household income in Orwell in 2022: $133,582,162
Median family income in Orwell in 2022:| Orwell: | $85,568 |
| Vermont: | $96,147 |
Number of families with income < $10k:| Orwell: | 0.7% (2) |
| State: | 1.8% (2,669) |
Number of families with income $10k - 20k:| Orwell: | 5.6% (15) |
| State: | 3.1% (4,686) |
Number of families with income $20k - 30k:| Orwell: | 6.6% (17) |
| State: | 4.1% (6,266) |
Number of families with income $30k - 40k:| Orwell: | 7.6% (20) |
| Vermont: | 6.1% (9,273) |
Number of families with income $40k - 50k:| Orwell: | 11.6% (31) |
| State: | 6.4% (9,714) |
Number of families with income $50k - 60k:| Orwell: | 6.1% (16) |
| State: | 6.1% (9,310) |
Number of families with income $60k - 75k:| Orwell: | 5.5% (14) |
| State: | 9.3% (14,175) |
Number of families with income $75k - 100k:| Orwell: | 16.4% (43) |
| Vermont: | 15.5% (23,673) |
Number of families with income $100k - 125k:| Orwell: | 10.6% (28) |
| Vermont: | 12.7% (19,323) |
Number of families with income $125k - 150k:| Orwell: | 8.0% (21) |
| State: | 9.7% (14,805) |
Number of families with income $150k - 200k:| Orwell: | 7.6% (20) |
| Vermont: | 13.1% (20,018) |
Number of families with income > $200k:| Orwell: | 13.8% (36) |
| State: | 12.1% (18,463) |
Median non-family income in Orwell in 2022:| Orwell: | $48,244 |
| Vermont: | $45,952 |
Change in median non-family income between 2000 and 2022:| Orwell, Vermont: | +86.8% |
| State: | +86.1% |
Median per capita income in Orwell in 2022:| Orwell: | $40,975 |
| State: | $43,031 |
Change in median per capita income between 2000 and 2022:| Orwell, Vermont: | +106.2% |
| Vermont: | +106.0% |
Income statistics for Black or African American residents
Number of households with income < $10k:| Orwell: | 10.1% (4,550,196) |
| State: | 6.8% (152) |
Number of households with income $10k - 20k:| Orwell: | 11.4% (5,160,120) |
| Vermont: | 12.2% (274) |
Number of households with income $20k - 30k:| Orwell: | 9.4% (4,245,534) |
| State: | 2.5% (56) |
Number of households with income $30k - 40k:| Orwell: | 9.5% (4,277,104) |
| State: | 13.9% (312) |
Number of households with income $40k - 50k:| Orwell: | 8.5% (3,833,824) |
| Vermont: | 14.2% (320) |
Number of households with income $50k - 60k:| Orwell: | 7.5% (3,386,996) |
| Vermont: | 15.0% (338) |
Number of households with income $60k - 75k:| Orwell: | 9.5% (4,287,393) |
| State: | 8.1% (182) |
Number of households with income $75k - 100k:| Orwell: | 11.3% (5,110,677) |
| State: | 15.2% (341) |
Number of households with income $100k - 125k:| Orwell: | 7.6% (3,452,901) |
| Vermont: | 2.9% (66) |
Number of households with income $125k - 150k:| Orwell: | 4.9% (2,198,864) |
| Vermont: | 1.6% (36) |
Number of households with income $150k - 200k:| Orwell: | 5.4% (2,442,678) |
| State: | 5.2% (117) |
Number of households with income > $200k:| Orwell: | 5.1% (2,289,032) |
| State: | 2.5% (56) |
Median per capita income in Orwell in 2022:| Orwell: | $123,865 |
| State: | $40,315 |
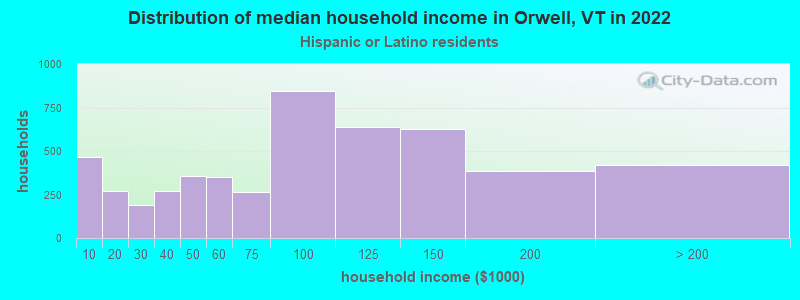
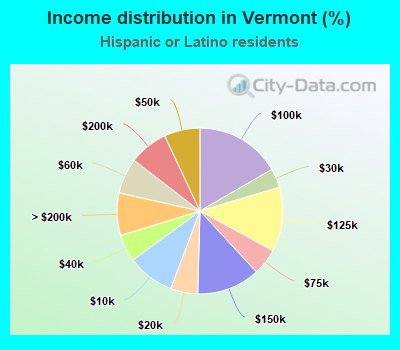
Income statistics for Hispanic or Latino residents
Median household income in Orwell, VT in 2022:| Orwell: | $85,017 |
| State: | $90,490 |
Change in median household income between 2000 and 2022:| Orwell, Vermont: | +134.5% |
| State: | +133.7% |
Number of households with income < $10k:| Orwell: | 9.2% (468) |
| State: | 9.2% (500) |
Number of households with income $10k - 20k:| Orwell: | 5.3% (270) |
| State: | 5.3% (288) |
Number of households with income $20k - 30k:| Orwell: | 3.7% (190) |
| State: | 3.7% (203) |
Number of households with income $30k - 40k:| Orwell: | 5.3% (270) |
| Vermont: | 5.3% (288) |
Number of households with income $40k - 50k:| Orwell: | 7.0% (355) |
| State: | 7.0% (379) |
Number of households with income $50k - 60k:| Orwell: | 6.9% (352) |
| State: | 6.9% (376) |
Number of households with income $60k - 75k:| Orwell: | 5.2% (264) |
| State: | 5.2% (282) |
Number of households with income $75k - 100k:| Orwell: | 16.7% (847) |
| State: | 16.7% (905) |
Number of households with income $100k - 125k:| Orwell: | 12.5% (638) |
| State: | 12.6% (682) |
Number of households with income $125k - 150k:| Orwell: | 12.3% (626) |
| State: | 12.3% (669) |
Number of households with income $150k - 200k:| Orwell: | 7.6% (386) |
| Vermont: | 7.6% (412) |
Number of households with income > $200k:| Orwell: | 8.3% (421) |
| Vermont: | 8.3% (450) |
Aggregate household income in Orwell in 2022: $1,995,807
Median family income in Orwell in 2022:| Orwell: | $90,006 |
| State: | $116,955 |
Median per capita income in Orwell in 2022:| Orwell: | $43,549 |
| State: | $36,311 |
Change in median per capita income between 2000 and 2022:| Orwell, Vermont: | +132.4% |
| State: | +131.1% |
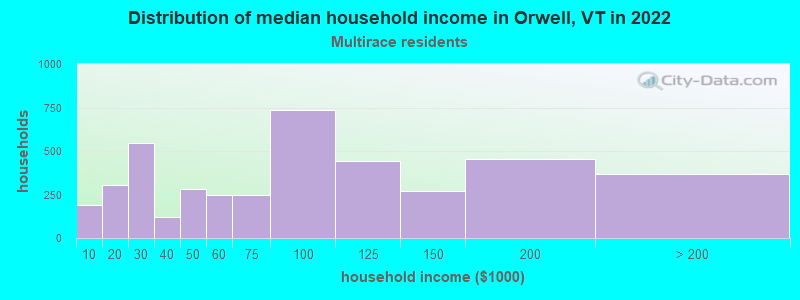
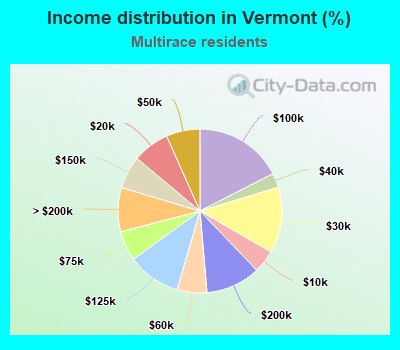
Income statistics for Multirace residents
Median household income in Orwell, VT in 2022:| Orwell: | $25,908 |
| Vermont: | $81,819 |
Number of households with income < $10k:| Orwell: | 4.5% (190) |
| State: | 4.5% (613) |
Number of households with income $10k - 20k:| Orwell: | 7.3% (306) |
| Vermont: | 7.3% (988) |
Number of households with income $20k - 30k:| Orwell: | 13.0% (547) |
| Vermont: | 13.0% (1,770) |
Number of households with income $30k - 40k:| Orwell: | 2.9% (120) |
| State: | 2.8% (386) |
Number of households with income $40k - 50k:| Orwell: | 6.7% (280) |
| State: | 6.7% (904) |
Number of households with income $50k - 60k:| Orwell: | 5.9% (246) |
| State: | 5.9% (797) |
Number of households with income $60k - 75k:| Orwell: | 5.9% (249) |
| State: | 5.9% (804) |
Number of households with income $75k - 100k:| Orwell: | 17.5% (735) |
| Vermont: | 17.5% (2,376) |
Number of households with income $100k - 125k:| Orwell: | 10.5% (441) |
| Vermont: | 10.5% (1,427) |
Number of households with income $125k - 150k:| Orwell: | 6.4% (271) |
| Vermont: | 6.5% (877) |
Number of households with income $150k - 200k:| Orwell: | 10.8% (454) |
| State: | 10.8% (1,467) |
Number of households with income > $200k:| Orwell: | 8.7% (365) |
| State: | 8.7% (1,180) |
Aggregate household income in Orwell in 2022: $938,966
Median family income in Orwell in 2022:| Orwell: | $61,712 |
| State: | $98,198 |
Median non-family income in Orwell in 2022:| Orwell: | $20,304 |
| State: | $44,940 |
Change in median non-family income between 2000 and 2022:| Orwell, Vermont: | +132.0% |
| State: | +160.3% |
Median per capita income in Orwell in 2022:| Orwell: | $24,361 |
| Vermont: | $34,567 |