Paint Lick, Kentucky (KY) income map, earnings map, and wages data
The median household income in Paint Lick, KY in 2022 was $54,701, which was 8.5% less than the median annual income of $59,341 across the entire state of Kentucky. Compared to the median income of $31,000 in 2000 this represents an increase of 43.3%. The per capita income in 2022 was $25,759, which means an increase of 47.0% compared to 2000 when it was $13,659.
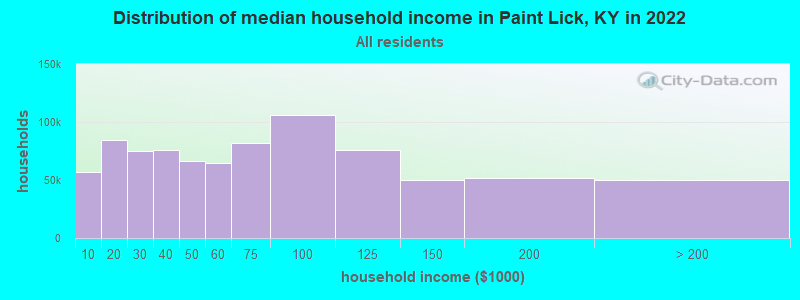
Income statistics for all residents
Median household income in Paint Lick, KY in 2022:| Paint Lick: | $54,702 |
| State: | $59,341 |
Change in median household income between 2000 and 2022:| Paint Lick, Kentucky: | +76.5% |
| Kentucky: | +76.2% |
Number of households with income < $10k:| Paint Lick: | 6.8% (56,684) |
| State: | 6.8% (123,697) |
Number of households with income $10k - 20k:| Paint Lick: | 10.0% (84,198) |
| State: | 10.0% (182,645) |
Number of households with income $20k - 30k:| Paint Lick: | 9.0% (75,335) |
| State: | 9.0% (164,092) |
Number of households with income $30k - 40k:| Paint Lick: | 9.1% (76,266) |
| State: | 9.1% (165,607) |
Number of households with income $40k - 50k:| Paint Lick: | 8.0% (66,787) |
| State: | 8.0% (146,315) |
Number of households with income $50k - 60k:| Paint Lick: | 7.7% (64,733) |
| State: | 7.7% (140,671) |
Number of households with income $60k - 75k:| Paint Lick: | 9.8% (82,279) |
| State: | 9.8% (180,002) |
Number of households with income $75k - 100k:| Paint Lick: | 12.6% (105,755) |
| State: | 12.6% (230,239) |
Number of households with income $100k - 125k:| Paint Lick: | 9.0% (75,516) |
| State: | 9.0% (164,398) |
Number of households with income $125k - 150k:| Paint Lick: | 5.9% (49,663) |
| State: | 5.9% (108,602) |
Number of households with income $150k - 200k:| Paint Lick: | 6.1% (51,450) |
| State: | 6.2% (112,813) |
Number of households with income > $200k:| Paint Lick: | 5.9% (49,661) |
| State: | 6.0% (109,599) |
Aggregate household income in Paint Lick in 2022: $1,326,122,304
Median family income in Paint Lick in 2022:| Paint Lick: | $70,012 |
| Kentucky: | $76,119 |
Median non-family income in Paint Lick in 2022:| Paint Lick: | $24,085 |
| State: | $33,993 |
Change in median non-family income between 2000 and 2022:| Paint Lick, Kentucky: | +80.5% |
| Kentucky: | +79.2% |
Median per capita income in Paint Lick in 2022:| Paint Lick: | $25,760 |
| State: | $33,980 |
Change in median per capita income between 2000 and 2022:| Paint Lick, Kentucky: | +88.6% |
| State: | +87.8% |
Income statistics for White residents
Median household income in Paint Lick, KY in 2022:| Paint Lick: | $54,209 |
| State: | $60,987 |
Change in median household income between 2000 and 2022:| Paint Lick, Kentucky: | +76.6% |
| Kentucky: | +76.2% |
Number of households with income < $10k:| Paint Lick: | 6.2% (43,293) |
| Kentucky: | 6.2% (96,690) |
Number of households with income $10k - 20k:| Paint Lick: | 9.8% (67,992) |
| State: | 9.7% (151,125) |
Number of households with income $20k - 30k:| Paint Lick: | 9.0% (62,404) |
| State: | 8.9% (139,532) |
Number of households with income $30k - 40k:| Paint Lick: | 9.1% (63,712) |
| Kentucky: | 9.1% (142,284) |
Number of households with income $40k - 50k:| Paint Lick: | 7.7% (53,688) |
| State: | 7.7% (121,151) |
Number of households with income $50k - 60k:| Paint Lick: | 7.7% (53,700) |
| State: | 7.7% (119,790) |
Number of households with income $60k - 75k:| Paint Lick: | 9.8% (68,371) |
| State: | 9.9% (154,174) |
Number of households with income $75k - 100k:| Paint Lick: | 12.8% (89,088) |
| Kentucky: | 12.8% (199,740) |
Number of households with income $100k - 125k:| Paint Lick: | 9.4% (65,134) |
| Kentucky: | 9.4% (146,284) |
Number of households with income $125k - 150k:| Paint Lick: | 6.0% (41,737) |
| State: | 6.0% (94,180) |
Number of households with income $150k - 200k:| Paint Lick: | 6.4% (44,432) |
| State: | 6.4% (100,702) |
Number of households with income > $200k:| Paint Lick: | 6.2% (43,001) |
| State: | 6.3% (98,502) |
Aggregate household income in Paint Lick in 2022: $1,102,117,196
Median family income in Paint Lick in 2022:| Paint Lick: | $71,963 |
| State: | $78,353 |
Number of families with income < $10k:| Paint Lick: | 3.3% (19) |
| State: | 3.7% (37,075) |
Number of families with income $10k - 20k:| Paint Lick: | 9.2% (55) |
| State: | 4.9% (49,864) |
Number of families with income $20k - 30k:| Paint Lick: | 7.5% (45) |
| Kentucky: | 6.4% (64,043) |
Number of families with income $30k - 40k:| Paint Lick: | 12.7% (76) |
| State: | 8.0% (81,080) |
Number of families with income $40k - 50k:| Paint Lick: | 16.0% (95) |
| State: | 6.9% (69,099) |
Number of families with income $50k - 60k:| Paint Lick: | 8.2% (49) |
| State: | 7.2% (72,955) |
Number of families with income $60k - 75k:| Paint Lick: | 8.7% (51) |
| State: | 10.4% (104,587) |
Number of families with income $75k - 100k:| Paint Lick: | 14.3% (85) |
| Kentucky: | 15.0% (151,545) |
Number of families with income $100k - 125k:| Paint Lick: | 7.1% (42) |
| Kentucky: | 11.9% (120,340) |
Number of families with income $125k - 150k:| Paint Lick: | 4.8% (29) |
| Kentucky: | 8.1% (81,620) |
Number of families with income $150k - 200k:| Paint Lick: | 8.2% (49) |
| State: | 8.8% (89,097) |
Median non-family income in Paint Lick in 2022:| Paint Lick: | $24,339 |
| Kentucky: | $34,415 |
Change in median non-family income between 2000 and 2022:| Paint Lick, Kentucky: | +79.7% |
| Kentucky: | +78.3% |
Median per capita income in Paint Lick in 2022:| Paint Lick: | $26,283 |
| State: | $35,352 |
Change in median per capita income between 2000 and 2022:| Paint Lick, Kentucky: | +90.9% |
| State: | +90.2% |
Income statistics for Black or African American residents
Number of households with income < $10k:| Paint Lick: | 12.3% (13,734) |
| State: | 12.3% (17,072) |
Number of households with income $10k - 20k:| Paint Lick: | 13.6% (15,129) |
| State: | 13.6% (18,796) |
Number of households with income $20k - 30k:| Paint Lick: | 10.9% (12,122) |
| Kentucky: | 10.9% (15,069) |
Number of households with income $30k - 40k:| Paint Lick: | 9.0% (10,074) |
| State: | 9.0% (12,510) |
Number of households with income $40k - 50k:| Paint Lick: | 10.2% (11,388) |
| Kentucky: | 10.2% (14,121) |
Number of households with income $50k - 60k:| Paint Lick: | 8.1% (8,980) |
| State: | 8.1% (11,147) |
Number of households with income $60k - 75k:| Paint Lick: | 8.9% (9,943) |
| Kentucky: | 8.9% (12,361) |
Number of households with income $75k - 100k:| Paint Lick: | 10.1% (11,308) |
| Kentucky: | 10.1% (14,009) |
Number of households with income $100k - 125k:| Paint Lick: | 6.1% (6,766) |
| Kentucky: | 6.1% (8,400) |
Number of households with income $125k - 150k:| Paint Lick: | 4.3% (4,789) |
| State: | 4.3% (5,950) |
Number of households with income $150k - 200k:| Paint Lick: | 4.0% (4,465) |
| State: | 4.0% (5,560) |
Number of households with income > $200k:| Paint Lick: | 2.5% (2,759) |
| State: | 2.5% (3,413) |
Median per capita income in Paint Lick in 2022:| Paint Lick: | $43,184 |
| State: | $27,117 |
Change in median per capita income between 2000 and 2022:| Paint Lick, Kentucky: | +102.4% |
| State: | +104.9% |
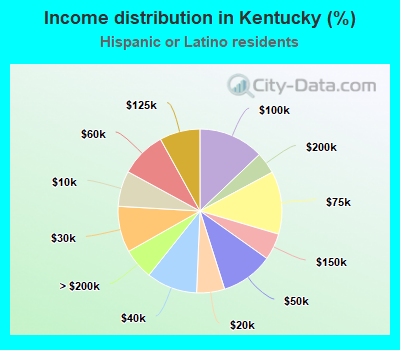
Income statistics for Hispanic or Latino residents
Median household income in Paint Lick, KY in 2022:| Paint Lick: | $71,635 |
| State: | $57,971 |
Change in median household income between 2000 and 2022:| Paint Lick, Kentucky: | +117.8% |
| State: | +96.2% |
Number of households with income < $10k:| Paint Lick: | 7.0% (1,988) |
| State: | 7.0% (3,568) |
Number of households with income $10k - 20k:| Paint Lick: | 5.5% (1,555) |
| State: | 5.5% (2,811) |
Number of households with income $20k - 30k:| Paint Lick: | 9.1% (2,566) |
| Kentucky: | 9.1% (4,637) |
Number of households with income $30k - 40k:| Paint Lick: | 10.1% (2,846) |
| Kentucky: | 10.0% (5,109) |
Number of households with income $40k - 50k:| Paint Lick: | 10.3% (2,900) |
| State: | 10.3% (5,241) |
Number of households with income $50k - 60k:| Paint Lick: | 9.0% (2,547) |
| Kentucky: | 9.1% (4,609) |
Number of households with income $60k - 75k:| Paint Lick: | 12.4% (3,493) |
| State: | 12.4% (6,299) |
Number of households with income $75k - 100k:| Paint Lick: | 13.0% (3,674) |
| Kentucky: | 12.9% (6,562) |
Number of households with income $100k - 125k:| Paint Lick: | 8.0% (2,263) |
| Kentucky: | 8.0% (4,066) |
Number of households with income $125k - 150k:| Paint Lick: | 5.3% (1,499) |
| State: | 5.3% (2,685) |
Number of households with income $150k - 200k:| Paint Lick: | 4.3% (1,208) |
| State: | 4.3% (2,173) |
Number of households with income > $200k:| Paint Lick: | 6.1% (1,714) |
| State: | 6.1% (3,099) |
Aggregate household income in Paint Lick in 2022: $4,111,241
Median family income in Paint Lick in 2022:| Paint Lick: | $68,657 |
| Kentucky: | $58,603 |
Number of families with income < $10k:| Paint Lick: | 4.7% (1) |
| Kentucky: | 5.3% (1,907) |
Number of families with income $10k - 20k:| Paint Lick: | 13.1% (3) |
| State: | 6.4% (2,298) |
Number of families with income $20k - 30k:| Paint Lick: | 10.6% (3) |
| State: | 9.4% (3,414) |
Number of families with income $30k - 40k:| Paint Lick: | 16.0% (4) |
| Kentucky: | 11.1% (4,022) |
Number of families with income $40k - 50k:| Paint Lick: | 22.8% (6) |
| State: | 11.2% (4,054) |
Number of families with income $50k - 60k:| Paint Lick: | 6.8% (2) |
| Kentucky: | 7.2% (2,594) |
Number of families with income $60k - 75k:| Paint Lick: | 6.8% (2) |
| Kentucky: | 10.1% (3,652) |
Number of families with income $75k - 100k:| Paint Lick: | 10.1% (2) |
| State: | 13.4% (4,856) |
Number of families with income $100k - 125k:| Paint Lick: | 3.6% (1) |
| State: | 8.0% (2,906) |
Number of families with income $125k - 150k:| Paint Lick: | 2.8% (1) |
| State: | 6.1% (2,200) |
Number of families with income $150k - 200k:| Paint Lick: | 2.7% (1) |
| State: | 3.8% (1,372) |
Median non-family income in Paint Lick in 2022:| Paint Lick: | $52,279 |
| State: | $43,780 |
Change in median non-family income between 2000 and 2022:| Paint Lick, Kentucky: | +146.0% |
| State: | +112.1% |
Median per capita income in Paint Lick in 2022:| Paint Lick: | $18,697 |
| State: | $24,650 |
Change in median per capita income between 2000 and 2022:| Paint Lick, Kentucky: | +106.9% |
| State: | +106.1% |
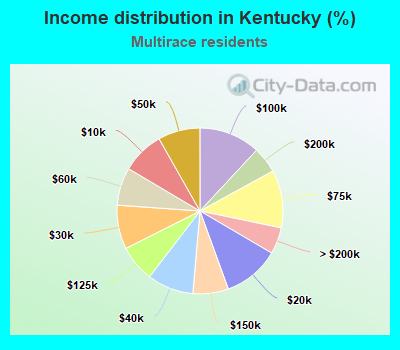
Income statistics for Multirace residents
Median household income in Paint Lick, KY in 2022:| Paint Lick: | $30,323 |
| State: | $56,359 |
Change in median household income between 2000 and 2022:| Paint Lick, Kentucky: | +108.7% |
| Kentucky: | +107.8% |
Number of households with income < $10k:| Paint Lick: | 8.2% (1,790) |
| Kentucky: | 8.3% (6,780) |
Number of households with income $10k - 20k:| Paint Lick: | 11.1% (2,410) |
| State: | 11.0% (9,005) |
Number of households with income $20k - 30k:| Paint Lick: | 8.5% (1,841) |
| State: | 8.6% (7,004) |
Number of households with income $30k - 40k:| Paint Lick: | 9.1% (1,977) |
| State: | 9.0% (7,406) |
Number of households with income $40k - 50k:| Paint Lick: | 8.2% (1,779) |
| Kentucky: | 8.2% (6,707) |
Number of households with income $50k - 60k:| Paint Lick: | 7.4% (1,599) |
| State: | 7.4% (6,048) |
Number of households with income $60k - 75k:| Paint Lick: | 11.2% (2,441) |
| State: | 11.2% (9,202) |
Number of households with income $75k - 100k:| Paint Lick: | 11.9% (2,587) |
| State: | 11.9% (9,767) |
Number of households with income $100k - 125k:| Paint Lick: | 7.2% (1,562) |
| State: | 7.1% (5,846) |
Number of households with income $125k - 150k:| Paint Lick: | 6.9% (1,503) |
| State: | 6.9% (5,667) |
Number of households with income $150k - 200k:| Paint Lick: | 5.1% (1,107) |
| State: | 5.1% (4,171) |
Number of households with income > $200k:| Paint Lick: | 5.1% (1,118) |
| State: | 5.2% (4,241) |
Aggregate household income in Paint Lick in 2022: $17,315,072
Median family income in Paint Lick in 2022:| Paint Lick: | $190,185 |
| State: | $67,296 |
Number of families with income $10k - 20k:| Paint Lick: | 16.6% (31) |
| State: | 8.5% (4,693) |
Number of families with income $75k - 100k:| Paint Lick: | 83.4% (155) |
| State: | 13.8% (7,574) |
Median non-family income in Paint Lick in 2022:| Paint Lick: | $18,206 |
| State: | $33,660 |
Change in median non-family income between 2000 and 2022:| Paint Lick, Kentucky: | +108.1% |
| Kentucky: | +117.1% |
Median per capita income in Paint Lick in 2022:| Paint Lick: | $28,137 |
| State: | $25,670 |
Change in median per capita income between 2000 and 2022:| Paint Lick, Kentucky: | +131.8% |
| State: | +132.3% |
Income statistics for other residents
Number of households with income < $10k:| Paint Lick: | 7.7% (3) |
| State: | 7.2% (1,360) |
Number of households with income $10k - 20k:| Paint Lick: | 7.7% (3) |
| State: | 8.0% (1,524) |
Number of households with income $20k - 30k:| Paint Lick: | 7.7% (3) |
| Kentucky: | 8.6% (1,635) |
Number of households with income $30k - 40k:| Paint Lick: | 10.3% (4) |
| State: | 11.1% (2,110) |
Number of households with income $40k - 50k:| Paint Lick: | 12.8% (5) |
| State: | 12.0% (2,269) |
Number of households with income $50k - 60k:| Paint Lick: | 5.1% (2) |
| State: | 5.1% (964) |
Number of households with income $60k - 75k:| Paint Lick: | 12.8% (5) |
| State: | 13.0% (2,456) |
Number of households with income $75k - 100k:| Paint Lick: | 17.9% (7) |
| Kentucky: | 17.5% (3,305) |
Number of households with income $100k - 125k:| Paint Lick: | 7.7% (3) |
| State: | 7.6% (1,433) |
Number of households with income $125k - 150k:| Paint Lick: | 2.6% (1) |
| State: | 3.4% (649) |
Number of households with income $150k - 200k:| Paint Lick: | 5.1% (2) |
| State: | 4.4% (833) |
Number of households with income > $200k:| Paint Lick: | 2.6% (1) |
| State: | 2.1% (395) |
Aggregate household income in Paint Lick in 2022: $2,970,867
Median family income in Paint Lick in 2022:| Paint Lick: | $53,712 |
| Kentucky: | $47,340 |
Number of families with income $30k - 40k:| Paint Lick: | 100.0% (54) |
| Kentucky: | 14.0% (1,981) |
Median per capita income in Paint Lick in 2022:| Paint Lick: | $9,577 |
| State: | $20,913 |
Change in median per capita income between 2000 and 2022:| Paint Lick, Kentucky: | +87.7% |
| Kentucky: | +98.1% |