Paxton, Massachusetts (MA) income map, earnings map, and wages data
The median household income in Paxton, MA in 2022 was $129,797, which was 27.2% greater than the median annual income of $94,488 across the entire state of Massachusetts. Compared to the median income of $72,039 in 2000 this represents an increase of 44.5%. The per capita income in 2022 was $57,661, which means an increase of 48.7% compared to 2000 when it was $29,573.
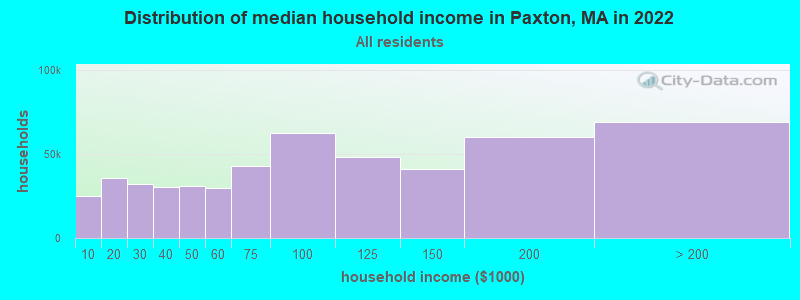
Income statistics for all residents
Median household income in Paxton, MA in 2022:| Paxton: | $129,798 |
| Massachusetts: | $94,488 |
Change in median household income between 2000 and 2022:| Paxton, Massachusetts: | +80.2% |
| State: | +87.1% |
Number of households with income < $10k:| Paxton: | 4.9% (24,969) |
| Massachusetts: | 5.2% (146,170) |
Number of households with income $10k - 20k:| Paxton: | 7.0% (35,624) |
| State: | 6.4% (180,001) |
Number of households with income $20k - 30k:| Paxton: | 6.4% (32,444) |
| State: | 5.6% (156,667) |
Number of households with income $30k - 40k:| Paxton: | 5.9% (30,197) |
| State: | 5.6% (157,168) |
Number of households with income $40k - 50k:| Paxton: | 6.1% (30,923) |
| State: | 5.4% (151,455) |
Number of households with income $50k - 60k:| Paxton: | 5.8% (29,608) |
| State: | 5.1% (142,726) |
Number of households with income $60k - 75k:| Paxton: | 8.4% (42,965) |
| Massachusetts: | 7.6% (212,203) |
Number of households with income $75k - 100k:| Paxton: | 12.3% (62,491) |
| State: | 11.3% (317,064) |
Number of households with income $100k - 125k:| Paxton: | 9.5% (48,506) |
| State: | 9.7% (270,603) |
Number of households with income $125k - 150k:| Paxton: | 8.1% (41,449) |
| State: | 8.0% (223,140) |
Number of households with income $150k - 200k:| Paxton: | 11.9% (60,368) |
| Massachusetts: | 11.0% (308,695) |
Number of households with income > $200k:| Paxton: | 13.6% (69,197) |
| Massachusetts: | 19.0% (531,884) |
Aggregate household income in Paxton in 2022: $2,280,792,049
Median family income in Paxton in 2022:| Paxton: | $148,118 |
| State: | $120,263 |
Median non-family income in Paxton in 2022:| Paxton: | $71,955 |
| State: | $55,979 |
Change in median non-family income between 2000 and 2022:| Paxton, Massachusetts: | +85.7% |
| Massachusetts: | +88.0% |
Median per capita income in Paxton in 2022:| Paxton: | $57,661 |
| Massachusetts: | $54,025 |
Change in median per capita income between 2000 and 2022:| Paxton, Massachusetts: | +95.0% |
| State: | +108.2% |
Income statistics for White residents
Median household income in Paxton, MA in 2022:| Paxton: | $132,490 |
| State: | $101,391 |
Change in median household income between 2000 and 2022:| Paxton, Massachusetts: | +85.1% |
| State: | +93.3% |
Number of households with income < $10k:| Paxton: | 4.6% (17,696) |
| State: | 4.4% (91,120) |
Number of households with income $10k - 20k:| Paxton: | 6.5% (25,305) |
| State: | 5.9% (122,055) |
Number of households with income $20k - 30k:| Paxton: | 6.1% (23,464) |
| Massachusetts: | 5.1% (105,311) |
Number of households with income $30k - 40k:| Paxton: | 5.5% (21,172) |
| State: | 5.3% (110,239) |
Number of households with income $40k - 50k:| Paxton: | 5.6% (21,677) |
| Massachusetts: | 5.0% (104,636) |
Number of households with income $50k - 60k:| Paxton: | 5.4% (21,021) |
| State: | 4.8% (99,486) |
Number of households with income $60k - 75k:| Paxton: | 8.4% (32,553) |
| Massachusetts: | 7.5% (155,124) |
Number of households with income $75k - 100k:| Paxton: | 12.2% (47,308) |
| Massachusetts: | 11.4% (236,252) |
Number of households with income $100k - 125k:| Paxton: | 10.1% (39,313) |
| Massachusetts: | 9.9% (204,731) |
Number of households with income $125k - 150k:| Paxton: | 8.4% (32,421) |
| Massachusetts: | 8.5% (175,324) |
Number of households with income $150k - 200k:| Paxton: | 12.5% (48,300) |
| State: | 11.7% (242,980) |
Number of households with income > $200k:| Paxton: | 14.7% (57,130) |
| State: | 20.5% (425,966) |
Aggregate household income in Paxton in 2022: $1,870,850,439
Median family income in Paxton in 2022:| Paxton: | $155,051 |
| Massachusetts: | $133,153 |
Number of families with income $10k - 20k:| Paxton: | 0.7% (11) |
| Massachusetts: | 2.1% (26,403) |
Number of families with income $20k - 30k:| Paxton: | 1.9% (31) |
| State: | 2.6% (32,525) |
Number of families with income $30k - 40k:| Paxton: | 2.1% (33) |
| Massachusetts: | 3.9% (48,079) |
Number of families with income $40k - 50k:| Paxton: | 2.0% (32) |
| State: | 3.8% (46,908) |
Number of families with income $50k - 60k:| Paxton: | 3.2% (51) |
| State: | 3.8% (46,476) |
Number of families with income $60k - 75k:| Paxton: | 4.3% (69) |
| State: | 6.4% (79,040) |
Number of families with income $75k - 100k:| Paxton: | 12.7% (203) |
| State: | 11.1% (137,395) |
Number of families with income $100k - 125k:| Paxton: | 10.0% (159) |
| State: | 11.1% (136,771) |
Number of families with income $125k - 150k:| Paxton: | 8.0% (128) |
| State: | 10.0% (123,709) |
Number of families with income $150k - 200k:| Paxton: | 24.9% (398) |
| State: | 14.7% (181,602) |
Number of families with income > $200k:| Paxton: | 30.2% (483) |
| State: | 28.5% (351,887) |
Median non-family income in Paxton in 2022:| Paxton: | $74,401 |
| State: | $59,323 |
Change in median non-family income between 2000 and 2022:| Paxton, Massachusetts: | +92.0% |
| State: | +94.3% |
Median per capita income in Paxton in 2022:| Paxton: | $61,157 |
| State: | $60,804 |
Change in median per capita income between 2000 and 2022:| Paxton, Massachusetts: | +105.3% |
| State: | +118.7% |
Income statistics for Black or African American residents
Median household income in Paxton, MA in 2022:| Paxton: | $173,644 |
| Massachusetts: | $63,189 |
Change in median household income between 2000 and 2022:| Paxton, Massachusetts: | +69.8% |
| State: | +87.4% |
Number of households with income < $10k:| Paxton: | 7.3% (3,294) |
| Massachusetts: | 9.1% (15,797) |
Number of households with income $10k - 20k:| Paxton: | 11.9% (5,381) |
| State: | 9.4% (16,267) |
Number of households with income $20k - 30k:| Paxton: | 9.8% (4,433) |
| State: | 7.8% (13,520) |
Number of households with income $30k - 40k:| Paxton: | 3.3% (1,471) |
| State: | 8.3% (14,412) |
Number of households with income $40k - 50k:| Paxton: | 13.5% (6,098) |
| Massachusetts: | 7.9% (13,790) |
Number of households with income $50k - 60k:| Paxton: | 5.8% (2,607) |
| Massachusetts: | 5.8% (10,041) |
Number of households with income $60k - 75k:| Paxton: | 10.7% (4,850) |
| State: | 8.5% (14,822) |
Number of households with income $75k - 100k:| Paxton: | 13.0% (5,890) |
| State: | 11.0% (19,122) |
Number of households with income $100k - 125k:| Paxton: | 7.5% (3,400) |
| Massachusetts: | 8.4% (14,575) |
Number of households with income $125k - 150k:| Paxton: | 5.0% (2,246) |
| State: | 6.0% (10,429) |
Number of households with income $150k - 200k:| Paxton: | 7.3% (3,277) |
| State: | 7.2% (12,539) |
Number of households with income > $200k:| Paxton: | 4.9% (2,231) |
| State: | 10.5% (18,185) |
Aggregate household income in Paxton in 2022: $1,341,482
Median family income in Paxton in 2022:| Paxton: | $167,788 |
| Massachusetts: | $79,815 |
Number of families with income $100k - 125k:| Paxton: | 100.0% (16) |
| Massachusetts: | 10.4% (11,452) |
Median per capita income in Paxton in 2022:| Paxton: | $46,429 |
| State: | $33,524 |
Change in median per capita income between 2000 and 2022:| Paxton, Massachusetts: | +95.7% |
| State: | +109.4% |
Income statistics for Asian residents
Median household income in Paxton, MA in 2022:| Paxton: | $227,020 |
| State: | $117,855 |
Change in median household income between 2000 and 2022:| Paxton, Massachusetts: | +149.6% |
| State: | +129.9% |
Number of households with income < $10k:| Paxton: | 5.7% (1,440) |
| State: | 6.8% (11,982) |
Number of households with income $10k - 20k:| Paxton: | 5.8% (1,447) |
| State: | 4.8% (8,376) |
Number of households with income $20k - 30k:| Paxton: | 1.9% (478) |
| Massachusetts: | 3.7% (6,558) |
Number of households with income $30k - 40k:| Paxton: | 3.5% (890) |
| State: | 3.3% (5,748) |
Number of households with income $40k - 50k:| Paxton: | 4.9% (1,237) |
| State: | 4.1% (7,192) |
Number of households with income $50k - 60k:| Paxton: | 3.5% (880) |
| State: | 5.0% (8,734) |
Number of households with income $60k - 75k:| Paxton: | 4.3% (1,090) |
| State: | 5.8% (10,203) |
Number of households with income $75k - 100k:| Paxton: | 6.1% (1,530) |
| Massachusetts: | 8.6% (15,154) |
Number of households with income $100k - 125k:| Paxton: | 9.7% (2,447) |
| Massachusetts: | 10.8% (18,942) |
Number of households with income $125k - 150k:| Paxton: | 8.1% (2,027) |
| Massachusetts: | 8.0% (14,037) |
Number of households with income $150k - 200k:| Paxton: | 21.1% (5,296) |
| State: | 12.5% (21,856) |
Number of households with income > $200k:| Paxton: | 25.4% (6,374) |
| Massachusetts: | 26.6% (46,694) |
Aggregate household income in Paxton in 2022: $2,535,828
Median family income in Paxton in 2022:| Paxton: | $243,651 |
| Massachusetts: | $140,113 |
Median per capita income in Paxton in 2022:| Paxton: | $46,665 |
| State: | $58,900 |
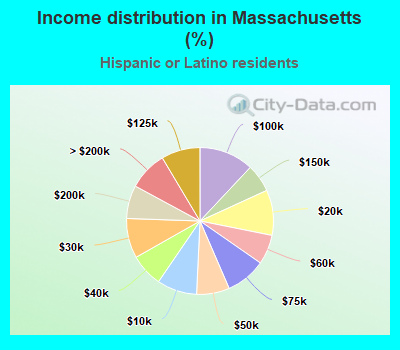
Income statistics for Hispanic or Latino residents
Median household income in Paxton, MA in 2022:| Paxton: | $233,348 |
| State: | $61,523 |
Change in median household income between 2000 and 2022:| Paxton, Massachusetts: | +116.0% |
| State: | +125.4% |
Number of households with income < $10k:| Paxton: | 8.1% (11,943) |
| State: | 8.8% (25,307) |
Number of households with income $10k - 20k:| Paxton: | 10.5% (15,359) |
| Massachusetts: | 10.0% (28,653) |
Number of households with income $20k - 30k:| Paxton: | 10.3% (15,189) |
| State: | 8.8% (25,189) |
Number of households with income $30k - 40k:| Paxton: | 9.5% (13,972) |
| Massachusetts: | 7.2% (20,822) |
Number of households with income $40k - 50k:| Paxton: | 7.1% (10,449) |
| State: | 7.2% (20,817) |
Number of households with income $50k - 60k:| Paxton: | 8.0% (11,734) |
| Massachusetts: | 6.5% (18,748) |
Number of households with income $60k - 75k:| Paxton: | 11.1% (16,261) |
| Massachusetts: | 8.8% (25,390) |
Number of households with income $75k - 100k:| Paxton: | 14.1% (20,690) |
| Massachusetts: | 12.0% (34,488) |
Number of households with income $100k - 125k:| Paxton: | 5.7% (8,352) |
| State: | 8.6% (24,599) |
Number of households with income $125k - 150k:| Paxton: | 8.8% (12,972) |
| State: | 6.2% (17,743) |
Number of households with income $150k - 200k:| Paxton: | 3.6% (5,216) |
| State: | 7.3% (21,017) |
Number of households with income > $200k:| Paxton: | 3.2% (4,676) |
| State: | 8.6% (24,606) |
Aggregate household income in Paxton in 2022: $8,704,670
Median family income in Paxton in 2022:| Paxton: | $242,553 |
| State: | $66,072 |
Number of families with income $10k - 20k:| Paxton: | 1.9% (3) |
| State: | 6.0% (12,071) |
Number of families with income $20k - 30k:| Paxton: | 9.7% (15) |
| State: | 10.1% (20,376) |
Number of families with income $30k - 40k:| Paxton: | 6.4% (10) |
| State: | 8.2% (16,470) |
Number of families with income $40k - 50k:| Paxton: | 8.2% (13) |
| State: | 7.4% (14,829) |
Number of families with income $50k - 60k:| Paxton: | 11.2% (17) |
| Massachusetts: | 7.3% (14,643) |
Number of families with income $60k - 75k:| Paxton: | 7.7% (12) |
| Massachusetts: | 10.6% (21,252) |
Number of families with income $75k - 100k:| Paxton: | 19.7% (31) |
| State: | 12.0% (24,088) |
Number of families with income $100k - 125k:| Paxton: | 6.1% (9) |
| Massachusetts: | 8.9% (17,954) |
Number of families with income $125k - 150k:| Paxton: | 12.3% (19) |
| State: | 6.9% (13,837) |
Number of families with income $150k - 200k:| Paxton: | 7.7% (12) |
| Massachusetts: | 7.3% (14,683) |
Number of families with income > $200k:| Paxton: | 9.0% (14) |
| Massachusetts: | 9.3% (18,741) |
Median non-family income in Paxton in 2022:| Paxton: | $66,103 |
| State: | $37,563 |
Change in median non-family income between 2000 and 2022:| Paxton, Massachusetts: | +95.9% |
| State: | +115.0% |
Median per capita income in Paxton in 2022:| Paxton: | $52,040 |
| State: | $28,993 |
Change in median per capita income between 2000 and 2022:| Paxton, Massachusetts: | +110.9% |
| Massachusetts: | +142.4% |
Income statistics for Multirace residents
Number of households with income < $10k:| Paxton: | 7.4% (998) |
| Massachusetts: | 6.6% (15,127) |
Number of households with income $10k - 20k:| Paxton: | 10.3% (1,388) |
| State: | 9.2% (21,158) |
Number of households with income $20k - 30k:| Paxton: | 10.2% (1,372) |
| State: | 7.8% (18,016) |
Number of households with income $30k - 40k:| Paxton: | 11.3% (1,518) |
| Massachusetts: | 7.9% (18,260) |
Number of households with income $40k - 50k:| Paxton: | 6.2% (833) |
| State: | 5.6% (13,027) |
Number of households with income $50k - 60k:| Paxton: | 8.7% (1,173) |
| Massachusetts: | 5.6% (12,909) |
Number of households with income $60k - 75k:| Paxton: | 8.2% (1,097) |
| Massachusetts: | 9.0% (20,800) |
Number of households with income $75k - 100k:| Paxton: | 13.5% (1,813) |
| State: | 12.1% (27,875) |
Number of households with income $100k - 125k:| Paxton: | 6.2% (829) |
| State: | 8.1% (18,754) |
Number of households with income $125k - 150k:| Paxton: | 6.4% (863) |
| State: | 6.8% (15,621) |
Number of households with income $150k - 200k:| Paxton: | 5.9% (796) |
| State: | 9.4% (21,618) |
Number of households with income > $200k:| Paxton: | 5.6% (748) |
| State: | 12.0% (27,592) |
Median per capita income in Paxton in 2022:| Paxton: | $12,241 |
| State: | $34,029 |
Change in median per capita income between 2000 and 2022:| Paxton, Massachusetts: | +104.0% |
| State: | +132.1% |
Income statistics for other residents
Number of households with income < $10k:| Paxton: | 2.6% (242) |
| State: | 8.4% (11,559) |
Number of households with income $10k - 20k:| Paxton: | 5.7% (545) |
| State: | 8.4% (11,499) |
Number of households with income $20k - 30k:| Paxton: | 6.2% (592) |
| Massachusetts: | 9.5% (13,070) |
Number of households with income $30k - 40k:| Paxton: | 10.5% (998) |
| Massachusetts: | 6.0% (8,291) |
Number of households with income $40k - 50k:| Paxton: | 9.1% (859) |
| State: | 9.2% (12,611) |
Number of households with income $50k - 60k:| Paxton: | 9.0% (855) |
| State: | 7.9% (10,879) |
Number of households with income $60k - 75k:| Paxton: | 11.0% (1,046) |
| State: | 7.5% (10,239) |
Number of households with income $75k - 100k:| Paxton: | 18.6% (1,764) |
| Massachusetts: | 13.1% (18,032) |
Number of households with income $100k - 125k:| Paxton: | 6.5% (613) |
| State: | 9.6% (13,141) |
Number of households with income $125k - 150k:| Paxton: | 8.4% (795) |
| State: | 5.0% (6,808) |
Number of households with income $150k - 200k:| Paxton: | 7.9% (753) |
| State: | 6.4% (8,843) |
Number of households with income > $200k:| Paxton: | 4.4% (419) |
| State: | 9.0% (12,396) |
Median per capita income in Paxton in 2022:| Paxton: | $22,421 |
| State: | $30,797 |