Seven Trees, California (CA) income map, earnings map, and wages data
The median household income in Seven Trees, CA in 2022 was $69,753, which was 31.3% less than the median annual income of $91,551 across the entire state of California. Compared to the median income of $34,375 in 2000 this represents an increase of 50.7%. The per capita income in 2022 was $39,359, which means an increase of 56.8% compared to 2000 when it was $17,012.
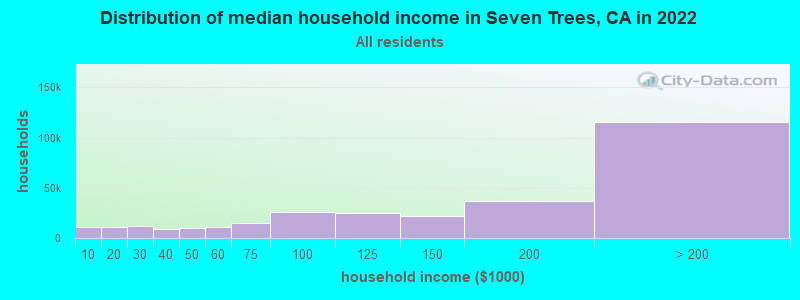
Income statistics for all residents
Median household income in Seven Trees, CA in 2022:| Seven Trees: | $69,753 |
| California: | $91,551 |
Change in median household income between 2000 and 2022:| Seven Trees, California: | +102.9% |
| State: | +92.8% |
Number of households with income < $10k:| Seven Trees: | 3.4% (10,465) |
| State: | 4.8% (654,370) |
Number of households with income $10k - 20k:| Seven Trees: | 3.6% (10,841) |
| California: | 5.8% (789,493) |
Number of households with income $20k - 30k:| Seven Trees: | 3.8% (11,596) |
| California: | 5.7% (778,318) |
Number of households with income $30k - 40k:| Seven Trees: | 2.9% (8,690) |
| California: | 5.8% (783,170) |
Number of households with income $40k - 50k:| Seven Trees: | 3.3% (10,015) |
| California: | 5.8% (781,352) |
Number of households with income $50k - 60k:| Seven Trees: | 3.6% (10,997) |
| California: | 5.6% (760,175) |
Number of households with income $60k - 75k:| Seven Trees: | 5.1% (15,376) |
| State: | 8.2% (1,104,699) |
Number of households with income $75k - 100k:| Seven Trees: | 8.5% (25,693) |
| State: | 12.0% (1,627,633) |
Number of households with income $100k - 125k:| Seven Trees: | 8.3% (25,234) |
| California: | 10.0% (1,358,619) |
Number of households with income $125k - 150k:| Seven Trees: | 7.3% (22,025) |
| California: | 7.6% (1,027,455) |
Number of households with income $150k - 200k:| Seven Trees: | 12.3% (37,198) |
| California: | 10.6% (1,439,811) |
Number of households with income > $200k:| Seven Trees: | 38.0% (115,447) |
| State: | 18.0% (2,445,491) |
Aggregate household income in Seven Trees in 2022: $1,417,596,160
Median family income in Seven Trees in 2022:| Seven Trees: | $92,027 |
| State: | $104,823 |
Median non-family income in Seven Trees in 2022:| Seven Trees: | $41,287 |
| California: | $59,348 |
Change in median non-family income between 2000 and 2022:| Seven Trees, California: | +86.1% |
| California: | +85.3% |
Median per capita income in Seven Trees in 2022:| Seven Trees: | $39,360 |
| State: | $46,661 |
Change in median per capita income between 2000 and 2022:| Seven Trees, California: | +131.4% |
| State: | +105.5% |
Income statistics for White residents
Median household income in Seven Trees, CA in 2022:| Seven Trees: | $56,885 |
| State: | $100,917 |
Change in median household income between 2000 and 2022:| Seven Trees, California: | +101.5% |
| State: | +96.8% |
Number of households with income < $10k:| Seven Trees: | 3.0% (2,662) |
| State: | 4.4% (284,109) |
Number of households with income $10k - 20k:| Seven Trees: | 3.4% (3,022) |
| California: | 5.3% (340,330) |
Number of households with income $20k - 30k:| Seven Trees: | 3.7% (3,277) |
| State: | 5.3% (343,145) |
Number of households with income $30k - 40k:| Seven Trees: | 3.1% (2,782) |
| California: | 5.1% (330,146) |
Number of households with income $40k - 50k:| Seven Trees: | 2.9% (2,604) |
| State: | 5.2% (335,310) |
Number of households with income $50k - 60k:| Seven Trees: | 3.6% (3,258) |
| State: | 5.1% (326,299) |
Number of households with income $60k - 75k:| Seven Trees: | 4.7% (4,186) |
| California: | 7.6% (487,640) |
Number of households with income $75k - 100k:| Seven Trees: | 8.5% (7,605) |
| State: | 11.5% (736,578) |
Number of households with income $100k - 125k:| Seven Trees: | 8.6% (7,720) |
| State: | 10.1% (648,782) |
Number of households with income $125k - 150k:| Seven Trees: | 7.1% (6,395) |
| State: | 7.8% (499,671) |
Number of households with income $150k - 200k:| Seven Trees: | 11.8% (10,598) |
| State: | 11.4% (729,603) |
Number of households with income > $200k:| Seven Trees: | 39.7% (35,554) |
| State: | 21.2% (1,364,246) |
Aggregate household income in Seven Trees in 2022: $286,169,001
Median family income in Seven Trees in 2022:| Seven Trees: | $101,090 |
| State: | $125,379 |
Number of families with income < $10k:| Seven Trees: | 2.5% (1) |
| State: | 2.2% (87,079) |
Number of families with income $10k - 20k:| Seven Trees: | 16.8% (8) |
| California: | 2.5% (97,716) |
Number of families with income $20k - 30k:| Seven Trees: | 11.7% (6) |
| State: | 3.5% (137,295) |
Number of families with income $30k - 40k:| Seven Trees: | 2.5% (1) |
| California: | 3.9% (152,947) |
Number of families with income $40k - 50k:| Seven Trees: | 10.6% (5) |
| California: | 4.3% (169,197) |
Number of families with income $50k - 60k:| Seven Trees: | 4.7% (2) |
| State: | 4.5% (176,192) |
Number of families with income $60k - 75k:| Seven Trees: | 5.1% (2) |
| State: | 7.0% (274,752) |
Number of families with income $75k - 100k:| Seven Trees: | 11.6% (6) |
| State: | 11.3% (445,632) |
Number of families with income $100k - 125k:| Seven Trees: | 18.4% (9) |
| State: | 10.7% (423,630) |
Number of families with income $125k - 150k:| Seven Trees: | 4.6% (2) |
| State: | 9.1% (357,408) |
Number of families with income $150k - 200k:| Seven Trees: | 11.6% (6) |
| California: | 13.5% (532,693) |
Median non-family income in Seven Trees in 2022:| Seven Trees: | $35,928 |
| State: | $62,819 |
Change in median non-family income between 2000 and 2022:| Seven Trees, California: | +70.1% |
| State: | +84.4% |
Median per capita income in Seven Trees in 2022:| Seven Trees: | $52,827 |
| State: | $61,706 |
Change in median per capita income between 2000 and 2022:| Seven Trees, California: | +146.6% |
| State: | +122.7% |
Income statistics for Black or African American residents
Median household income in Seven Trees, CA in 2022:| Seven Trees: | $130,797 |
| State: | $63,268 |
Change in median household income between 2000 and 2022:| Seven Trees, California: | +27.9% |
| State: | +81.0% |
Number of households with income < $10k:| Seven Trees: | 6.4% (1,689) |
| California: | 9.0% (73,219) |
Number of households with income $10k - 20k:| Seven Trees: | 4.4% (1,147) |
| State: | 10.6% (86,666) |
Number of households with income $20k - 30k:| Seven Trees: | 9.6% (2,514) |
| State: | 7.1% (57,719) |
Number of households with income $30k - 40k:| Seven Trees: | 6.2% (1,639) |
| State: | 7.2% (58,714) |
Number of households with income $40k - 50k:| Seven Trees: | 4.4% (1,158) |
| State: | 7.1% (58,075) |
Number of households with income $50k - 60k:| Seven Trees: | 10.2% (2,666) |
| State: | 6.8% (55,229) |
Number of households with income $60k - 75k:| Seven Trees: | 8.7% (2,276) |
| State: | 8.8% (71,895) |
Number of households with income $75k - 100k:| Seven Trees: | 9.6% (2,531) |
| State: | 11.9% (96,893) |
Number of households with income $100k - 125k:| Seven Trees: | 5.3% (1,397) |
| State: | 8.7% (70,729) |
Number of households with income $125k - 150k:| Seven Trees: | 9.0% (2,361) |
| State: | 6.3% (51,211) |
Number of households with income $150k - 200k:| Seven Trees: | 8.6% (2,258) |
| California: | 7.2% (58,687) |
Number of households with income > $200k:| Seven Trees: | 17.6% (4,617) |
| State: | 9.3% (75,487) |
Aggregate household income in Seven Trees in 2022: $545,742
Median non-family income in Seven Trees in 2022:| Seven Trees: | $136,701 |
| State: | $41,942 |
Change in median non-family income between 2000 and 2022:| Seven Trees, California: | +33.7% |
| State: | +72.0% |
Median per capita income in Seven Trees in 2022:| Seven Trees: | $13,507 |
| State: | $36,708 |
Change in median per capita income between 2000 and 2022:| Seven Trees, California: | +87.6% |
| California: | +110.4% |
Income statistics for Asian residents
Median household income in Seven Trees, CA in 2022:| Seven Trees: | $118,883 |
| State: | $119,861 |
Change in median household income between 2000 and 2022:| Seven Trees, California: | +132.0% |
| California: | +116.5% |
Number of households with income < $10k:| Seven Trees: | 3.5% (5,590) |
| State: | 5.1% (106,273) |
Number of households with income $10k - 20k:| Seven Trees: | 3.2% (5,175) |
| California: | 4.9% (101,815) |
Number of households with income $20k - 30k:| Seven Trees: | 3.0% (4,780) |
| State: | 4.6% (94,414) |
Number of households with income $30k - 40k:| Seven Trees: | 1.9% (3,030) |
| State: | 4.1% (84,491) |
Number of households with income $40k - 50k:| Seven Trees: | 2.0% (3,304) |
| State: | 4.0% (81,758) |
Number of households with income $50k - 60k:| Seven Trees: | 2.4% (3,875) |
| State: | 3.9% (80,971) |
Number of households with income $60k - 75k:| Seven Trees: | 3.8% (6,144) |
| State: | 6.0% (124,194) |
Number of households with income $75k - 100k:| Seven Trees: | 6.0% (9,746) |
| State: | 9.7% (200,337) |
Number of households with income $100k - 125k:| Seven Trees: | 6.3% (10,229) |
| California: | 9.4% (193,488) |
Number of households with income $125k - 150k:| Seven Trees: | 7.0% (11,322) |
| State: | 7.7% (158,253) |
Number of households with income $150k - 200k:| Seven Trees: | 12.4% (20,086) |
| California: | 12.2% (252,139) |
Number of households with income > $200k:| Seven Trees: | 48.6% (78,684) |
| California: | 28.4% (586,641) |
Aggregate household income in Seven Trees in 2022: $34,263,843
Median family income in Seven Trees in 2022:| Seven Trees: | $87,762 |
| State: | $136,040 |
Number of families with income $10k - 20k:| Seven Trees: | 22.4% (4) |
| California: | 3.1% (46,821) |
Number of families with income $20k - 30k:| Seven Trees: | 26.5% (4) |
| State: | 4.1% (61,519) |
Number of families with income $30k - 40k:| Seven Trees: | 11.3% (2) |
| State: | 3.7% (55,234) |
Number of families with income $60k - 75k:| Seven Trees: | 6.8% (1) |
| State: | 5.9% (88,675) |
Number of families with income $75k - 100k:| Seven Trees: | 17.1% (3) |
| California: | 9.5% (143,103) |
Number of families with income $100k - 125k:| Seven Trees: | 15.9% (3) |
| California: | 9.4% (142,085) |
Median per capita income in Seven Trees in 2022:| Seven Trees: | $31,950 |
| State: | $58,824 |
Income statistics for Hispanic or Latino residents
Median household income in Seven Trees, CA in 2022:| Seven Trees: | $56,093 |
| California: | $75,698 |
Change in median household income between 2000 and 2022:| Seven Trees, California: | +64.7% |
| State: | +107.2% |
Number of households with income < $10k:| Seven Trees: | 3.7% (2,821) |
| State: | 4.3% (183,294) |
Number of households with income $10k - 20k:| Seven Trees: | 4.7% (3,554) |
| State: | 6.0% (253,903) |
Number of households with income $20k - 30k:| Seven Trees: | 6.0% (4,618) |
| State: | 6.8% (286,386) |
Number of households with income $30k - 40k:| Seven Trees: | 4.8% (3,679) |
| State: | 7.4% (313,728) |
Number of households with income $40k - 50k:| Seven Trees: | 6.7% (5,104) |
| California: | 7.4% (313,199) |
Number of households with income $50k - 60k:| Seven Trees: | 5.4% (4,161) |
| California: | 7.2% (305,366) |
Number of households with income $60k - 75k:| Seven Trees: | 8.4% (6,427) |
| California: | 10.3% (434,937) |
Number of households with income $75k - 100k:| Seven Trees: | 13.9% (10,629) |
| California: | 14.4% (607,302) |
Number of households with income $100k - 125k:| Seven Trees: | 10.6% (8,065) |
| California: | 10.6% (447,424) |
Number of households with income $125k - 150k:| Seven Trees: | 8.3% (6,310) |
| State: | 7.5% (316,022) |
Number of households with income $150k - 200k:| Seven Trees: | 12.4% (9,463) |
| California: | 9.2% (386,269) |
Number of households with income > $200k:| Seven Trees: | 15.2% (11,593) |
| State: | 8.8% (372,651) |
Aggregate household income in Seven Trees in 2022: $65,472,372
Median family income in Seven Trees in 2022:| Seven Trees: | $57,521 |
| California: | $77,589 |
Number of families with income < $10k:| Seven Trees: | 12.8% (4) |
| State: | 3.9% (129,468) |
Number of families with income $20k - 30k:| Seven Trees: | 10.1% (3) |
| State: | 6.6% (216,764) |
Number of families with income $60k - 75k:| Seven Trees: | 13.8% (4) |
| California: | 10.5% (345,838) |
Number of families with income $75k - 100k:| Seven Trees: | 22.9% (7) |
| State: | 14.9% (491,589) |
Number of families with income $100k - 125k:| Seven Trees: | 23.2% (7) |
| California: | 10.7% (355,400) |
Number of families with income $125k - 150k:| Seven Trees: | 5.4% (2) |
| State: | 7.8% (259,317) |
Number of families with income $150k - 200k:| Seven Trees: | 11.8% (4) |
| California: | 9.3% (306,566) |
Median non-family income in Seven Trees in 2022:| Seven Trees: | $134,826 |
| State: | $49,746 |
Change in median non-family income between 2000 and 2022:| Seven Trees, California: | +79.6% |
| California: | +100.7% |
Median per capita income in Seven Trees in 2022:| Seven Trees: | $21,964 |
| State: | $27,240 |
Change in median per capita income between 2000 and 2022:| Seven Trees, California: | +120.2% |
| State: | +133.3% |
Income statistics for Multirace residents
Median household income in Seven Trees, CA in 2022:| Seven Trees: | $70,194 |
| State: | $83,153 |
Change in median household income between 2000 and 2022:| Seven Trees, California: | +87.9% |
| State: | +106.0% |
Number of households with income < $10k:| Seven Trees: | 3.9% (1,670) |
| State: | 4.2% (85,299) |
Number of households with income $10k - 20k:| Seven Trees: | 4.0% (1,710) |
| State: | 6.1% (122,966) |
Number of households with income $20k - 30k:| Seven Trees: | 4.2% (1,807) |
| State: | 6.4% (129,328) |
Number of households with income $30k - 40k:| Seven Trees: | 2.8% (1,196) |
| California: | 6.4% (130,070) |
Number of households with income $40k - 50k:| Seven Trees: | 5.8% (2,506) |
| State: | 6.5% (131,254) |
Number of households with income $50k - 60k:| Seven Trees: | 4.6% (1,983) |
| California: | 6.5% (132,382) |
Number of households with income $60k - 75k:| Seven Trees: | 6.3% (2,722) |
| State: | 9.4% (191,472) |
Number of households with income $75k - 100k:| Seven Trees: | 11.2% (4,804) |
| State: | 13.3% (269,691) |
Number of households with income $100k - 125k:| Seven Trees: | 13.0% (5,580) |
| California: | 10.2% (207,286) |
Number of households with income $125k - 150k:| Seven Trees: | 7.9% (3,377) |
| State: | 7.8% (158,259) |
Number of households with income $150k - 200k:| Seven Trees: | 14.7% (6,320) |
| State: | 10.3% (209,227) |
Number of households with income > $200k:| Seven Trees: | 21.7% (9,308) |
| State: | 13.0% (263,210) |
Aggregate household income in Seven Trees in 2022: $27,437,376
Median family income in Seven Trees in 2022:| Seven Trees: | $85,645 |
| California: | $87,642 |
Number of families with income $30k - 40k:| Seven Trees: | 3.8% (3) |
| State: | 6.2% (91,415) |
Number of families with income $50k - 60k:| Seven Trees: | 21.3% (15) |
| California: | 6.7% (98,298) |
Number of families with income $75k - 100k:| Seven Trees: | 14.6% (11) |
| State: | 13.8% (203,439) |
Number of families with income > $200k:| Seven Trees: | 60.3% (44) |
| State: | 14.0% (207,317) |
Median non-family income in Seven Trees in 2022:| Seven Trees: | $88,549 |
| State: | $56,558 |
Change in median non-family income between 2000 and 2022:| Seven Trees, California: | +144.3% |
| California: | +100.2% |
Median per capita income in Seven Trees in 2022:| Seven Trees: | $105,314 |
| State: | $32,124 |
Change in median per capita income between 2000 and 2022:| Seven Trees, California: | +132.4% |
| State: | +120.4% |
Income statistics for other residents
Number of households with income < $10k:| Seven Trees: | 3.6% (5) |
| State: | 4.6% (93,035) |
Number of households with income $10k - 20k:| Seven Trees: | 5.1% (7) |
| California: | 6.3% (126,222) |
Number of households with income $20k - 30k:| Seven Trees: | 6.6% (9) |
| California: | 7.1% (142,656) |
Number of households with income $30k - 40k:| Seven Trees: | 5.8% (8) |
| State: | 8.2% (165,018) |
Number of households with income $40k - 50k:| Seven Trees: | 6.6% (9) |
| California: | 8.0% (161,732) |
Number of households with income $50k - 60k:| Seven Trees: | 5.8% (8) |
| California: | 7.6% (152,152) |
Number of households with income $60k - 75k:| Seven Trees: | 10.2% (14) |
| State: | 10.4% (209,951) |
Number of households with income $75k - 100k:| Seven Trees: | 15.3% (21) |
| State: | 14.7% (296,102) |
Number of households with income $100k - 125k:| Seven Trees: | 10.9% (15) |
| State: | 10.7% (214,281) |
Number of households with income $125k - 150k:| Seven Trees: | 7.3% (10) |
| State: | 7.1% (143,092) |
Number of households with income $150k - 200k:| Seven Trees: | 11.7% (16) |
| California: | 8.6% (172,215) |
Number of households with income > $200k:| Seven Trees: | 10.9% (15) |
| California: | 6.7% (134,102) |
Aggregate household income in Seven Trees in 2022: $14,874,446
Median family income in Seven Trees in 2022:| Seven Trees: | $53,714 |
| State: | $72,756 |
Number of families with income < $10k:| Seven Trees: | 39.0% (36) |
| State: | 4.3% (69,090) |
Number of families with income $10k - 20k:| Seven Trees: | 5.2% (5) |
| State: | 5.1% (82,116) |
Number of families with income $30k - 40k:| Seven Trees: | 6.2% (6) |
| State: | 8.4% (135,938) |
Number of families with income $40k - 50k:| Seven Trees: | 4.2% (4) |
| State: | 8.4% (135,353) |
Number of families with income $50k - 60k:| Seven Trees: | 9.7% (9) |
| State: | 7.7% (124,826) |
Number of families with income $60k - 75k:| Seven Trees: | 2.9% (3) |
| State: | 10.7% (173,628) |
Number of families with income $75k - 100k:| Seven Trees: | 18.7% (17) |
| State: | 15.2% (245,724) |
Number of families with income $100k - 125k:| Seven Trees: | 14.1% (13) |
| State: | 10.9% (176,716) |
Median non-family income in Seven Trees in 2022:| Seven Trees: | $52,795 |
| State: | $43,881 |
Change in median non-family income between 2000 and 2022:| Seven Trees, California: | +56.4% |
| State: | +84.6% |
Median per capita income in Seven Trees in 2022:| Seven Trees: | $17,078 |
| California: | $25,164 |
Change in median per capita income between 2000 and 2022:| Seven Trees, California: | +107.0% |
| State: | +137.9% |