Sheffield, Massachusetts (MA) income map, earnings map, and wages data
The median household income in Sheffield, MA in 2022 was $85,640, which was 10.3% less than the median annual income of $94,488 across the entire state of Massachusetts. Compared to the median income of $45,082 in 2000 this represents an increase of 47.4%. The per capita income in 2022 was $57,178, which means an increase of 55.4% compared to 2000 when it was $25,492.
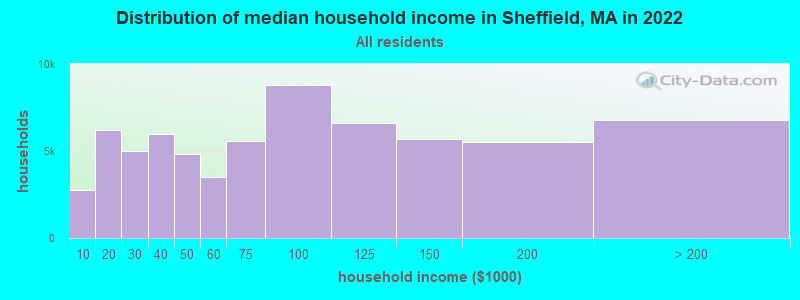
Income statistics for all residents
Median household income in Sheffield, MA in 2022:| Sheffield: | $85,640 |
| State: | $94,488 |
Change in median household income between 2000 and 2022:| Sheffield, Massachusetts: | +90.0% |
| State: | +87.1% |
Number of households with income < $10k:| Sheffield: | 4.1% (2,779) |
| Massachusetts: | 5.2% (146,170) |
Number of households with income $10k - 20k:| Sheffield: | 9.2% (6,190) |
| Massachusetts: | 6.4% (180,001) |
Number of households with income $20k - 30k:| Sheffield: | 7.5% (5,027) |
| State: | 5.6% (156,667) |
Number of households with income $30k - 40k:| Sheffield: | 8.9% (5,992) |
| Massachusetts: | 5.6% (157,168) |
Number of households with income $40k - 50k:| Sheffield: | 7.1% (4,807) |
| State: | 5.4% (151,455) |
Number of households with income $50k - 60k:| Sheffield: | 5.2% (3,527) |
| State: | 5.1% (142,726) |
Number of households with income $60k - 75k:| Sheffield: | 8.3% (5,602) |
| State: | 7.6% (212,203) |
Number of households with income $75k - 100k:| Sheffield: | 13.1% (8,801) |
| Massachusetts: | 11.3% (317,064) |
Number of households with income $100k - 125k:| Sheffield: | 9.8% (6,624) |
| State: | 9.7% (270,603) |
Number of households with income $125k - 150k:| Sheffield: | 8.5% (5,706) |
| State: | 8.0% (223,140) |
Number of households with income $150k - 200k:| Sheffield: | 8.2% (5,534) |
| State: | 11.0% (308,695) |
Number of households with income > $200k:| Sheffield: | 10.1% (6,803) |
| Massachusetts: | 19.0% (531,884) |
Aggregate household income in Sheffield in 2022: $245,683,458
Median family income in Sheffield in 2022:| Sheffield: | $97,454 |
| State: | $120,263 |
Median non-family income in Sheffield in 2022:| Sheffield: | $46,525 |
| State: | $55,979 |
Change in median non-family income between 2000 and 2022:| Sheffield, Massachusetts: | +95.6% |
| Massachusetts: | +88.0% |
Median per capita income in Sheffield in 2022:| Sheffield: | $57,178 |
| State: | $54,025 |
Change in median per capita income between 2000 and 2022:| Sheffield, Massachusetts: | +124.3% |
| State: | +108.2% |
Income statistics for White residents
Median household income in Sheffield, MA in 2022:| Sheffield: | $87,441 |
| State: | $101,391 |
Change in median household income between 2000 and 2022:| Sheffield, Massachusetts: | +92.7% |
| State: | +93.3% |
Number of households with income < $10k:| Sheffield: | 4.3% (2,644) |
| State: | 4.4% (91,120) |
Number of households with income $10k - 20k:| Sheffield: | 8.5% (5,149) |
| State: | 5.9% (122,055) |
Number of households with income $20k - 30k:| Sheffield: | 8.1% (4,920) |
| State: | 5.1% (105,311) |
Number of households with income $30k - 40k:| Sheffield: | 8.2% (4,974) |
| State: | 5.3% (110,239) |
Number of households with income $40k - 50k:| Sheffield: | 7.0% (4,279) |
| Massachusetts: | 5.0% (104,636) |
Number of households with income $50k - 60k:| Sheffield: | 4.5% (2,721) |
| State: | 4.8% (99,486) |
Number of households with income $60k - 75k:| Sheffield: | 8.9% (5,405) |
| State: | 7.5% (155,124) |
Number of households with income $75k - 100k:| Sheffield: | 13.0% (7,897) |
| Massachusetts: | 11.4% (236,252) |
Number of households with income $100k - 125k:| Sheffield: | 9.6% (5,841) |
| State: | 9.9% (204,731) |
Number of households with income $125k - 150k:| Sheffield: | 8.6% (5,221) |
| State: | 8.5% (175,324) |
Number of households with income $150k - 200k:| Sheffield: | 8.8% (5,374) |
| State: | 11.7% (242,980) |
Number of households with income > $200k:| Sheffield: | 10.6% (6,483) |
| State: | 20.5% (425,966) |
Aggregate household income in Sheffield in 2022: $221,996,687
Median family income in Sheffield in 2022:| Sheffield: | $99,927 |
| State: | $133,153 |
Number of families with income < $10k:| Sheffield: | 2.0% (17) |
| State: | 2.0% (25,038) |
Number of families with income $10k - 20k:| Sheffield: | 3.6% (31) |
| Massachusetts: | 2.1% (26,403) |
Number of families with income $20k - 30k:| Sheffield: | 2.3% (20) |
| Massachusetts: | 2.6% (32,525) |
Number of families with income $30k - 40k:| Sheffield: | 6.4% (56) |
| State: | 3.9% (48,079) |
Number of families with income $40k - 50k:| Sheffield: | 5.4% (47) |
| State: | 3.8% (46,908) |
Number of families with income $50k - 60k:| Sheffield: | 3.6% (31) |
| Massachusetts: | 3.8% (46,476) |
Number of families with income $60k - 75k:| Sheffield: | 12.5% (109) |
| Massachusetts: | 6.4% (79,040) |
Number of families with income $75k - 100k:| Sheffield: | 7.8% (68) |
| State: | 11.1% (137,395) |
Number of families with income $100k - 125k:| Sheffield: | 10.8% (95) |
| State: | 11.1% (136,771) |
Number of families with income $125k - 150k:| Sheffield: | 16.9% (148) |
| State: | 10.0% (123,709) |
Number of families with income $150k - 200k:| Sheffield: | 16.6% (145) |
| State: | 14.7% (181,602) |
Number of families with income > $200k:| Sheffield: | 12.3% (107) |
| State: | 28.5% (351,887) |
Median non-family income in Sheffield in 2022:| Sheffield: | $46,463 |
| State: | $59,323 |
Change in median non-family income between 2000 and 2022:| Sheffield, Massachusetts: | +95.3% |
| State: | +94.3% |
Median per capita income in Sheffield in 2022:| Sheffield: | $58,906 |
| State: | $60,804 |
Change in median per capita income between 2000 and 2022:| Sheffield, Massachusetts: | +128.4% |
| Massachusetts: | +118.7% |
Income statistics for Black or African American residents
Median household income in Sheffield, MA in 2022:| Sheffield: | $251,249 |
| State: | $63,189 |
Change in median household income between 2000 and 2022:| Sheffield, Massachusetts: | +43.3% |
| State: | +87.4% |
Number of households with income < $10k:| Sheffield: | 9.1% (82,118) |
| State: | 9.1% (15,797) |
Number of households with income $10k - 20k:| Sheffield: | 9.4% (84,561) |
| Massachusetts: | 9.4% (16,267) |
Number of households with income $20k - 30k:| Sheffield: | 7.8% (70,281) |
| State: | 7.8% (13,520) |
Number of households with income $30k - 40k:| Sheffield: | 8.3% (74,918) |
| State: | 8.3% (14,412) |
Number of households with income $40k - 50k:| Sheffield: | 7.9% (71,685) |
| Massachusetts: | 7.9% (13,790) |
Number of households with income $50k - 60k:| Sheffield: | 5.8% (52,196) |
| Massachusetts: | 5.8% (10,041) |
Number of households with income $60k - 75k:| Sheffield: | 8.5% (77,049) |
| State: | 8.5% (14,822) |
Number of households with income $75k - 100k:| Sheffield: | 11.0% (99,402) |
| Massachusetts: | 11.0% (19,122) |
Number of households with income $100k - 125k:| Sheffield: | 8.4% (75,765) |
| State: | 8.4% (14,575) |
Number of households with income $125k - 150k:| Sheffield: | 6.0% (54,213) |
| Massachusetts: | 6.0% (10,429) |
Number of households with income $150k - 200k:| Sheffield: | 7.2% (65,181) |
| Massachusetts: | 7.2% (12,539) |
Number of households with income > $200k:| Sheffield: | 10.5% (94,531) |
| State: | 10.5% (18,185) |
Aggregate household income in Sheffield in 2022: $3,892,839
Median family income in Sheffield in 2022:| Sheffield: | $338,500 |
| Massachusetts: | $79,815 |
Number of families with income $30k - 40k:| Sheffield: | 6.7% (4) |
| State: | 6.4% (7,002) |
Number of families with income $150k - 200k:| Sheffield: | 93.3% (52) |
| Massachusetts: | 9.3% (10,230) |
Median per capita income in Sheffield in 2022:| Sheffield: | $124,443 |
| State: | $33,524 |
Income statistics for Hispanic or Latino residents
Median household income in Sheffield, MA in 2022:| Sheffield: | $86,022 |
| Massachusetts: | $61,523 |
Change in median household income between 2000 and 2022:| Sheffield, Massachusetts: | +69.4% |
| State: | +125.4% |
Number of households with income < $10k:| Sheffield: | 8.8% (47,074) |
| Massachusetts: | 8.8% (25,307) |
Number of households with income $10k - 20k:| Sheffield: | 10.0% (53,297) |
| State: | 10.0% (28,653) |
Number of households with income $20k - 30k:| Sheffield: | 8.8% (46,854) |
| State: | 8.8% (25,189) |
Number of households with income $30k - 40k:| Sheffield: | 7.2% (38,731) |
| State: | 7.2% (20,822) |
Number of households with income $40k - 50k:| Sheffield: | 7.2% (38,722) |
| State: | 7.2% (20,817) |
Number of households with income $50k - 60k:| Sheffield: | 6.5% (34,873) |
| State: | 6.5% (18,748) |
Number of households with income $60k - 75k:| Sheffield: | 8.8% (47,228) |
| Massachusetts: | 8.8% (25,390) |
Number of households with income $75k - 100k:| Sheffield: | 12.0% (64,151) |
| State: | 12.0% (34,488) |
Number of households with income $100k - 125k:| Sheffield: | 8.6% (45,757) |
| State: | 8.6% (24,599) |
Number of households with income $125k - 150k:| Sheffield: | 6.2% (33,004) |
| Massachusetts: | 6.2% (17,743) |
Number of households with income $150k - 200k:| Sheffield: | 7.3% (39,094) |
| State: | 7.3% (21,017) |
Number of households with income > $200k:| Sheffield: | 8.6% (45,770) |
| State: | 8.6% (24,606) |
Aggregate household income in Sheffield in 2022: $14,646,875
Median family income in Sheffield in 2022:| Sheffield: | $52,200 |
| State: | $66,072 |
Number of families with income < $10k:| Sheffield: | 7.9% (10) |
| State: | 6.2% (12,456) |
Number of families with income $10k - 20k:| Sheffield: | 6.9% (9) |
| State: | 6.0% (12,071) |
Number of families with income $20k - 30k:| Sheffield: | 11.2% (14) |
| State: | 10.1% (20,376) |
Number of families with income $30k - 40k:| Sheffield: | 12.4% (15) |
| Massachusetts: | 8.2% (16,470) |
Number of families with income $40k - 50k:| Sheffield: | 12.7% (16) |
| State: | 7.4% (14,829) |
Number of families with income $50k - 60k:| Sheffield: | 7.8% (10) |
| State: | 7.3% (14,643) |
Number of families with income $60k - 75k:| Sheffield: | 13.9% (17) |
| State: | 10.6% (21,252) |
Number of families with income $75k - 100k:| Sheffield: | 6.2% (8) |
| Massachusetts: | 12.0% (24,088) |
Number of families with income $100k - 125k:| Sheffield: | 5.4% (7) |
| State: | 8.9% (17,954) |
Number of families with income $125k - 150k:| Sheffield: | 5.7% (7) |
| State: | 6.9% (13,837) |
Number of families with income $150k - 200k:| Sheffield: | 5.2% (7) |
| Massachusetts: | 7.3% (14,683) |
Number of families with income > $200k:| Sheffield: | 4.7% (6) |
| State: | 9.3% (18,741) |
Median non-family income in Sheffield in 2022:| Sheffield: | $48,163 |
| State: | $37,563 |
Change in median non-family income between 2000 and 2022:| Sheffield, Massachusetts: | +95.6% |
| Massachusetts: | +115.0% |
Median per capita income in Sheffield in 2022:| Sheffield: | $59,558 |
| State: | $28,993 |
Change in median per capita income between 2000 and 2022:| Sheffield, Massachusetts: | +67.1% |
| Massachusetts: | +142.4% |
Income statistics for Multirace residents
Median household income in Sheffield, MA in 2022:| Sheffield: | $91,988 |
| State: | $71,552 |
Number of households with income < $10k:| Sheffield: | 6.6% (5,254) |
| Massachusetts: | 6.6% (15,127) |
Number of households with income $10k - 20k:| Sheffield: | 9.3% (7,384) |
| Massachusetts: | 9.2% (21,158) |
Number of households with income $20k - 30k:| Sheffield: | 7.8% (6,224) |
| State: | 7.8% (18,016) |
Number of households with income $30k - 40k:| Sheffield: | 8.0% (6,350) |
| State: | 7.9% (18,260) |
Number of households with income $40k - 50k:| Sheffield: | 5.7% (4,505) |
| State: | 5.6% (13,027) |
Number of households with income $50k - 60k:| Sheffield: | 5.6% (4,461) |
| Massachusetts: | 5.6% (12,909) |
Number of households with income $60k - 75k:| Sheffield: | 9.0% (7,174) |
| State: | 9.0% (20,800) |
Number of households with income $75k - 100k:| Sheffield: | 12.1% (9,680) |
| State: | 12.1% (27,875) |
Number of households with income $100k - 125k:| Sheffield: | 8.1% (6,467) |
| Massachusetts: | 8.1% (18,754) |
Number of households with income $125k - 150k:| Sheffield: | 6.8% (5,389) |
| State: | 6.8% (15,621) |
Number of households with income $150k - 200k:| Sheffield: | 9.2% (7,369) |
| State: | 9.4% (21,618) |
Number of households with income > $200k:| Sheffield: | 11.8% (9,438) |
| Massachusetts: | 12.0% (27,592) |
Aggregate household income in Sheffield in 2022: $10,603,280
Median family income in Sheffield in 2022:| Sheffield: | $47,255 |
| Massachusetts: | $78,380 |
Number of families with income $10k - 20k:| Sheffield: | 48.7% (14) |
| State: | 4.9% (7,678) |
Number of families with income $20k - 30k:| Sheffield: | 51.3% (14) |
| State: | 8.5% (13,245) |
Median non-family income in Sheffield in 2022:| Sheffield: | $100,185 |
| Massachusetts: | $42,253 |
Median per capita income in Sheffield in 2022:| Sheffield: | $49,243 |
| Massachusetts: | $34,029 |
Income statistics for other residents
Number of households with income < $10k:| Sheffield: | 8.3% (2) |
| Massachusetts: | 8.4% (11,559) |
Number of households with income $10k - 20k:| Sheffield: | 8.3% (2) |
| Massachusetts: | 8.4% (11,499) |
Number of households with income $20k - 30k:| Sheffield: | 8.3% (2) |
| Massachusetts: | 9.5% (13,070) |
Number of households with income $30k - 40k:| Sheffield: | 8.3% (2) |
| State: | 6.0% (8,291) |
Number of households with income $40k - 50k:| Sheffield: | 8.3% (2) |
| State: | 9.2% (12,611) |
Number of households with income $50k - 60k:| Sheffield: | 8.3% (2) |
| State: | 7.9% (10,879) |
Number of households with income $60k - 75k:| Sheffield: | 8.3% (2) |
| Massachusetts: | 7.5% (10,239) |
Number of households with income $75k - 100k:| Sheffield: | 12.5% (3) |
| State: | 13.1% (18,032) |
Number of households with income $100k - 125k:| Sheffield: | 8.3% (2) |
| State: | 9.6% (13,141) |
Number of households with income $125k - 150k:| Sheffield: | 4.2% (1) |
| Massachusetts: | 5.0% (6,808) |
Number of households with income $150k - 200k:| Sheffield: | 8.3% (2) |
| Massachusetts: | 6.4% (8,843) |
Number of households with income > $200k:| Sheffield: | 8.3% (2) |
| State: | 9.0% (12,396) |
Aggregate household income in Sheffield in 2022: $4,661,441
Median family income in Sheffield in 2022:| Sheffield: | $112,803 |
| Massachusetts: | $66,840 |
Number of families with income $50k - 60k:| Sheffield: | 100.0% (20) |
| Massachusetts: | 8.7% (8,850) |
Median per capita income in Sheffield in 2022:| Sheffield: | $23,412 |
| State: | $30,797 |
Change in median per capita income between 2000 and 2022:| Sheffield, Massachusetts: | +38.7% |
| State: | +188.5% |