Shelbyville, Texas (TX) income map, earnings map, and wages data
The median household income in Shelbyville, TX in 2022 was $55,093, which was 31.2% less than the median annual income of $72,284 across the entire state of Texas. Compared to the median income of $29,884 in 2000 this represents an increase of 45.8%. The per capita income in 2022 was $31,774, which means an increase of 48.5% compared to 2000 when it was $16,361.
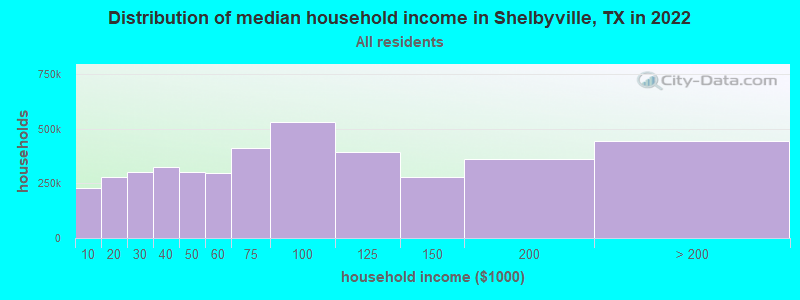
Income statistics for all residents
Median household income in Shelbyville, TX in 2022:| Shelbyville: | $55,094 |
| Texas: | $72,284 |
Change in median household income between 2000 and 2022:| Shelbyville, Texas: | +84.4% |
| State: | +81.0% |
Number of households with income < $10k:| Shelbyville: | 5.5% (228,536) |
| State: | 5.5% (611,011) |
Number of households with income $10k - 20k:| Shelbyville: | 6.7% (278,106) |
| State: | 6.7% (743,157) |
Number of households with income $20k - 30k:| Shelbyville: | 7.2% (300,652) |
| State: | 7.2% (803,381) |
Number of households with income $30k - 40k:| Shelbyville: | 7.8% (324,079) |
| State: | 7.8% (866,080) |
Number of households with income $40k - 50k:| Shelbyville: | 7.3% (303,271) |
| Texas: | 7.3% (810,440) |
Number of households with income $50k - 60k:| Shelbyville: | 7.2% (299,244) |
| State: | 7.2% (799,783) |
Number of households with income $60k - 75k:| Shelbyville: | 9.9% (409,865) |
| State: | 9.9% (1,095,384) |
Number of households with income $75k - 100k:| Shelbyville: | 12.8% (531,120) |
| Texas: | 12.8% (1,419,057) |
Number of households with income $100k - 125k:| Shelbyville: | 9.5% (394,744) |
| State: | 9.5% (1,054,577) |
Number of households with income $125k - 150k:| Shelbyville: | 6.7% (277,631) |
| Texas: | 6.7% (741,518) |
Number of households with income $150k - 200k:| Shelbyville: | 8.7% (359,896) |
| Texas: | 8.7% (961,776) |
Number of households with income > $200k:| Shelbyville: | 10.7% (441,951) |
| Texas: | 10.7% (1,181,544) |
Aggregate household income in Shelbyville in 2022: $14,059,381,919
Median family income in Shelbyville in 2022:| Shelbyville: | $66,105 |
| State: | $86,267 |
Median non-family income in Shelbyville in 2022:| Shelbyville: | $26,577 |
| Texas: | $45,999 |
Change in median non-family income between 2000 and 2022:| Shelbyville, Texas: | +85.2% |
| Texas: | +79.5% |
Median per capita income in Shelbyville in 2022:| Shelbyville: | $31,775 |
| State: | $38,123 |
Change in median per capita income between 2000 and 2022:| Shelbyville, Texas: | +94.2% |
| State: | +94.3% |
Income statistics for White residents
Median household income in Shelbyville, TX in 2022:| Shelbyville: | $59,831 |
| State: | $82,032 |
Change in median household income between 2000 and 2022:| Shelbyville, Texas: | +90.4% |
| State: | +91.0% |
Number of households with income < $10k:| Shelbyville: | 4.7% (99,848) |
| State: | 4.7% (273,716) |
Number of households with income $10k - 20k:| Shelbyville: | 5.5% (117,934) |
| State: | 5.5% (322,702) |
Number of households with income $20k - 30k:| Shelbyville: | 6.2% (133,079) |
| Texas: | 6.2% (363,947) |
Number of households with income $30k - 40k:| Shelbyville: | 6.8% (145,871) |
| State: | 6.8% (399,275) |
Number of households with income $40k - 50k:| Shelbyville: | 6.5% (140,028) |
| Texas: | 6.5% (383,417) |
Number of households with income $50k - 60k:| Shelbyville: | 6.6% (141,870) |
| Texas: | 6.6% (388,535) |
Number of households with income $60k - 75k:| Shelbyville: | 9.6% (206,506) |
| State: | 9.7% (566,295) |
Number of households with income $75k - 100k:| Shelbyville: | 13.0% (277,509) |
| Texas: | 13.0% (760,276) |
Number of households with income $100k - 125k:| Shelbyville: | 10.2% (218,133) |
| Texas: | 10.2% (597,596) |
Number of households with income $125k - 150k:| Shelbyville: | 7.4% (159,406) |
| State: | 7.4% (436,830) |
Number of households with income $150k - 200k:| Shelbyville: | 9.9% (212,601) |
| State: | 9.9% (583,067) |
Number of households with income > $200k:| Shelbyville: | 13.5% (288,265) |
| State: | 13.5% (792,647) |
Aggregate household income in Shelbyville in 2022: $6,840,078,165
Median family income in Shelbyville in 2022:| Shelbyville: | $72,960 |
| Texas: | $101,788 |
Number of families with income < $10k:| Shelbyville: | 5.9% (33) |
| State: | 2.8% (108,142) |
Number of families with income $10k - 20k:| Shelbyville: | 3.2% (18) |
| Texas: | 2.9% (113,421) |
Number of families with income $20k - 30k:| Shelbyville: | 8.4% (48) |
| State: | 4.1% (157,688) |
Number of families with income $30k - 40k:| Shelbyville: | 10.5% (60) |
| Texas: | 5.2% (198,847) |
Number of families with income $40k - 50k:| Shelbyville: | 7.6% (44) |
| Texas: | 5.6% (216,490) |
Number of families with income $50k - 60k:| Shelbyville: | 7.2% (41) |
| Texas: | 5.7% (220,689) |
Number of families with income $60k - 75k:| Shelbyville: | 9.8% (56) |
| State: | 9.0% (346,106) |
Number of families with income $75k - 100k:| Shelbyville: | 11.3% (65) |
| State: | 13.7% (527,363) |
Number of families with income $100k - 125k:| Shelbyville: | 14.4% (83) |
| State: | 11.6% (448,411) |
Number of families with income $125k - 150k:| Shelbyville: | 2.4% (14) |
| State: | 9.2% (355,798) |
Number of families with income $150k - 200k:| Shelbyville: | 4.4% (25) |
| State: | 12.5% (480,185) |
Number of families with income > $200k:| Shelbyville: | 15.0% (86) |
| State: | 17.6% (677,490) |
Median non-family income in Shelbyville in 2022:| Shelbyville: | $28,958 |
| Texas: | $50,587 |
Change in median non-family income between 2000 and 2022:| Shelbyville, Texas: | +85.8% |
| State: | +87.7% |
Median per capita income in Shelbyville in 2022:| Shelbyville: | $39,981 |
| State: | $47,740 |
Change in median per capita income between 2000 and 2022:| Shelbyville, Texas: | +112.1% |
| State: | +114.3% |
Income statistics for Black or African American residents
Median household income in Shelbyville, TX in 2022:| Shelbyville: | $50,874 |
| Texas: | $55,759 |
Change in median household income between 2000 and 2022:| Shelbyville, Texas: | +113.5% |
| State: | +90.3% |
Number of households with income < $10k:| Shelbyville: | 8.9% (51,182) |
| State: | 8.9% (126,378) |
Number of households with income $10k - 20k:| Shelbyville: | 9.9% (57,222) |
| State: | 9.9% (140,369) |
Number of households with income $20k - 30k:| Shelbyville: | 8.5% (49,230) |
| State: | 8.5% (120,639) |
Number of households with income $30k - 40k:| Shelbyville: | 9.7% (55,661) |
| State: | 9.7% (137,517) |
Number of households with income $40k - 50k:| Shelbyville: | 7.9% (45,725) |
| State: | 8.0% (112,973) |
Number of households with income $50k - 60k:| Shelbyville: | 8.2% (47,381) |
| State: | 8.3% (117,156) |
Number of households with income $60k - 75k:| Shelbyville: | 10.4% (59,811) |
| Texas: | 10.4% (147,462) |
Number of households with income $75k - 100k:| Shelbyville: | 11.5% (66,041) |
| Texas: | 11.5% (162,718) |
Number of households with income $100k - 125k:| Shelbyville: | 8.1% (46,890) |
| Texas: | 8.2% (115,829) |
Number of households with income $125k - 150k:| Shelbyville: | 4.9% (28,414) |
| State: | 4.9% (69,556) |
Number of households with income $150k - 200k:| Shelbyville: | 6.4% (36,801) |
| Texas: | 6.4% (90,701) |
Number of households with income > $200k:| Shelbyville: | 5.5% (31,617) |
| Texas: | 5.5% (77,988) |
Aggregate household income in Shelbyville in 2022: $249,038,725
Median family income in Shelbyville in 2022:| Shelbyville: | $69,003 |
| State: | $69,134 |
Number of families with income < $10k:| Shelbyville: | 6.7% (15) |
| State: | 6.8% (55,625) |
Number of families with income $10k - 20k:| Shelbyville: | 7.4% (17) |
| Texas: | 6.8% (55,300) |
Number of families with income $20k - 30k:| Shelbyville: | 13.9% (32) |
| Texas: | 7.1% (57,877) |
Number of families with income $30k - 40k:| Shelbyville: | 17.6% (40) |
| Texas: | 8.5% (68,776) |
Number of families with income $40k - 50k:| Shelbyville: | 5.5% (13) |
| State: | 7.1% (57,907) |
Number of families with income $60k - 75k:| Shelbyville: | 9.4% (21) |
| State: | 10.1% (81,994) |
Number of families with income $75k - 100k:| Shelbyville: | 21.0% (48) |
| State: | 12.7% (103,723) |
Number of families with income $100k - 125k:| Shelbyville: | 18.4% (42) |
| State: | 9.4% (76,609) |
Median non-family income in Shelbyville in 2022:| Shelbyville: | $16,932 |
| State: | $40,133 |
Change in median non-family income between 2000 and 2022:| Shelbyville, Texas: | +133.0% |
| Texas: | +102.2% |
Median per capita income in Shelbyville in 2022:| Shelbyville: | $22,968 |
| Texas: | $30,490 |
Change in median per capita income between 2000 and 2022:| Shelbyville, Texas: | +116.3% |
| Texas: | +113.9% |
Income statistics for Hispanic or Latino residents
Median household income in Shelbyville, TX in 2022:| Shelbyville: | $31,492 |
| State: | $60,504 |
Change in median household income between 2000 and 2022:| Shelbyville, Texas: | +112.9% |
| State: | +102.5% |
Number of households with income < $10k:| Shelbyville: | 5.8% (53,029) |
| Texas: | 5.8% (213,953) |
Number of households with income $10k - 20k:| Shelbyville: | 8.0% (73,752) |
| Texas: | 8.0% (297,456) |
Number of households with income $20k - 30k:| Shelbyville: | 9.2% (84,266) |
| Texas: | 9.2% (340,166) |
Number of households with income $30k - 40k:| Shelbyville: | 9.5% (87,856) |
| Texas: | 9.5% (354,336) |
Number of households with income $40k - 50k:| Shelbyville: | 8.8% (81,026) |
| State: | 8.8% (327,013) |
Number of households with income $50k - 60k:| Shelbyville: | 8.3% (76,473) |
| State: | 8.3% (308,818) |
Number of households with income $60k - 75k:| Shelbyville: | 10.9% (100,406) |
| Texas: | 10.9% (405,109) |
Number of households with income $75k - 100k:| Shelbyville: | 13.8% (126,866) |
| Texas: | 13.8% (511,639) |
Number of households with income $100k - 125k:| Shelbyville: | 8.6% (79,285) |
| Texas: | 8.6% (319,728) |
Number of households with income $125k - 150k:| Shelbyville: | 5.7% (52,351) |
| Texas: | 5.7% (210,932) |
Number of households with income $150k - 200k:| Shelbyville: | 6.4% (58,467) |
| State: | 6.4% (236,055) |
Number of households with income > $200k:| Shelbyville: | 5.1% (46,941) |
| Texas: | 5.1% (189,259) |
Aggregate household income in Shelbyville in 2022: $16,365,324
Median family income in Shelbyville in 2022:| Shelbyville: | $46,604 |
| Texas: | $65,080 |
Number of families with income < $10k:| Shelbyville: | 13.4% (73) |
| State: | 5.3% (147,493) |
Number of families with income $10k - 20k:| Shelbyville: | 8.0% (43) |
| State: | 6.3% (174,531) |
Number of families with income $20k - 30k:| Shelbyville: | 16.7% (91) |
| Texas: | 8.6% (238,528) |
Number of families with income $30k - 40k:| Shelbyville: | 16.1% (87) |
| Texas: | 9.1% (251,999) |
Number of families with income $40k - 50k:| Shelbyville: | 9.2% (50) |
| State: | 8.6% (240,188) |
Number of families with income $50k - 60k:| Shelbyville: | 7.3% (40) |
| Texas: | 8.0% (223,566) |
Number of families with income $60k - 75k:| Shelbyville: | 8.4% (45) |
| State: | 10.9% (302,688) |
Number of families with income $75k - 100k:| Shelbyville: | 7.8% (43) |
| State: | 14.3% (398,554) |
Number of families with income $100k - 125k:| Shelbyville: | 7.3% (39) |
| Texas: | 9.5% (264,007) |
Number of families with income $125k - 150k:| Shelbyville: | 1.0% (5) |
| Texas: | 6.2% (171,274) |
Number of families with income $150k - 200k:| Shelbyville: | 1.4% (8) |
| Texas: | 7.3% (202,259) |
Number of families with income > $200k:| Shelbyville: | 3.4% (19) |
| Texas: | 5.9% (165,129) |
Median non-family income in Shelbyville in 2022:| Shelbyville: | $29,441 |
| State: | $39,934 |
Change in median non-family income between 2000 and 2022:| Shelbyville, Texas: | +120.8% |
| State: | +109.1% |
Median per capita income in Shelbyville in 2022:| Shelbyville: | $20,940 |
| State: | $24,862 |
Change in median per capita income between 2000 and 2022:| Shelbyville, Texas: | +128.5% |
| State: | +130.8% |
Income statistics for American Indian and Alaska Native residents
Median household income in Shelbyville, TX in 2022:| Shelbyville: | $55,695 |
| State: | $65,765 |
Change in median household income between 2000 and 2022:| Shelbyville, Texas: | +93.7% |
| State: | +88.3% |
Number of households with income < $10k:| Shelbyville: | 4.1% (1,401) |
| State: | 4.1% (3,398) |
Number of households with income $10k - 20k:| Shelbyville: | 8.3% (2,865) |
| Texas: | 8.3% (6,949) |
Number of households with income $20k - 30k:| Shelbyville: | 9.3% (3,193) |
| Texas: | 9.3% (7,742) |
Number of households with income $30k - 40k:| Shelbyville: | 9.1% (3,141) |
| State: | 9.1% (7,627) |
Number of households with income $40k - 50k:| Shelbyville: | 7.1% (2,444) |
| State: | 7.1% (5,922) |
Number of households with income $50k - 60k:| Shelbyville: | 8.1% (2,788) |
| State: | 8.1% (6,761) |
Number of households with income $60k - 75k:| Shelbyville: | 12.7% (4,364) |
| Texas: | 12.7% (10,588) |
Number of households with income $75k - 100k:| Shelbyville: | 13.0% (4,496) |
| Texas: | 13.0% (10,903) |
Number of households with income $100k - 125k:| Shelbyville: | 9.9% (3,404) |
| State: | 9.9% (8,256) |
Number of households with income $125k - 150k:| Shelbyville: | 5.2% (1,794) |
| State: | 5.2% (4,355) |
Number of households with income $150k - 200k:| Shelbyville: | 6.7% (2,316) |
| State: | 6.7% (5,623) |
Number of households with income > $200k:| Shelbyville: | 6.6% (2,274) |
| Texas: | 6.6% (5,522) |
Aggregate household income in Shelbyville in 2022: $204,813
Median non-family income in Shelbyville in 2022:| Shelbyville: | $51,789 |
| State: | $40,351 |
Change in median non-family income between 2000 and 2022:| Shelbyville, Texas: | +80.1% |
| Texas: | +71.9% |
Median per capita income in Shelbyville in 2022:| Shelbyville: | $56,197 |
| State: | $28,166 |
Change in median per capita income between 2000 and 2022:| Shelbyville, Texas: | +95.5% |
| State: | +77.2% |
Income statistics for Multirace residents
Median household income in Shelbyville, TX in 2022:| Shelbyville: | $42,062 |
| State: | $62,748 |
Change in median household income between 2000 and 2022:| Shelbyville, Texas: | +97.9% |
| State: | +92.3% |
Number of households with income < $10k:| Shelbyville: | 5.5% (39,791) |
| State: | 5.5% (122,324) |
Number of households with income $10k - 20k:| Shelbyville: | 8.2% (59,280) |
| State: | 8.2% (182,232) |
Number of households with income $20k - 30k:| Shelbyville: | 8.5% (61,566) |
| Texas: | 8.5% (189,456) |
Number of households with income $30k - 40k:| Shelbyville: | 8.9% (64,228) |
| State: | 8.9% (197,499) |
Number of households with income $40k - 50k:| Shelbyville: | 8.7% (62,388) |
| State: | 8.7% (191,735) |
Number of households with income $50k - 60k:| Shelbyville: | 8.0% (57,703) |
| State: | 8.0% (177,535) |
Number of households with income $60k - 75k:| Shelbyville: | 10.5% (75,632) |
| Texas: | 10.5% (232,479) |
Number of households with income $75k - 100k:| Shelbyville: | 13.1% (94,460) |
| State: | 13.1% (290,448) |
Number of households with income $100k - 125k:| Shelbyville: | 8.6% (62,338) |
| Texas: | 8.6% (191,595) |
Number of households with income $125k - 150k:| Shelbyville: | 6.0% (43,420) |
| State: | 6.0% (133,361) |
Number of households with income $150k - 200k:| Shelbyville: | 7.2% (51,716) |
| Texas: | 7.2% (159,195) |
Number of households with income > $200k:| Shelbyville: | 6.7% (48,151) |
| State: | 6.7% (148,064) |
Aggregate household income in Shelbyville in 2022: $7,863,796
Median family income in Shelbyville in 2022:| Shelbyville: | $41,861 |
| State: | $69,780 |
Number of families with income $20k - 30k:| Shelbyville: | 100.0% (40) |
| State: | 7.8% (126,627) |
Median per capita income in Shelbyville in 2022:| Shelbyville: | $8,545 |
| Texas: | $26,785 |
Change in median per capita income between 2000 and 2022:| Shelbyville, Texas: | +108.4% |
| State: | +110.9% |
Income statistics for other residents
Number of households with income < $10k:| Shelbyville: | 4.8% (1) |
| State: | 5.9% (54,162) |
Number of households with income $10k - 20k:| Shelbyville: | 9.5% (2) |
| State: | 6.8% (62,891) |
Number of households with income $20k - 30k:| Shelbyville: | 9.5% (2) |
| Texas: | 10.6% (97,294) |
Number of households with income $30k - 40k:| Shelbyville: | 9.5% (2) |
| State: | 10.8% (99,670) |
Number of households with income $40k - 50k:| Shelbyville: | 9.5% (2) |
| State: | 9.3% (85,548) |
Number of households with income $50k - 60k:| Shelbyville: | 9.5% (2) |
| Texas: | 9.0% (82,757) |
Number of households with income $60k - 75k:| Shelbyville: | 9.5% (2) |
| Texas: | 10.9% (100,326) |
Number of households with income $75k - 100k:| Shelbyville: | 14.3% (3) |
| State: | 14.0% (128,767) |
Number of households with income $100k - 125k:| Shelbyville: | 9.5% (2) |
| Texas: | 8.2% (75,218) |
Number of households with income $125k - 150k:| Shelbyville: | 4.8% (1) |
| State: | 4.8% (44,223) |
Number of households with income $150k - 200k:| Shelbyville: | 4.8% (1) |
| State: | 5.6% (51,376) |
Number of households with income > $200k:| Shelbyville: | 4.8% (1) |
| State: | 4.0% (36,393) |
Aggregate household income in Shelbyville in 2022: $1,475,942
Median non-family income in Shelbyville in 2022:| Shelbyville: | $29,856 |
| State: | $38,690 |
Change in median non-family income between 2000 and 2022:| Shelbyville, Texas: | +123.9% |
| State: | +90.2% |
Median per capita income in Shelbyville in 2022:| Shelbyville: | $28,417 |
| Texas: | $23,899 |
Change in median per capita income between 2000 and 2022:| Shelbyville, Texas: | +141.8% |
| Texas: | +135.2% |