Sherman, Connecticut (CT) income map, earnings map, and wages data
The median household income in Sherman, CT in 2022 was $128,944, which was 31.4% greater than the median annual income of $88,429 across the entire state of Connecticut. Compared to the median income of $76,202 in 2000 this represents an increase of 40.9%. The per capita income in 2022 was $71,470, which means an increase of 45.3% compared to 2000 when it was $39,070.
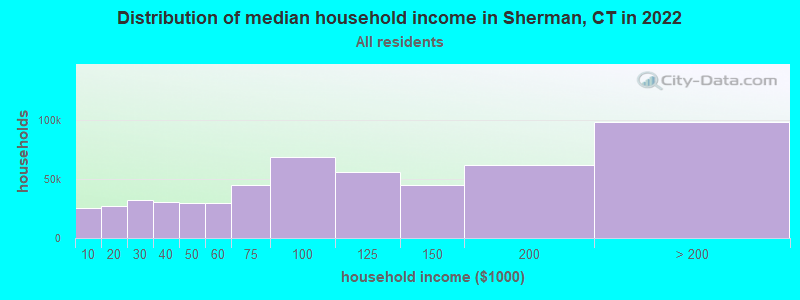
Income statistics for all residents
Median household income in Sherman, CT in 2022:| Sherman: | $128,944 |
| State: | $88,429 |
Change in median household income between 2000 and 2022:| Sherman, Connecticut: | +69.2% |
| Connecticut: | +64.0% |
Number of households with income < $10k:| Sherman: | 5.2% (52,521) |
| State: | 5.1% (72,746) |
Number of households with income $10k - 20k:| Sherman: | 5.8% (59,226) |
| State: | 5.7% (81,643) |
Number of households with income $20k - 30k:| Sherman: | 6.6% (67,038) |
| Connecticut: | 6.5% (92,844) |
Number of households with income $30k - 40k:| Sherman: | 5.9% (60,162) |
| Connecticut: | 5.9% (83,934) |
Number of households with income $40k - 50k:| Sherman: | 5.9% (59,777) |
| State: | 5.8% (83,025) |
Number of households with income $50k - 60k:| Sherman: | 5.8% (58,614) |
| State: | 5.7% (81,788) |
Number of households with income $60k - 75k:| Sherman: | 8.1% (82,126) |
| State: | 8.1% (115,651) |
Number of households with income $75k - 100k:| Sherman: | 12.6% (128,263) |
| Connecticut: | 12.6% (180,173) |
Number of households with income $100k - 125k:| Sherman: | 9.8% (99,851) |
| State: | 9.9% (141,231) |
Number of households with income $125k - 150k:| Sherman: | 7.8% (79,741) |
| Connecticut: | 7.9% (112,826) |
Number of households with income $150k - 200k:| Sherman: | 10.7% (109,079) |
| State: | 10.8% (154,641) |
Number of households with income > $200k:| Sherman: | 16.0% (162,957) |
| State: | 16.3% (233,133) |
Aggregate household income in Sherman in 2022: $6,373,177,706
Median family income in Sherman in 2022:| Sherman: | $146,444 |
| State: | $115,183 |
Median non-family income in Sherman in 2022:| Sherman: | $96,809 |
| State: | $50,964 |
Change in median non-family income between 2000 and 2022:| Sherman, Connecticut: | +71.5% |
| State: | +65.1% |
Median per capita income in Sherman in 2022:| Sherman: | $71,471 |
| State: | $51,581 |
Change in median per capita income between 2000 and 2022:| Sherman, Connecticut: | +82.9% |
| Connecticut: | +79.3% |
Income statistics for White residents
Median household income in Sherman, CT in 2022:| Sherman: | $129,055 |
| State: | $96,890 |
Change in median household income between 2000 and 2022:| Sherman, Connecticut: | +69.4% |
| State: | +68.5% |
Number of households with income < $10k:| Sherman: | 4.2% (28,227) |
| State: | 4.2% (42,265) |
Number of households with income $10k - 20k:| Sherman: | 4.9% (32,453) |
| State: | 4.8% (48,323) |
Number of households with income $20k - 30k:| Sherman: | 5.8% (38,595) |
| Connecticut: | 5.7% (57,716) |
Number of households with income $30k - 40k:| Sherman: | 5.4% (35,725) |
| State: | 5.3% (53,827) |
Number of households with income $40k - 50k:| Sherman: | 5.3% (35,577) |
| State: | 5.3% (53,301) |
Number of households with income $50k - 60k:| Sherman: | 5.6% (37,025) |
| Connecticut: | 5.5% (55,690) |
Number of households with income $60k - 75k:| Sherman: | 7.9% (52,911) |
| State: | 8.0% (80,329) |
Number of households with income $75k - 100k:| Sherman: | 12.7% (84,783) |
| State: | 12.7% (128,070) |
Number of households with income $100k - 125k:| Sherman: | 10.0% (66,575) |
| Connecticut: | 10.0% (101,210) |
Number of households with income $125k - 150k:| Sherman: | 8.0% (53,448) |
| State: | 8.0% (81,250) |
Number of households with income $150k - 200k:| Sherman: | 11.8% (78,590) |
| Connecticut: | 11.8% (119,527) |
Number of households with income > $200k:| Sherman: | 18.4% (123,030) |
| State: | 18.6% (187,875) |
Aggregate household income in Sherman in 2022: $4,782,332,657
Median family income in Sherman in 2022:| Sherman: | $150,155 |
| Connecticut: | $128,955 |
Number of families with income < $10k:| Sherman: | 1.8% (21) |
| State: | 1.9% (11,537) |
Number of families with income $10k - 20k:| Sherman: | 0.8% (10) |
| Connecticut: | 1.8% (11,289) |
Number of families with income $20k - 30k:| Sherman: | 1.0% (12) |
| State: | 3.0% (18,506) |
Number of families with income $30k - 40k:| Sherman: | 2.6% (31) |
| State: | 2.9% (18,160) |
Number of families with income $40k - 50k:| Sherman: | 2.8% (34) |
| Connecticut: | 3.9% (24,550) |
Number of families with income $50k - 60k:| Sherman: | 1.2% (14) |
| State: | 4.3% (26,723) |
Number of families with income $60k - 75k:| Sherman: | 6.3% (76) |
| State: | 7.1% (44,075) |
Number of families with income $75k - 100k:| Sherman: | 11.2% (133) |
| Connecticut: | 12.5% (77,679) |
Number of families with income $100k - 125k:| Sherman: | 10.7% (128) |
| Connecticut: | 11.1% (69,086) |
Number of families with income $125k - 150k:| Sherman: | 11.2% (134) |
| State: | 9.6% (59,616) |
Number of families with income $150k - 200k:| Sherman: | 16.6% (198) |
| State: | 15.7% (97,890) |
Number of families with income > $200k:| Sherman: | 33.7% (402) |
| Connecticut: | 26.3% (163,417) |
Median non-family income in Sherman in 2022:| Sherman: | $98,053 |
| Connecticut: | $54,067 |
Change in median non-family income between 2000 and 2022:| Sherman, Connecticut: | +73.7% |
| State: | +68.7% |
Median per capita income in Sherman in 2022:| Sherman: | $75,429 |
| State: | $59,916 |
Change in median per capita income between 2000 and 2022:| Sherman, Connecticut: | +92.1% |
| State: | +90.2% |
Income statistics for Black or African American residents
Median household income in Sherman, CT in 2022:| Sherman: | $164,551 |
| Connecticut: | $61,803 |
Change in median household income between 2000 and 2022:| Sherman, Connecticut: | +60.9% |
| State: | +76.1% |
Number of households with income < $10k:| Sherman: | 6.8% (27,658) |
| State: | 6.8% (9,494) |
Number of households with income $10k - 20k:| Sherman: | 7.9% (32,054) |
| Connecticut: | 7.9% (11,003) |
Number of households with income $20k - 30k:| Sherman: | 10.8% (43,829) |
| State: | 10.8% (15,045) |
Number of households with income $30k - 40k:| Sherman: | 8.2% (33,504) |
| State: | 8.2% (11,501) |
Number of households with income $40k - 50k:| Sherman: | 7.4% (30,344) |
| State: | 7.4% (10,416) |
Number of households with income $50k - 60k:| Sherman: | 7.5% (30,687) |
| State: | 7.5% (10,534) |
Number of households with income $60k - 75k:| Sherman: | 8.0% (32,756) |
| Connecticut: | 8.0% (11,244) |
Number of households with income $75k - 100k:| Sherman: | 9.6% (38,949) |
| Connecticut: | 9.6% (13,370) |
Number of households with income $100k - 125k:| Sherman: | 10.2% (41,495) |
| State: | 10.2% (14,244) |
Number of households with income $125k - 150k:| Sherman: | 8.0% (32,762) |
| State: | 8.0% (11,246) |
Number of households with income $150k - 200k:| Sherman: | 7.7% (31,250) |
| State: | 7.7% (10,727) |
Number of households with income > $200k:| Sherman: | 7.9% (32,295) |
| State: | 7.9% (11,086) |
Aggregate household income in Sherman in 2022: $4,840,430
Median family income in Sherman in 2022:| Sherman: | $227,228 |
| Connecticut: | $87,228 |
Number of families with income $100k - 125k:| Sherman: | 100.0% (24) |
| Connecticut: | 11.4% (9,482) |
Median per capita income in Sherman in 2022:| Sherman: | $80,179 |
| State: | $36,289 |
Change in median per capita income between 2000 and 2022:| Sherman, Connecticut: | +115.2% |
| Connecticut: | +117.5% |
Income statistics for Hispanic or Latino residents
Median household income in Sherman, CT in 2022:| Sherman: | $102,774 |
| State: | $60,275 |
Change in median household income between 2000 and 2022:| Sherman, Connecticut: | +67.8% |
| Connecticut: | +87.9% |
Number of households with income < $10k:| Sherman: | 8.7% (35,488) |
| Connecticut: | 8.7% (18,584) |
Number of households with income $10k - 20k:| Sherman: | 9.1% (36,731) |
| State: | 9.1% (19,235) |
Number of households with income $20k - 30k:| Sherman: | 8.9% (36,261) |
| Connecticut: | 8.9% (18,989) |
Number of households with income $30k - 40k:| Sherman: | 7.5% (30,490) |
| Connecticut: | 7.5% (15,967) |
Number of households with income $40k - 50k:| Sherman: | 8.7% (35,263) |
| Connecticut: | 8.7% (18,466) |
Number of households with income $50k - 60k:| Sherman: | 6.9% (28,082) |
| Connecticut: | 6.9% (14,706) |
Number of households with income $60k - 75k:| Sherman: | 8.9% (36,068) |
| Connecticut: | 8.9% (18,888) |
Number of households with income $75k - 100k:| Sherman: | 13.5% (54,746) |
| Connecticut: | 13.5% (28,669) |
Number of households with income $100k - 125k:| Sherman: | 8.2% (33,292) |
| State: | 8.2% (17,434) |
Number of households with income $125k - 150k:| Sherman: | 6.5% (26,261) |
| State: | 6.5% (13,752) |
Number of households with income $150k - 200k:| Sherman: | 6.6% (26,952) |
| State: | 6.6% (14,114) |
Number of households with income > $200k:| Sherman: | 6.4% (26,028) |
| State: | 6.4% (13,630) |
Aggregate household income in Sherman in 2022: $9,809,304
Median family income in Sherman in 2022:| Sherman: | $112,913 |
| State: | $68,336 |
Number of families with income < $10k:| Sherman: | 5.0% (11) |
| State: | 5.2% (7,456) |
Number of families with income $10k - 20k:| Sherman: | 3.8% (8) |
| State: | 6.0% (8,616) |
Number of families with income $20k - 30k:| Sherman: | 4.5% (10) |
| Connecticut: | 8.9% (12,680) |
Number of families with income $30k - 40k:| Sherman: | 7.9% (17) |
| State: | 8.5% (12,090) |
Number of families with income $40k - 50k:| Sherman: | 8.1% (17) |
| State: | 8.8% (12,624) |
Number of families with income $50k - 60k:| Sherman: | 3.2% (7) |
| State: | 8.4% (11,924) |
Number of families with income $60k - 75k:| Sherman: | 9.7% (20) |
| State: | 8.9% (12,677) |
Number of families with income $75k - 100k:| Sherman: | 16.4% (34) |
| State: | 14.3% (20,457) |
Number of families with income $100k - 125k:| Sherman: | 9.7% (20) |
| State: | 8.2% (11,720) |
Number of families with income $125k - 150k:| Sherman: | 12.1% (25) |
| State: | 8.2% (11,729) |
Number of families with income $150k - 200k:| Sherman: | 8.9% (19) |
| State: | 7.1% (10,096) |
Number of families with income > $200k:| Sherman: | 10.7% (23) |
| Connecticut: | 7.4% (10,622) |
Median non-family income in Sherman in 2022:| Sherman: | $104,765 |
| State: | $36,714 |
Change in median non-family income between 2000 and 2022:| Sherman, Connecticut: | +73.9% |
| State: | +90.0% |
Median per capita income in Sherman in 2022:| Sherman: | $91,601 |
| Connecticut: | $28,507 |
Change in median per capita income between 2000 and 2022:| Sherman, Connecticut: | +80.3% |
| State: | +117.2% |
Income statistics for American Indian and Alaska Native residents
Number of households with income < $10k:| Sherman: | 8.4% (40,492) |
| Connecticut: | 10.2% (340) |
Number of households with income $10k - 20k:| Sherman: | 9.4% (45,188) |
| State: | 8.5% (283) |
Number of households with income $20k - 30k:| Sherman: | 8.5% (40,873) |
| Connecticut: | 9.4% (314) |
Number of households with income $30k - 40k:| Sherman: | 9.1% (43,791) |
| State: | 10.1% (337) |
Number of households with income $40k - 50k:| Sherman: | 8.3% (40,168) |
| State: | 13.4% (447) |
Number of households with income $50k - 60k:| Sherman: | 7.8% (37,875) |
| State: | 3.1% (104) |
Number of households with income $60k - 75k:| Sherman: | 9.8% (47,209) |
| Connecticut: | 5.6% (188) |
Number of households with income $75k - 100k:| Sherman: | 12.6% (60,939) |
| State: | 13.4% (447) |
Number of households with income $100k - 125k:| Sherman: | 9.4% (45,570) |
| State: | 9.5% (317) |
Number of households with income $125k - 150k:| Sherman: | 5.6% (27,283) |
| State: | 3.9% (131) |
Number of households with income $150k - 200k:| Sherman: | 6.0% (28,761) |
| Connecticut: | 6.3% (212) |
Number of households with income > $200k:| Sherman: | 5.2% (24,894) |
| State: | 6.8% (228) |
Median per capita income in Sherman in 2022:| Sherman: | $8,752 |
| State: | $25,355 |
Change in median per capita income between 2000 and 2022:| Sherman, Connecticut: | +45.9% |
| State: | +39.4% |
Income statistics for Multirace residents
Median household income in Sherman, CT in 2022:| Sherman: | $74,062 |
| Connecticut: | $77,277 |
Change in median household income between 2000 and 2022:| Sherman, Connecticut: | +119.4% |
| State: | +113.6% |
Number of households with income < $10k:| Sherman: | 6.0% (6,955) |
| State: | 6.0% (7,457) |
Number of households with income $10k - 20k:| Sherman: | 8.1% (9,457) |
| State: | 8.1% (10,139) |
Number of households with income $20k - 30k:| Sherman: | 7.0% (8,116) |
| Connecticut: | 7.0% (8,702) |
Number of households with income $30k - 40k:| Sherman: | 6.9% (7,971) |
| State: | 6.9% (8,546) |
Number of households with income $40k - 50k:| Sherman: | 7.0% (8,125) |
| State: | 7.0% (8,712) |
Number of households with income $50k - 60k:| Sherman: | 5.9% (6,837) |
| State: | 5.9% (7,331) |
Number of households with income $60k - 75k:| Sherman: | 8.5% (9,918) |
| State: | 8.5% (10,634) |
Number of households with income $75k - 100k:| Sherman: | 14.1% (16,415) |
| Connecticut: | 14.1% (17,600) |
Number of households with income $100k - 125k:| Sherman: | 9.9% (11,549) |
| Connecticut: | 9.9% (12,383) |
Number of households with income $125k - 150k:| Sherman: | 7.2% (8,320) |
| Connecticut: | 7.2% (8,921) |
Number of households with income $150k - 200k:| Sherman: | 8.8% (10,187) |
| State: | 8.8% (10,922) |
Number of households with income > $200k:| Sherman: | 10.6% (12,355) |
| Connecticut: | 10.6% (13,247) |
Aggregate household income in Sherman in 2022: $13,416,776
Median family income in Sherman in 2022:| Sherman: | $72,579 |
| State: | $84,255 |
Number of families with income $20k - 30k:| Sherman: | 8.3% (13) |
| Connecticut: | 6.9% (5,812) |
Number of families with income $30k - 40k:| Sherman: | 7.3% (11) |
| Connecticut: | 6.8% (5,759) |
Number of families with income $150k - 200k:| Sherman: | 84.4% (127) |
| Connecticut: | 9.3% (7,818) |
Median per capita income in Sherman in 2022:| Sherman: | $73,463 |
| State: | $32,794 |
Change in median per capita income between 2000 and 2022:| Sherman, Connecticut: | +95.5% |
| Connecticut: | +117.2% |
Income statistics for other residents
Number of households with income < $10k:| Sherman: | 10.0% (2) |
| State: | 9.0% (8,596) |
Number of households with income $10k - 20k:| Sherman: | 10.0% (2) |
| Connecticut: | 10.2% (9,773) |
Number of households with income $20k - 30k:| Sherman: | 10.0% (2) |
| State: | 9.1% (8,691) |
Number of households with income $30k - 40k:| Sherman: | 10.0% (2) |
| Connecticut: | 7.8% (7,447) |
Number of households with income $40k - 50k:| Sherman: | 10.0% (2) |
| Connecticut: | 8.2% (7,860) |
Number of households with income $50k - 60k:| Sherman: | 5.0% (1) |
| State: | 6.0% (5,757) |
Number of households with income $60k - 75k:| Sherman: | 10.0% (2) |
| Connecticut: | 9.3% (8,942) |
Number of households with income $75k - 100k:| Sherman: | 15.0% (3) |
| State: | 14.3% (13,700) |
Number of households with income $100k - 125k:| Sherman: | 5.0% (1) |
| State: | 7.2% (6,906) |
Number of households with income $125k - 150k:| Sherman: | 5.0% (1) |
| Connecticut: | 6.5% (6,215) |
Number of households with income $150k - 200k:| Sherman: | 5.0% (1) |
| State: | 6.1% (5,865) |
Number of households with income > $200k:| Sherman: | 5.0% (1) |
| State: | 6.3% (6,065) |
Aggregate household income in Sherman in 2022: $2,739,253
Median family income in Sherman in 2022:| Sherman: | $155,676 |
| State: | $67,610 |
Number of families with income $60k - 75k:| Sherman: | 100.0% (13) |
| Connecticut: | 9.4% (6,232) |
Median per capita income in Sherman in 2022:| Sherman: | $38,818 |
| State: | $29,353 |