The median household income in Sherwood Manor, CT in 2022 was $97,022, which was 8.9% greater than the median annual income of $88,429 across the entire state of Connecticut. Compared to the median income of $56,641 in 2000 this represents an increase of 41.6%. The per capita income in 2022 was $40,153, which means an increase of 38.1% compared to 2000 when it was $24,839.
Whole page based on the data from 2000 / 2022 when the population of Sherwood Manor, Connecticut was 5,689 / 5,755
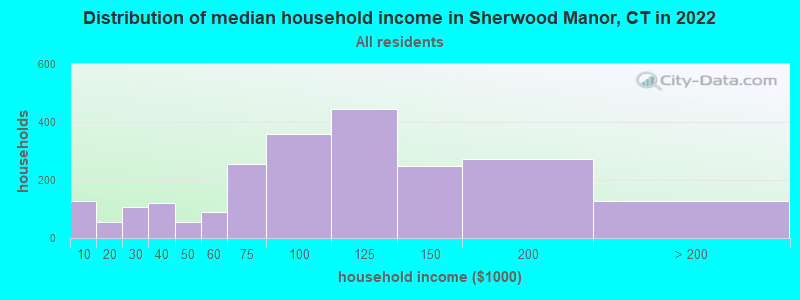
Income statistics for all residents
Median household income in Sherwood Manor, CT in 2022:
Sherwood Manor:
$97,023
Connecticut:
$88,429
Change in median household income between 2000 and 2022:
Sherwood Manor, Connecticut:
+71.3%
State:
+64.0%
Number of households with income < $10k:
Sherwood Manor:
5.6% (126)
Connecticut:
5.1% (72,746)
Number of households with income $10k - 20k:
Sherwood Manor:
2.4% (55)
State:
5.7% (81,643)
Number of households with income $20k - 30k:
Sherwood Manor:
4.7% (106)
State:
6.5% (92,844)
Number of households with income $30k - 40k:
Sherwood Manor:
5.3% (119)
Connecticut:
5.9% (83,934)
Number of households with income $40k - 50k:
Sherwood Manor:
2.4% (54)
State:
5.8% (83,025)
Number of households with income $50k - 60k:
Sherwood Manor:
4.0% (90)
State:
5.7% (81,788)
Number of households with income $60k - 75k:
Sherwood Manor:
11.3% (255)
Connecticut:
8.1% (115,651)
Number of households with income $75k - 100k:
Sherwood Manor:
16.0% (360)
Connecticut:
12.6% (180,173)
Number of households with income $100k - 125k:
Sherwood Manor:
19.7% (445)
State:
9.9% (141,231)
Number of households with income $125k - 150k:
Sherwood Manor:
10.9% (247)
State:
7.9% (112,826)
Number of households with income $150k - 200k:
Sherwood Manor:
12.1% (274)
Connecticut:
10.8% (154,641)
Number of households with income > $200k:
Sherwood Manor:
5.6% (126)
Connecticut:
16.3% (233,133)
Aggregate household income in Sherwood Manor in 2022: $220,218,807
Median family income in Sherwood Manor in 2022:
Sherwood Manor:
$103,303
State:
$115,183
Number of families with income < $10k:
Sherwood Manor:
1.7% (23)
State:
2.6% (23,251)
Number of families with income $10k - 20k:
Sherwood Manor:
0.3% (4)
State:
2.8% (25,184)
Number of families with income $20k - 30k:
Sherwood Manor:
7.4% (104)
Connecticut:
4.1% (36,835)
Number of families with income $30k - 40k:
Sherwood Manor:
1.4% (20)
State:
4.2% (38,052)
Number of families with income $40k - 50k:
Sherwood Manor:
2.1% (29)
State:
4.8% (43,104)
Number of families with income $50k - 60k:
Sherwood Manor:
4.1% (58)
Connecticut:
4.8% (43,284)
Number of families with income $60k - 75k:
Sherwood Manor:
8.9% (125)
State:
7.4% (66,521)
Number of families with income $75k - 100k:
Sherwood Manor:
17.3% (243)
State:
12.9% (116,232)
Number of families with income $100k - 125k:
Sherwood Manor:
25.2% (354)
State:
10.6% (95,504)
Number of families with income $125k - 150k:
Sherwood Manor:
9.8% (137)
State:
9.5% (86,149)
Number of families with income $150k - 200k:
Sherwood Manor:
13.8% (194)
Connecticut:
14.0% (125,908)
Number of families with income > $200k:
Sherwood Manor:
8.1% (114)
Connecticut:
22.4% (202,515)
Median non-family income in Sherwood Manor in 2022:
Sherwood Manor:
$65,466
State:
$50,964
Change in median non-family income between 2000 and 2022:
Sherwood Manor, Connecticut:
+72.7%
Connecticut:
+65.1%
Median per capita income in Sherwood Manor in 2022:
Sherwood Manor:
$40,153
Connecticut:
$51,581
Change in median per capita income between 2000 and 2022:
Sherwood Manor, Connecticut:
+61.7%
State:
+79.3%
Income statistics for White residents
Median household income in Sherwood Manor, CT in 2022:
Sherwood Manor:
$97,612
Connecticut:
$96,890
Change in median household income between 2000 and 2022:
Sherwood Manor, Connecticut:
+72.0%
Connecticut:
+68.5%
Number of households with income < $10k:
Sherwood Manor:
5.0% (97)
Connecticut:
4.2% (42,265)
Number of households with income $10k - 20k:
Sherwood Manor:
2.6% (50)
Connecticut:
4.8% (48,323)
Number of households with income $20k - 30k:
Sherwood Manor:
5.1% (98)
Connecticut:
5.7% (57,716)
Number of households with income $30k - 40k:
Sherwood Manor:
5.8% (111)
Connecticut:
5.3% (53,827)
Number of households with income $40k - 50k:
Sherwood Manor:
2.6% (51)
State:
5.3% (53,301)
Number of households with income $50k - 60k:
Sherwood Manor:
4.6% (88)
State:
5.5% (55,690)
Number of households with income $60k - 75k:
Sherwood Manor:
9.2% (178)
State:
8.0% (80,329)
Number of households with income $75k - 100k:
Sherwood Manor:
16.4% (316)
State:
12.7% (128,070)
Number of households with income $100k - 125k:
Sherwood Manor:
20.6% (397)
State:
10.0% (101,210)
Number of households with income $125k - 150k:
Sherwood Manor:
10.9% (209)
State:
8.0% (81,250)
Number of households with income $150k - 200k:
Sherwood Manor:
13.2% (254)
State:
11.8% (119,527)
Number of households with income > $200k:
Sherwood Manor:
4.0% (77)
Connecticut:
18.6% (187,875)
Aggregate household income in Sherwood Manor in 2022: $185,790,589
Median family income in Sherwood Manor in 2022:
Sherwood Manor:
$104,613
State:
$128,955
Number of families with income $10k - 20k:
Sherwood Manor:
0.4% (5)
State:
1.8% (11,289)
Number of families with income $20k - 30k:
Sherwood Manor:
8.2% (96)
State:
3.0% (18,506)
Number of families with income $30k - 40k:
Sherwood Manor:
1.3% (16)
State:
2.9% (18,160)
Number of families with income $40k - 50k:
Sherwood Manor:
2.4% (28)
State:
3.9% (24,550)
Number of families with income $50k - 60k:
Sherwood Manor:
4.6% (54)
State:
4.3% (26,723)
Number of families with income $60k - 75k:
Sherwood Manor:
6.3% (74)
State:
7.1% (44,075)
Number of families with income $75k - 100k:
Sherwood Manor:
19.0% (223)
State:
12.5% (77,679)
Number of families with income $100k - 125k:
Sherwood Manor:
27.1% (318)
Connecticut:
11.1% (69,086)
Number of families with income $125k - 150k:
Sherwood Manor:
9.2% (108)
State:
9.6% (59,616)
Number of families with income $150k - 200k:
Sherwood Manor:
16.0% (187)
State:
15.7% (97,890)
Number of families with income > $200k:
Sherwood Manor:
5.6% (65)
Connecticut:
26.3% (163,417)
Median non-family income in Sherwood Manor in 2022:
Sherwood Manor:
$63,090
State:
$54,067
Change in median non-family income between 2000 and 2022:
Sherwood Manor, Connecticut:
+60.7%
Connecticut:
+68.7%
Median per capita income in Sherwood Manor in 2022:
Sherwood Manor:
$45,884
State:
$59,916
Change in median per capita income between 2000 and 2022:
Sherwood Manor, Connecticut:
+82.5%
Connecticut:
+90.2%
Income statistics for Black or African American residents
Median household income in Sherwood Manor, CT in 2022:
Sherwood Manor:
$73,356
State:
$61,803
Change in median household income between 2000 and 2022:
Sherwood Manor, Connecticut:
+49.8%
State:
+76.1%
Number of households with income < $10k:
Sherwood Manor:
0.0% (0)
State:
6.8% (9,494)
Number of households with income $10k - 20k:
Sherwood Manor:
0.0% (0)
Connecticut:
7.9% (11,003)
Number of households with income $20k - 30k:
Sherwood Manor:
0.0% (0)
State:
10.8% (15,045)
Number of households with income $30k - 40k:
Sherwood Manor:
0.0% (0)
State:
8.2% (11,501)
Number of households with income $40k - 50k:
Sherwood Manor:
0.0% (0)
State:
7.4% (10,416)
Number of households with income $50k - 60k:
Sherwood Manor:
0.0% (0)
Connecticut:
7.5% (10,534)
Number of households with income $60k - 75k:
Sherwood Manor:
61.1% (33)
State:
8.0% (11,244)
Number of households with income $75k - 100k:
Sherwood Manor:
0.0% (0)
State:
9.6% (13,370)
Number of households with income $100k - 125k:
Sherwood Manor:
38.9% (21)
State:
10.2% (14,244)
Number of households with income $125k - 150k:
Sherwood Manor:
0.0% (0)
Connecticut:
8.0% (11,246)
Number of households with income $150k - 200k:
Sherwood Manor:
0.0% (0)
State:
7.7% (10,727)
Number of households with income > $200k:
Sherwood Manor:
0.0% (0)
State:
7.9% (11,086)
Aggregate household income in Sherwood Manor in 2022: $4,962,317
Median family income in Sherwood Manor in 2022:
Sherwood Manor:
$80,223
State:
$87,228
Number of families with income $60k - 75k:
Sherwood Manor:
60.6% (30)
Connecticut:
8.2% (6,861)
Number of families with income $100k - 125k:
Sherwood Manor:
39.4% (20)
State:
11.4% (9,482)
Median per capita income in Sherwood Manor in 2022:
Sherwood Manor:
$19,074
State:
$36,289
Change in median per capita income between 2000 and 2022:: -6.4%
Sherwood Manor, Connecticut:
-6.4%
State:
+117.5%
Income statistics for Asian residents
Number of households with income < $10k:
Sherwood Manor:
60.0% (30)
State:
7.1% (4,245)
Number of households with income $10k - 20k:
Sherwood Manor:
0.0% (0)
Connecticut:
3.5% (2,087)
Number of households with income $20k - 30k:
Sherwood Manor:
0.0% (0)
Connecticut:
4.1% (2,464)
Number of households with income $30k - 40k:
Sherwood Manor:
0.0% (0)
Connecticut:
4.1% (2,478)
Number of households with income $40k - 50k:
Sherwood Manor:
0.0% (0)
State:
3.3% (1,983)
Number of households with income $50k - 60k:
Sherwood Manor:
0.0% (0)
Connecticut:
3.9% (2,328)
Number of households with income $60k - 75k:
Sherwood Manor:
8.0% (4)
State:
7.0% (4,228)
Number of households with income $75k - 100k:
Sherwood Manor:
0.0% (0)
Connecticut:
11.5% (6,911)
Number of households with income $100k - 125k:
Sherwood Manor:
0.0% (0)
Connecticut:
10.2% (6,127)
Number of households with income $125k - 150k:
Sherwood Manor:
4.0% (2)
Connecticut:
8.5% (5,079)
Number of households with income $150k - 200k:
Sherwood Manor:
0.0% (0)
State:
12.4% (7,434)
Number of households with income > $200k:
Sherwood Manor:
28.0% (14)
Connecticut:
24.4% (14,661)
Aggregate household income in Sherwood Manor in 2022: $5,250,662
Median per capita income in Sherwood Manor in 2022:
Sherwood Manor:
$29,042
State:
$55,295
Change in median per capita income between 2000 and 2022:
Sherwood Manor, Connecticut:
+74.3%
Connecticut:
+97.8%
Income statistics for Hispanic or Latino residents
Median household income in Sherwood Manor, CT in 2022:
Sherwood Manor:
$88,547
State:
$60,275
Change in median household income between 2000 and 2022:
Sherwood Manor, Connecticut:
+43.4%
Connecticut:
+87.9%
Number of households with income < $10k:
Sherwood Manor:
0.0% (0)
Connecticut:
8.7% (18,584)
Number of households with income $10k - 20k:
Sherwood Manor:
2.2% (4)
State:
9.1% (19,235)
Number of households with income $20k - 30k:
Sherwood Manor:
11.9% (22)
Connecticut:
8.9% (18,989)
Number of households with income $30k - 40k:
Sherwood Manor:
0.0% (0)
State:
7.5% (15,967)
Number of households with income $40k - 50k:
Sherwood Manor:
0.0% (0)
State:
8.7% (18,466)
Number of households with income $50k - 60k:
Sherwood Manor:
0.0% (0)
Connecticut:
6.9% (14,706)
Number of households with income $60k - 75k:
Sherwood Manor:
3.8% (7)
State:
8.9% (18,888)
Number of households with income $75k - 100k:
Sherwood Manor:
49.2% (91)
State:
13.5% (28,669)
Number of households with income $100k - 125k:
Sherwood Manor:
0.0% (0)
State:
8.2% (17,434)
Number of households with income $125k - 150k:
Sherwood Manor:
10.3% (19)
Connecticut:
6.5% (13,752)
Number of households with income $150k - 200k:
Sherwood Manor:
4.9% (9)
State:
6.6% (14,114)
Number of households with income > $200k:
Sherwood Manor:
17.8% (33)
Connecticut:
6.4% (13,630)
Aggregate household income in Sherwood Manor in 2022: $18,480,425
Median non-family income in Sherwood Manor in 2022:
Sherwood Manor:
$85,168
State:
$36,714
Change in median non-family income between 2000 and 2022:
Sherwood Manor, Connecticut:
+12.8%
State:
+90.0%
Median per capita income in Sherwood Manor in 2022:
Sherwood Manor:
$34,067
Connecticut:
$28,507
Change in median per capita income between 2000 and 2022:
Sherwood Manor, Connecticut:
+74.2%
State:
+117.2%
Income statistics for Multirace residents
Number of households with income < $10k:
Sherwood Manor:
0.0% (0)
State:
6.0% (7,457)
Number of households with income $10k - 20k:
Sherwood Manor:
6.7% (9)
Connecticut:
8.1% (10,139)
Number of households with income $20k - 30k:
Sherwood Manor:
0.0% (0)
State:
7.0% (8,702)
Number of households with income $30k - 40k:
Sherwood Manor:
0.0% (0)
Connecticut:
6.9% (8,546)
Number of households with income $40k - 50k:
Sherwood Manor:
0.0% (0)
State:
7.0% (8,712)
Number of households with income $50k - 60k:
Sherwood Manor:
0.0% (0)
State:
5.9% (7,331)
Number of households with income $60k - 75k:
Sherwood Manor:
22.2% (30)
Connecticut:
8.5% (10,634)
Number of households with income $75k - 100k:
Sherwood Manor:
28.1% (38)
Connecticut:
14.1% (17,600)
Number of households with income $100k - 125k:
Sherwood Manor:
0.0% (0)
State:
9.9% (12,383)
Number of households with income $125k - 150k:
Sherwood Manor:
0.0% (0)
Connecticut:
7.2% (8,921)
Number of households with income $150k - 200k:
Sherwood Manor:
10.4% (14)
State:
8.8% (10,922)
Number of households with income > $200k:
Sherwood Manor:
32.6% (44)
State:
10.6% (13,247)
Aggregate household income in Sherwood Manor in 2022: $17,294,409
Median non-family income in Sherwood Manor in 2022:
Sherwood Manor:
$81,739
State:
$44,462
Median per capita income in Sherwood Manor in 2022:
Sherwood Manor:
$30,688
Connecticut:
$32,794
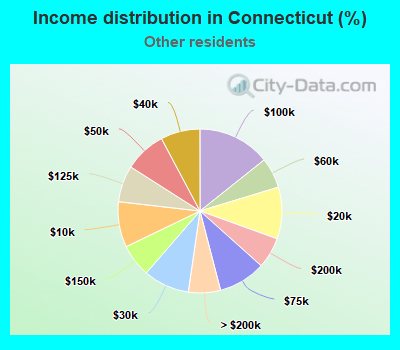
Income statistics for other residents
Number of households with income < $10k:
Sherwood Manor:
0.0% (0)
State:
9.0% (8,596)
Number of households with income $10k - 20k:
Sherwood Manor:
0.0% (0)
State:
10.2% (9,773)
Number of households with income $20k - 30k:
Sherwood Manor:
0.0% (0)
State:
9.1% (8,691)
Number of households with income $30k - 40k:
Sherwood Manor:
0.0% (0)
Connecticut:
7.8% (7,447)
Number of households with income $40k - 50k:
Sherwood Manor:
0.0% (0)
State:
8.2% (7,860)
Number of households with income $50k - 60k:
Sherwood Manor:
0.0% (0)
State:
6.0% (5,757)
Number of households with income $60k - 75k:
Sherwood Manor:
25.7% (9)
Connecticut:
9.3% (8,942)
Number of households with income $75k - 100k:
Sherwood Manor:
0.0% (0)
State:
14.3% (13,700)
Number of households with income $100k - 125k:
Sherwood Manor:
0.0% (0)
State:
7.2% (6,906)
Number of households with income $125k - 150k:
Sherwood Manor:
74.3% (26)
State:
6.5% (6,215)
Number of households with income $150k - 200k:
Sherwood Manor:
0.0% (0)
State:
6.1% (5,865)
Number of households with income > $200k:
Sherwood Manor:
0.0% (0)
State:
6.3% (6,065)
Aggregate household income in Sherwood Manor in 2022: $1,940,269
Median per capita income in Sherwood Manor in 2022:
Sherwood Manor:
$30,040
State:
$29,353
Change in median per capita income between 2000 and 2022:
Sherwood Manor, Connecticut:
+16.3%
State:
+165.8%
Discuss Sherwood Manor, Connecticut (CT) on our hugely popular Connecticut forum.