The median household income in Shirley, MA in 2022 was $83,361, which was 13.3% less than the median annual income of $94,488 across the entire state of Massachusetts. Compared to the median income of $40,956 in 2000 this represents an increase of 50.9%. The per capita income in 2022 was $41,110, which means an increase of 45.9% compared to 2000 when it was $22,256.
Whole page based on the data from 2000 / 2022 when the population of Shirley, Massachusetts was 1,427 / 1,354
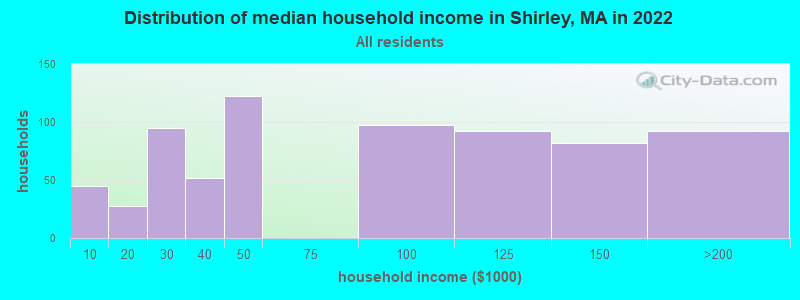
Income statistics for all residents
Median household income in Shirley, MA in 2022:
Shirley:
$83,362
State:
$94,488
Change in median household income between 2000 and 2022:
Shirley, Massachusetts:
+103.5%
State:
+87.1%
Number of households with income < $10k:
Shirley:
6.4% (45)
Massachusetts:
5.2% (146,170)
Number of households with income $10k - 20k:
Shirley:
4.0% (28)
State:
6.4% (180,001)
Number of households with income $20k - 30k:
Shirley:
13.5% (95)
Massachusetts:
5.6% (156,667)
Number of households with income $30k - 40k:
Shirley:
7.4% (52)
Massachusetts:
5.6% (157,168)
Number of households with income $40k - 50k:
Shirley:
17.3% (122)
State:
5.4% (151,455)
Number of households with income $50k - 60k:
Shirley:
0.0% (0)
State:
5.1% (142,726)
Number of households with income $60k - 75k:
Shirley:
0.0% (0)
State:
7.6% (212,203)
Number of households with income $75k - 100k:
Shirley:
13.8% (97)
State:
11.3% (317,064)
Number of households with income $100k - 125k:
Shirley:
13.0% (92)
Massachusetts:
9.7% (270,603)
Number of households with income $125k - 150k:
Shirley:
11.6% (82)
Massachusetts:
8.0% (223,140)
Number of households with income $150k - 200k:
Shirley:
13.0% (92)
State:
11.0% (308,695)
Number of households with income > $200k:
Shirley:
0.0% (0)
State:
19.0% (531,884)
Aggregate household income in Shirley in 2022: $55,070,590
Median family income in Shirley in 2022:
Shirley:
$123,678
State:
$120,263
Number of families with income $75k - 100k:
Shirley:
20.2% (66)
State:
11.1% (192,172)
Number of families with income $100k - 125k:
Shirley:
28.1% (92)
State:
10.6% (182,105)
Number of families with income $125k - 150k:
Shirley:
25.4% (83)
State:
9.3% (159,566)
Number of families with income $150k - 200k:
Shirley:
26.4% (86)
State:
13.4% (231,410)
Median non-family income in Shirley in 2022:
Shirley:
$37,549
Massachusetts:
$55,979
Change in median non-family income between 2000 and 2022:
Shirley, Massachusetts:
+82.9%
State:
+88.0%
Median per capita income in Shirley in 2022:
Shirley:
$41,111
Massachusetts:
$54,025
Change in median per capita income between 2000 and 2022:
Shirley, Massachusetts:
+84.7%
State:
+108.2%
Income statistics for White residents
Median household income in Shirley, MA in 2022:
Shirley:
$83,838
State:
$101,391
Change in median household income between 2000 and 2022:
Shirley, Massachusetts:
+105.8%
State:
+93.3%
Number of households with income < $10k:
Shirley:
6.4% (43)
State:
4.4% (91,120)
Number of households with income $10k - 20k:
Shirley:
3.7% (25)
Massachusetts:
5.9% (122,055)
Number of households with income $20k - 30k:
Shirley:
13.6% (92)
State:
5.1% (105,311)
Number of households with income $30k - 40k:
Shirley:
7.6% (51)
State:
5.3% (110,239)
Number of households with income $40k - 50k:
Shirley:
16.5% (111)
State:
5.0% (104,636)
Number of households with income $50k - 60k:
Shirley:
0.0% (0)
State:
4.8% (99,486)
Number of households with income $60k - 75k:
Shirley:
0.0% (0)
State:
7.5% (155,124)
Number of households with income $75k - 100k:
Shirley:
13.9% (94)
Massachusetts:
11.4% (236,252)
Number of households with income $100k - 125k:
Shirley:
12.8% (86)
Massachusetts:
9.9% (204,731)
Number of households with income $125k - 150k:
Shirley:
12.0% (81)
State:
8.5% (175,324)
Number of households with income $150k - 200k:
Shirley:
13.5% (91)
Massachusetts:
11.7% (242,980)
Number of households with income > $200k:
Shirley:
0.0% (0)
State:
20.5% (425,966)
Aggregate household income in Shirley in 2022: $52,888,901
Median family income in Shirley in 2022:
Shirley:
$126,293
State:
$133,153
Number of families with income $75k - 100k:
Shirley:
19.8% (62)
Massachusetts:
11.1% (137,395)
Number of families with income $100k - 125k:
Shirley:
27.4% (86)
State:
11.1% (136,771)
Number of families with income $125k - 150k:
Shirley:
25.9% (81)
State:
10.0% (123,709)
Number of families with income $150k - 200k:
Shirley:
27.0% (85)
State:
14.7% (181,602)
Median non-family income in Shirley in 2022:
Shirley:
$37,525
State:
$59,323
Change in median non-family income between 2000 and 2022:
Shirley, Massachusetts:
+85.4%
State:
+94.3%
Median per capita income in Shirley in 2022:
Shirley:
$41,112
State:
$60,804
Change in median per capita income between 2000 and 2022:
Shirley, Massachusetts:
+86.5%
State:
+118.7%
Income statistics for Black or African American residents
Median per capita income in Shirley in 2022:
Shirley:
$53,391
State:
$33,524
Change in median per capita income between 2000 and 2022:
Shirley, Massachusetts:
+98.1%
State:
+109.4%
Income statistics for Hispanic or Latino residents
Median per capita income in Shirley in 2022:
Shirley:
$47,502
State:
$28,993
Change in median per capita income between 2000 and 2022:
Shirley, Massachusetts:
+54.2%
State:
+142.4%
Discuss Shirley, Massachusetts (MA) on our hugely popular Massachusetts forum.