The median household income in Smith Mills, MA in 2022 was $74,233, which was 27.3% less than the median annual income of $94,488 across the entire state of Massachusetts. Compared to the median income of $41,272 in 2000 this represents an increase of 44.4%. The per capita income in 2022 was $38,978, which means an increase of 46.6% compared to 2000 when it was $20,820.
Whole page based on the data from 2000 / 2022 when the population of Smith Mills, Massachusetts was 4,432 / 4,583
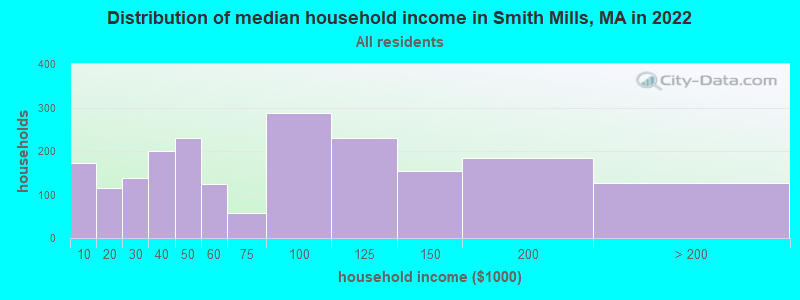
Income statistics for all residents
Median household income in Smith Mills, MA in 2022:
Smith Mills:
$74,233
State:
$94,488
Change in median household income between 2000 and 2022:
Smith Mills, Massachusetts:
+79.9%
State:
+87.1%
Number of households with income < $10k:
Smith Mills:
8.5% (172)
State:
5.2% (146,170)
Number of households with income $10k - 20k:
Smith Mills:
5.7% (114)
Massachusetts:
6.4% (180,001)
Number of households with income $20k - 30k:
Smith Mills:
6.9% (138)
Massachusetts:
5.6% (156,667)
Number of households with income $30k - 40k:
Smith Mills:
9.9% (200)
Massachusetts:
5.6% (157,168)
Number of households with income $40k - 50k:
Smith Mills:
11.4% (229)
Massachusetts:
5.4% (151,455)
Number of households with income $50k - 60k:
Smith Mills:
6.2% (124)
State:
5.1% (142,726)
Number of households with income $60k - 75k:
Smith Mills:
2.8% (57)
Massachusetts:
7.6% (212,203)
Number of households with income $75k - 100k:
Smith Mills:
14.3% (288)
State:
11.3% (317,064)
Number of households with income $100k - 125k:
Smith Mills:
11.4% (229)
Massachusetts:
9.7% (270,603)
Number of households with income $125k - 150k:
Smith Mills:
7.6% (153)
Massachusetts:
8.0% (223,140)
Number of households with income $150k - 200k:
Smith Mills:
9.1% (183)
State:
11.0% (308,695)
Number of households with income > $200k:
Smith Mills:
6.3% (126)
State:
19.0% (531,884)
Aggregate household income in Smith Mills in 2022: $172,059,370
Median family income in Smith Mills in 2022:
Smith Mills:
$99,086
State:
$120,263
Number of families with income < $10k:
Smith Mills:
7.3% (103)
State:
2.9% (49,671)
Number of families with income $10k - 20k:
Smith Mills:
1.6% (23)
State:
2.9% (50,542)
Number of families with income $20k - 30k:
Smith Mills:
6.3% (88)
State:
3.9% (66,398)
Number of families with income $30k - 40k:
Smith Mills:
7.7% (108)
State:
4.5% (78,234)
Number of families with income $40k - 50k:
Smith Mills:
9.1% (128)
State:
4.5% (77,656)
Number of families with income $50k - 60k:
Smith Mills:
2.6% (36)
State:
4.5% (77,928)
Number of families with income $60k - 75k:
Smith Mills:
1.1% (16)
State:
7.0% (120,295)
Number of families with income $75k - 100k:
Smith Mills:
20.2% (284)
State:
11.1% (192,172)
Number of families with income $100k - 125k:
Smith Mills:
13.2% (186)
State:
10.6% (182,105)
Number of families with income $125k - 150k:
Smith Mills:
11.2% (157)
Massachusetts:
9.3% (159,566)
Number of families with income $150k - 200k:
Smith Mills:
13.1% (184)
State:
13.4% (231,410)
Number of families with income > $200k:
Smith Mills:
6.7% (94)
Massachusetts:
25.4% (438,378)
Median non-family income in Smith Mills in 2022:
Smith Mills:
$39,545
State:
$55,979
Change in median non-family income between 2000 and 2022:
Smith Mills, Massachusetts:
+66.3%
State:
+88.0%
Median per capita income in Smith Mills in 2022:
Smith Mills:
$38,979
State:
$54,025
Change in median per capita income between 2000 and 2022:
Smith Mills, Massachusetts:
+87.2%
State:
+108.2%
Income statistics for White residents
Median household income in Smith Mills, MA in 2022:
Smith Mills:
$76,806
Massachusetts:
$101,391
Change in median household income between 2000 and 2022:
Smith Mills, Massachusetts:
+87.8%
Massachusetts:
+93.3%
Number of households with income < $10k:
Smith Mills:
10.2% (183)
Massachusetts:
4.4% (91,120)
Number of households with income $10k - 20k:
Smith Mills:
5.1% (91)
State:
5.9% (122,055)
Number of households with income $20k - 30k:
Smith Mills:
6.5% (116)
State:
5.1% (105,311)
Number of households with income $30k - 40k:
Smith Mills:
10.3% (184)
State:
5.3% (110,239)
Number of households with income $40k - 50k:
Smith Mills:
9.3% (166)
State:
5.0% (104,636)
Number of households with income $50k - 60k:
Smith Mills:
6.6% (118)
Massachusetts:
4.8% (99,486)
Number of households with income $60k - 75k:
Smith Mills:
1.7% (31)
State:
7.5% (155,124)
Number of households with income $75k - 100k:
Smith Mills:
14.1% (253)
State:
11.4% (236,252)
Number of households with income $100k - 125k:
Smith Mills:
12.2% (219)
State:
9.9% (204,731)
Number of households with income $125k - 150k:
Smith Mills:
8.3% (148)
State:
8.5% (175,324)
Number of households with income $150k - 200k:
Smith Mills:
9.9% (177)
Massachusetts:
11.7% (242,980)
Number of households with income > $200k:
Smith Mills:
5.9% (105)
State:
20.5% (425,966)
Aggregate household income in Smith Mills in 2022: $152,897,619
Median family income in Smith Mills in 2022:
Smith Mills:
$101,121
State:
$133,153
Number of families with income < $10k:
Smith Mills:
8.1% (100)
Massachusetts:
2.0% (25,038)
Number of families with income $10k - 20k:
Smith Mills:
1.9% (23)
State:
2.1% (26,403)
Number of families with income $20k - 30k:
Smith Mills:
5.1% (63)
State:
2.6% (32,525)
Number of families with income $30k - 40k:
Smith Mills:
7.9% (97)
Massachusetts:
3.9% (48,079)
Number of families with income $40k - 50k:
Smith Mills:
6.3% (77)
State:
3.8% (46,908)
Number of families with income $50k - 60k:
Smith Mills:
2.8% (35)
State:
3.8% (46,476)
Number of families with income $60k - 75k:
Smith Mills:
1.2% (15)
State:
6.4% (79,040)
Number of families with income $75k - 100k:
Smith Mills:
19.6% (241)
State:
11.1% (137,395)
Number of families with income $100k - 125k:
Smith Mills:
14.4% (177)
State:
11.1% (136,771)
Number of families with income $125k - 150k:
Smith Mills:
11.9% (146)
State:
10.0% (123,709)
Number of families with income $150k - 200k:
Smith Mills:
14.5% (178)
State:
14.7% (181,602)
Number of families with income > $200k:
Smith Mills:
6.1% (75)
State:
28.5% (351,887)
Median non-family income in Smith Mills in 2022:
Smith Mills:
$38,828
State:
$59,323
Change in median non-family income between 2000 and 2022:
Smith Mills, Massachusetts:
+65.7%
Massachusetts:
+94.3%
Median per capita income in Smith Mills in 2022:
Smith Mills:
$40,245
State:
$60,804
Change in median per capita income between 2000 and 2022:
Smith Mills, Massachusetts:
+92.7%
Massachusetts:
+118.7%
Income statistics for Asian residents
Number of households with income < $10k:
Smith Mills:
0.0% (0)
State:
6.8% (11,982)
Number of households with income $10k - 20k:
Smith Mills:
0.0% (0)
State:
4.8% (8,376)
Number of households with income $20k - 30k:
Smith Mills:
17.3% (13)
State:
3.7% (6,558)
Number of households with income $30k - 40k:
Smith Mills:
0.0% (0)
State:
3.3% (5,748)
Number of households with income $40k - 50k:
Smith Mills:
40.0% (30)
State:
4.1% (7,192)
Number of households with income $50k - 60k:
Smith Mills:
0.0% (0)
Massachusetts:
5.0% (8,734)
Number of households with income $60k - 75k:
Smith Mills:
0.0% (0)
Massachusetts:
5.8% (10,203)
Number of households with income $75k - 100k:
Smith Mills:
22.7% (17)
State:
8.6% (15,154)
Number of households with income $100k - 125k:
Smith Mills:
0.0% (0)
State:
10.8% (18,942)
Number of households with income $125k - 150k:
Smith Mills:
0.0% (0)
State:
8.0% (14,037)
Number of households with income $150k - 200k:
Smith Mills:
0.0% (0)
Massachusetts:
12.5% (21,856)
Number of households with income > $200k:
Smith Mills:
20.0% (15)
Massachusetts:
26.6% (46,694)
Aggregate household income in Smith Mills in 2022: $11,377,186
Median per capita income in Smith Mills in 2022:
Smith Mills:
$53,770
State:
$58,900
Change in median per capita income between 2000 and 2022:
Smith Mills, Massachusetts:
+124.0%
State:
+174.6%
Income statistics for Hispanic or Latino residents
Aggregate household income in Smith Mills in 2022: $7,161,569
Median per capita income in Smith Mills in 2022:
Smith Mills:
$3,351
State:
$28,993
Change in median per capita income between 2000 and 2022:: -75.6%
Smith Mills, Massachusetts:
-75.6%
State:
+142.4%
Income statistics for Multirace residents
Median household income in Smith Mills, MA in 2022:
Smith Mills:
$47,918
State:
$71,552
Number of households with income < $10k:
Smith Mills:
0.0% (0)
State:
6.6% (15,127)
Number of households with income $10k - 20k:
Smith Mills:
0.0% (0)
State:
9.2% (21,158)
Number of households with income $20k - 30k:
Smith Mills:
0.0% (0)
Massachusetts:
7.8% (18,016)
Number of households with income $30k - 40k:
Smith Mills:
10.5% (9)
State:
7.9% (18,260)
Number of households with income $40k - 50k:
Smith Mills:
34.9% (30)
State:
5.6% (13,027)
Number of households with income $50k - 60k:
Smith Mills:
0.0% (0)
Massachusetts:
5.6% (12,909)
Number of households with income $60k - 75k:
Smith Mills:
54.7% (47)
State:
9.0% (20,800)
Number of households with income $75k - 100k:
Smith Mills:
0.0% (0)
Massachusetts:
12.1% (27,875)
Number of households with income $100k - 125k:
Smith Mills:
0.0% (0)
Massachusetts:
8.1% (18,754)
Number of households with income $125k - 150k:
Smith Mills:
0.0% (0)
Massachusetts:
6.8% (15,621)
Number of households with income $150k - 200k:
Smith Mills:
0.0% (0)
Massachusetts:
9.4% (21,618)
Number of households with income > $200k:
Smith Mills:
0.0% (0)
State:
12.0% (27,592)
Aggregate household income in Smith Mills in 2022: $4,876,961
Median per capita income in Smith Mills in 2022:
Smith Mills:
$17,038
State:
$34,029
Change in median per capita income between 2000 and 2022:
Smith Mills, Massachusetts:
+49.3%
State:
+132.1%
Income statistics for other residents
Number of households with income < $10k:
Smith Mills:
0.0% (0)
State:
8.4% (11,559)
Number of households with income $10k - 20k:
Smith Mills:
100.0% (20)
Massachusetts:
8.4% (11,499)
Number of households with income $20k - 30k:
Smith Mills:
0.0% (0)
Massachusetts:
9.5% (13,070)
Number of households with income $30k - 40k:
Smith Mills:
0.0% (0)
Massachusetts:
6.0% (8,291)
Number of households with income $40k - 50k:
Smith Mills:
0.0% (0)
State:
9.2% (12,611)
Number of households with income $50k - 60k:
Smith Mills:
0.0% (0)
State:
7.9% (10,879)
Number of households with income $60k - 75k:
Smith Mills:
0.0% (0)
State:
7.5% (10,239)
Number of households with income $75k - 100k:
Smith Mills:
0.0% (0)
State:
13.1% (18,032)
Number of households with income $100k - 125k:
Smith Mills:
0.0% (0)
Massachusetts:
9.6% (13,141)
Number of households with income $125k - 150k:
Smith Mills:
0.0% (0)
Massachusetts:
5.0% (6,808)
Number of households with income $150k - 200k:
Smith Mills:
0.0% (0)
State:
6.4% (8,843)
Number of households with income > $200k:
Smith Mills:
0.0% (0)
State:
9.0% (12,396)
Aggregate household income in Smith Mills in 2022: $5,564,732
Median per capita income in Smith Mills in 2022:
Smith Mills:
$11,324
Massachusetts:
$30,797
Change in median per capita income between 2000 and 2022:: -42.2%
Smith Mills, Massachusetts:
-42.2%
State:
+188.5%
Discuss Smith Mills, Massachusetts (MA) on our hugely popular Massachusetts forum.