The median household income in South Toledo Bend, TX in 2022 was $62,104, which was 16.4% less than the median annual income of $72,284 across the entire state of Texas. Compared to the median income of $37,697 in 2000 this represents an increase of 39.3%. The per capita income in 2022 was $45,956, which means an increase of 56.0% compared to 2000 when it was $20,238.
Whole page based on the data from 2000 / 2022 when the population of South Toledo Bend, Texas was 576 / 382
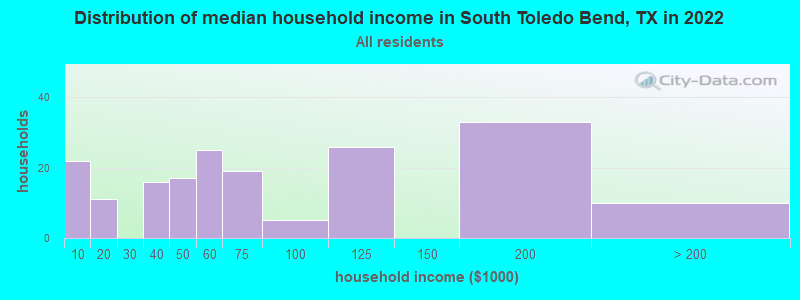
Income statistics for all residents
Median household income in South Toledo Bend, TX in 2022:
South Toledo Bend:
$62,105
Texas:
$72,284
Change in median household income between 2000 and 2022:
South Toledo Bend, Texas:
+64.7%
Texas:
+81.0%
Number of households with income < $10k:
South Toledo Bend:
12.0% (22)
Texas:
5.5% (611,011)
Number of households with income $10k - 20k:
South Toledo Bend:
6.0% (11)
State:
6.7% (743,157)
Number of households with income $20k - 30k:
South Toledo Bend:
0.0% (0)
State:
7.2% (803,381)
Number of households with income $30k - 40k:
South Toledo Bend:
8.7% (16)
Texas:
7.8% (866,080)
Number of households with income $40k - 50k:
South Toledo Bend:
9.2% (17)
Texas:
7.3% (810,440)
Number of households with income $50k - 60k:
South Toledo Bend:
13.6% (25)
Texas:
7.2% (799,783)
Number of households with income $60k - 75k:
South Toledo Bend:
10.3% (19)
State:
9.9% (1,095,384)
Number of households with income $75k - 100k:
South Toledo Bend:
2.7% (5)
State:
12.8% (1,419,057)
Number of households with income $100k - 125k:
South Toledo Bend:
14.1% (26)
Texas:
9.5% (1,054,577)
Number of households with income $125k - 150k:
South Toledo Bend:
0.0% (0)
Texas:
6.7% (741,518)
Number of households with income $150k - 200k:
South Toledo Bend:
17.9% (33)
State:
8.7% (961,776)
Number of households with income > $200k:
South Toledo Bend:
5.4% (10)
State:
10.7% (1,181,544)
Aggregate household income in South Toledo Bend in 2022: $17,618,205
Median per capita income in South Toledo Bend in 2022:
South Toledo Bend:
$45,956
State:
$38,123
Change in median per capita income between 2000 and 2022:
South Toledo Bend, Texas:
+127.1%
State:
+94.3%
Income statistics for White residents
Median household income in South Toledo Bend, TX in 2022:
South Toledo Bend:
$64,236
State:
$82,032
Change in median household income between 2000 and 2022:
South Toledo Bend, Texas:
+70.4%
Texas:
+91.0%
Number of households with income < $10k:
South Toledo Bend:
11.7% (18)
State:
4.7% (273,716)
Number of households with income $10k - 20k:
South Toledo Bend:
5.8% (9)
Texas:
5.5% (322,702)
Number of households with income $20k - 30k:
South Toledo Bend:
0.0% (0)
State:
6.2% (363,947)
Number of households with income $30k - 40k:
South Toledo Bend:
8.4% (13)
State:
6.8% (399,275)
Number of households with income $40k - 50k:
South Toledo Bend:
9.1% (14)
Texas:
6.5% (383,417)
Number of households with income $50k - 60k:
South Toledo Bend:
13.0% (20)
State:
6.6% (388,535)
Number of households with income $60k - 75k:
South Toledo Bend:
10.4% (16)
State:
9.7% (566,295)
Number of households with income $75k - 100k:
South Toledo Bend:
2.6% (4)
State:
13.0% (760,276)
Number of households with income $100k - 125k:
South Toledo Bend:
14.3% (22)
State:
10.2% (597,596)
Number of households with income $125k - 150k:
South Toledo Bend:
0.0% (0)
State:
7.4% (436,830)
Number of households with income $150k - 200k:
South Toledo Bend:
18.8% (29)
State:
9.9% (583,067)
Number of households with income > $200k:
South Toledo Bend:
5.8% (9)
State:
13.5% (792,647)
Aggregate household income in South Toledo Bend in 2022: $15,487,061
Median per capita income in South Toledo Bend in 2022:
South Toledo Bend:
$50,089
Texas:
$47,740
Change in median per capita income between 2000 and 2022:
South Toledo Bend, Texas:
+146.8%
State:
+114.3%
Discuss South Toledo Bend, Texas (TX) on our hugely popular Texas forum.