Southbridge, Massachusetts (MA) income map, earnings map, and wages data
The median household income in Southbridge, MA in 2022 was $57,197, which was 65.2% less than the median annual income of $94,488 across the entire state of Massachusetts. Compared to the median income of $31,745 in 2000 this represents an increase of 44.5%. The per capita income in 2022 was $33,349, which means an increase of 48.7% compared to 2000 when it was $17,104.
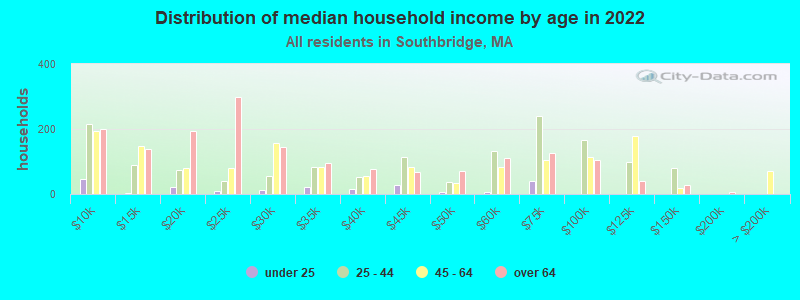
Income statistics for all residents
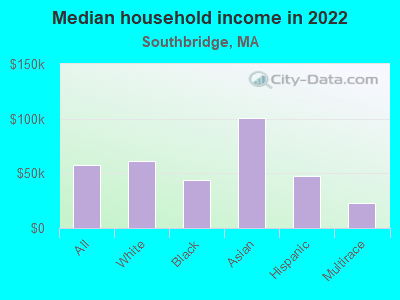
Median household income in Southbridge, MA in 2022:| Southbridge: | $57,197 |
| Massachusetts: | $94,488 |
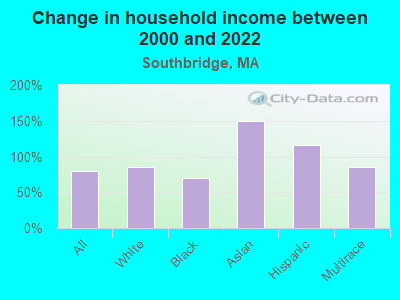
Change in median household income between 2000 and 2022:| Southbridge, Massachusetts: | +80.2% |
| State: | +87.1% |
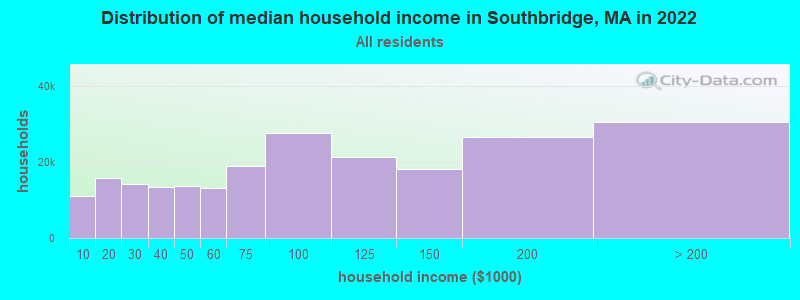
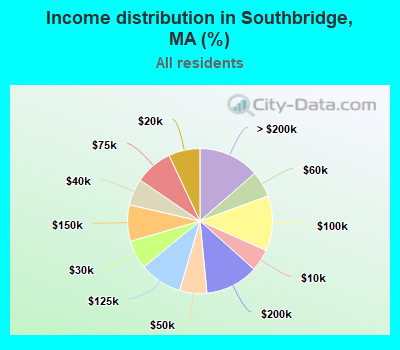
Number of households with income < $10k:| Southbridge: | 4.9% (11,003) |
| Massachusetts: | 5.2% (146,170) |
Number of households with income $10k - 20k:| Southbridge: | 7.0% (15,698) |
| State: | 6.4% (180,001) |
Number of households with income $20k - 30k:| Southbridge: | 6.4% (14,297) |
| Massachusetts: | 5.6% (156,667) |
Number of households with income $30k - 40k:| Southbridge: | 5.9% (13,307) |
| Massachusetts: | 5.6% (157,168) |
Number of households with income $40k - 50k:| Southbridge: | 6.1% (13,627) |
| State: | 5.4% (151,455) |
Number of households with income $50k - 60k:| Southbridge: | 5.8% (13,047) |
| State: | 5.1% (142,726) |
Number of households with income $60k - 75k:| Southbridge: | 8.4% (18,933) |
| State: | 7.6% (212,203) |
Number of households with income $75k - 100k:| Southbridge: | 12.3% (27,538) |
| State: | 11.3% (317,064) |
Number of households with income $100k - 125k:| Southbridge: | 9.5% (21,375) |
| State: | 9.7% (270,603) |
Number of households with income $125k - 150k:| Southbridge: | 8.1% (18,265) |
| State: | 8.0% (223,140) |
Number of households with income $150k - 200k:| Southbridge: | 11.9% (26,602) |
| State: | 11.0% (308,695) |
Number of households with income > $200k:| Southbridge: | 13.6% (30,492) |
| State: | 19.0% (531,884) |
Aggregate household income in Southbridge in 2022: $3,860,699,212
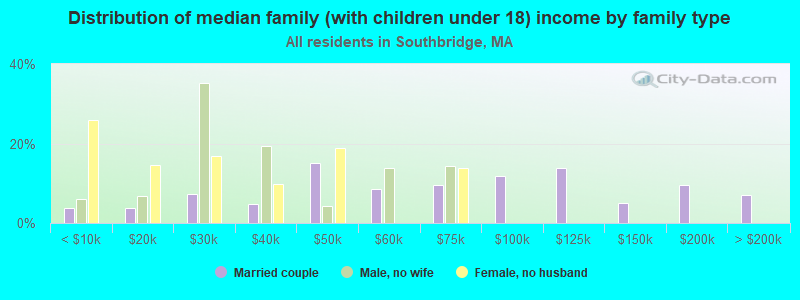
Median family income in Southbridge in 2022:| Southbridge: | $71,512 |
| State: | $120,263 |
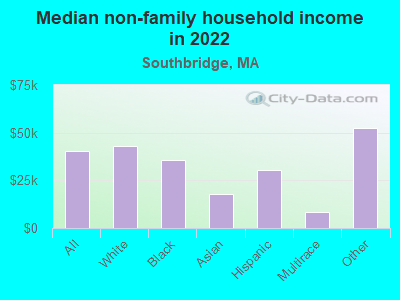
Median non-family income in Southbridge in 2022:| Southbridge: | $40,159 |
| State: | $55,979 |
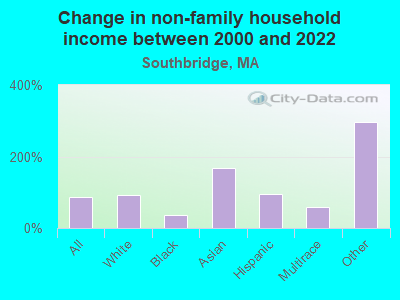
Change in median non-family income between 2000 and 2022:| Southbridge, Massachusetts: | +85.7% |
| State: | +88.0% |
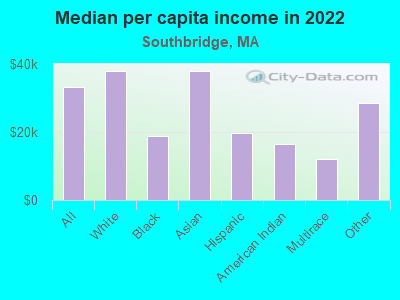
Median per capita income in Southbridge in 2022:| Southbridge: | $33,349 |
| State: | $54,025 |
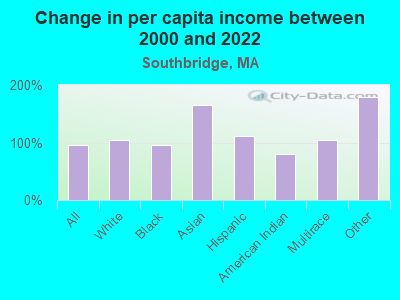
Change in median per capita income between 2000 and 2022:| Southbridge, Massachusetts: | +95.0% |
| Massachusetts: | +108.2% |
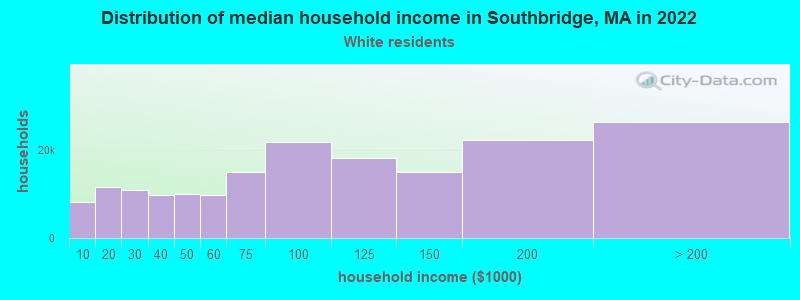
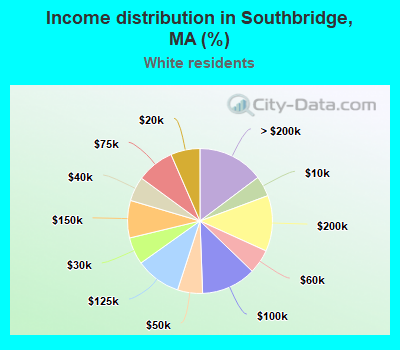
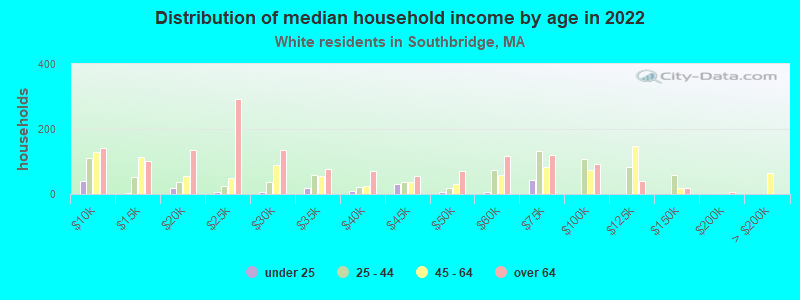
Income statistics for White residents
Median household income in Southbridge, MA in 2022:| Southbridge: | $61,049 |
| State: | $101,391 |
Change in median household income between 2000 and 2022:| Southbridge, Massachusetts: | +85.1% |
| Massachusetts: | +93.3% |
Number of households with income < $10k:| Southbridge: | 4.6% (8,154) |
| State: | 4.4% (91,120) |
Number of households with income $10k - 20k:| Southbridge: | 6.5% (11,660) |
| Massachusetts: | 5.9% (122,055) |
Number of households with income $20k - 30k:| Southbridge: | 6.1% (10,811) |
| Massachusetts: | 5.1% (105,311) |
Number of households with income $30k - 40k:| Southbridge: | 5.5% (9,755) |
| State: | 5.3% (110,239) |
Number of households with income $40k - 50k:| Southbridge: | 5.6% (9,989) |
| State: | 5.0% (104,636) |
Number of households with income $50k - 60k:| Southbridge: | 5.4% (9,686) |
| State: | 4.8% (99,486) |
Number of households with income $60k - 75k:| Southbridge: | 8.4% (15,000) |
| State: | 7.5% (155,124) |
Number of households with income $75k - 100k:| Southbridge: | 12.2% (21,799) |
| State: | 11.4% (236,252) |
Number of households with income $100k - 125k:| Southbridge: | 10.1% (18,115) |
| State: | 9.9% (204,731) |
Number of households with income $125k - 150k:| Southbridge: | 8.4% (14,939) |
| State: | 8.5% (175,324) |
Number of households with income $150k - 200k:| Southbridge: | 12.5% (22,256) |
| State: | 11.7% (242,980) |
Number of households with income > $200k:| Southbridge: | 14.7% (26,324) |
| Massachusetts: | 20.5% (425,966) |
Aggregate household income in Southbridge in 2022: $2,870,029,180
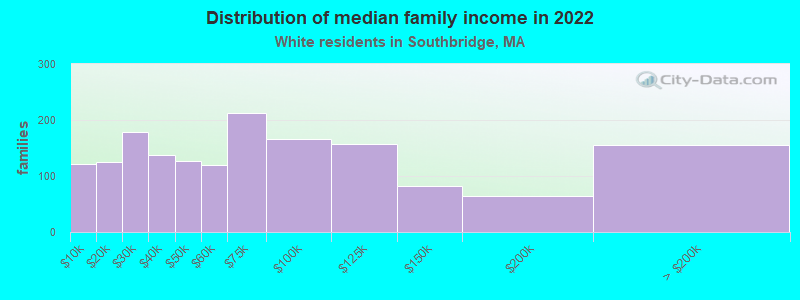
Median family income in Southbridge in 2022:| Southbridge: | $78,620 |
| Massachusetts: | $133,153 |
Number of families with income < $10k:| Southbridge: | 7.3% (121) |
| Massachusetts: | 2.0% (25,038) |
Number of families with income $10k - 20k:| Southbridge: | 7.6% (125) |
| State: | 2.1% (26,403) |
Number of families with income $20k - 30k:| Southbridge: | 10.9% (179) |
| State: | 2.6% (32,525) |
Number of families with income $30k - 40k:| Southbridge: | 8.4% (138) |
| State: | 3.9% (48,079) |
Number of families with income $40k - 50k:| Southbridge: | 7.6% (126) |
| State: | 3.8% (46,908) |
Number of families with income $50k - 60k:| Southbridge: | 7.2% (119) |
| Massachusetts: | 3.8% (46,476) |
Number of families with income $60k - 75k:| Southbridge: | 12.9% (212) |
| State: | 6.4% (79,040) |
Number of families with income $75k - 100k:| Southbridge: | 10.1% (166) |
| State: | 11.1% (137,395) |
Number of families with income $100k - 125k:| Southbridge: | 9.6% (158) |
| State: | 11.1% (136,771) |
Number of families with income $125k - 150k:| Southbridge: | 5.0% (82) |
| State: | 10.0% (123,709) |
Number of families with income $150k - 200k:| Southbridge: | 3.9% (64) |
| Massachusetts: | 14.7% (181,602) |
Number of families with income > $200k:| Southbridge: | 9.5% (156) |
| State: | 28.5% (351,887) |
Median non-family income in Southbridge in 2022:| Southbridge: | $43,047 |
| State: | $59,323 |
Change in median non-family income between 2000 and 2022:| Southbridge, Massachusetts: | +92.0% |
| Massachusetts: | +94.3% |
Median per capita income in Southbridge in 2022:| Southbridge: | $38,010 |
| State: | $60,804 |
Change in median per capita income between 2000 and 2022:| Southbridge, Massachusetts: | +105.3% |
| State: | +118.7% |
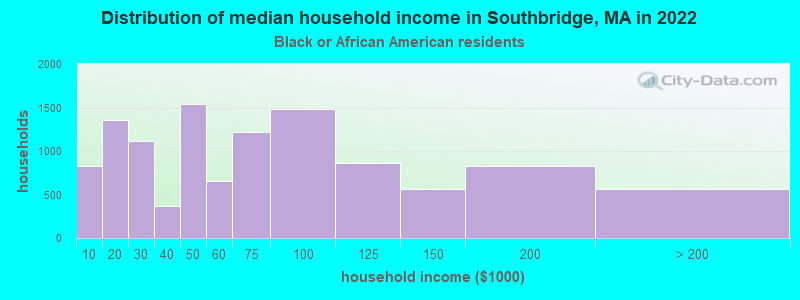
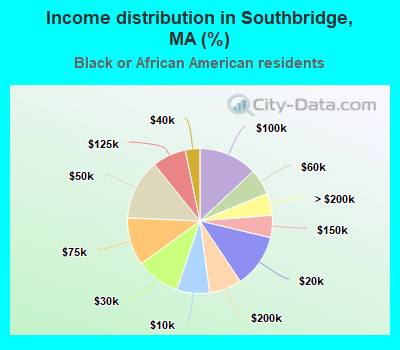
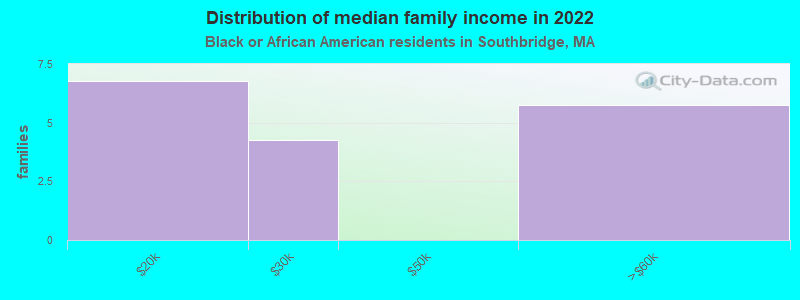
Income statistics for Black or African American residents
Median household income in Southbridge, MA in 2022:| Southbridge: | $43,800 |
| Massachusetts: | $63,189 |
Change in median household income between 2000 and 2022:| Southbridge, Massachusetts: | +69.8% |
| State: | +87.4% |
Number of households with income < $10k:| Southbridge: | 7.3% (831) |
| State: | 9.1% (15,797) |
Number of households with income $10k - 20k:| Southbridge: | 11.9% (1,358) |
| State: | 9.4% (16,267) |
Number of households with income $20k - 30k:| Southbridge: | 9.8% (1,118) |
| State: | 7.8% (13,520) |
Number of households with income $30k - 40k:| Southbridge: | 3.3% (371) |
| State: | 8.3% (14,412) |
Number of households with income $40k - 50k:| Southbridge: | 13.5% (1,538) |
| State: | 7.9% (13,790) |
Number of households with income $50k - 60k:| Southbridge: | 5.8% (658) |
| State: | 5.8% (10,041) |
Number of households with income $60k - 75k:| Southbridge: | 10.7% (1,223) |
| State: | 8.5% (14,822) |
Number of households with income $75k - 100k:| Southbridge: | 13.0% (1,486) |
| State: | 11.0% (19,122) |
Number of households with income $100k - 125k:| Southbridge: | 7.5% (858) |
| Massachusetts: | 8.4% (14,575) |
Number of households with income $125k - 150k:| Southbridge: | 5.0% (567) |
| State: | 6.0% (10,429) |
Number of households with income $150k - 200k:| Southbridge: | 7.2% (826) |
| Massachusetts: | 7.2% (12,539) |
Number of households with income > $200k:| Southbridge: | 4.9% (563) |
| State: | 10.5% (18,185) |
Aggregate household income in Southbridge in 2022: $3,037,895
Median family income in Southbridge in 2022:| Southbridge: | $35,276 |
| State: | $79,815 |
Number of families with income $10k - 20k:| Southbridge: | 40.4% (7) |
| State: | 6.8% (7,412) |
Number of families with income $20k - 30k:| Southbridge: | 25.3% (4) |
| State: | 6.6% (7,274) |
Number of families with income $50k - 60k:| Southbridge: | 34.3% (6) |
| State: | 6.4% (6,986) |
Median non-family income in Southbridge in 2022:| Southbridge: | $35,794 |
| Massachusetts: | $38,934 |
Change in median non-family income between 2000 and 2022:| Southbridge, Massachusetts: | +36.4% |
| Massachusetts: | +69.2% |
Median per capita income in Southbridge in 2022:| Southbridge: | $18,678 |
| State: | $33,524 |
Change in median per capita income between 2000 and 2022:| Southbridge, Massachusetts: | +95.7% |
| State: | +109.4% |
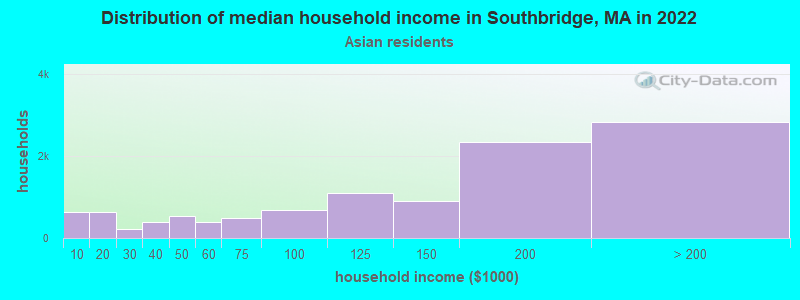
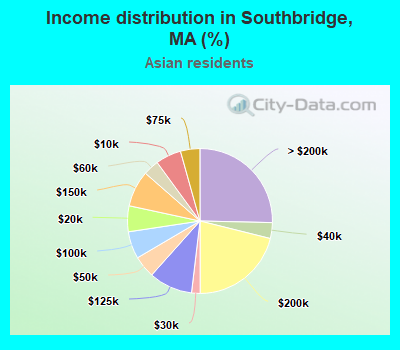
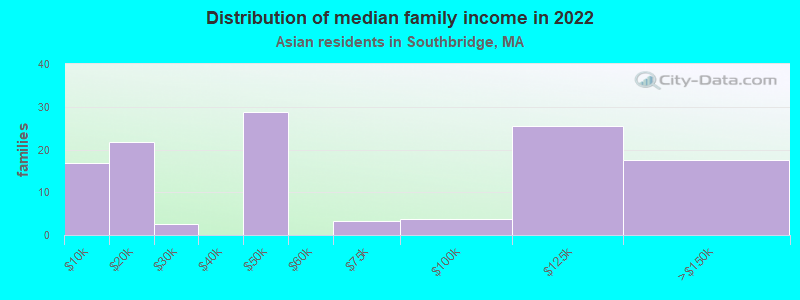
Income statistics for Asian residents
Median household income in Southbridge, MA in 2022:| Southbridge: | $100,515 |
| State: | $117,855 |
Change in median household income between 2000 and 2022:| Southbridge, Massachusetts: | +149.6% |
| Massachusetts: | +129.9% |
Number of households with income < $10k:| Southbridge: | 5.7% (637) |
| Massachusetts: | 6.8% (11,982) |
Number of households with income $10k - 20k:| Southbridge: | 5.8% (640) |
| State: | 4.8% (8,376) |
Number of households with income $20k - 30k:| Southbridge: | 1.9% (211) |
| State: | 3.7% (6,558) |
Number of households with income $30k - 40k:| Southbridge: | 3.5% (394) |
| State: | 3.3% (5,748) |
Number of households with income $40k - 50k:| Southbridge: | 4.9% (547) |
| State: | 4.1% (7,192) |
Number of households with income $50k - 60k:| Southbridge: | 3.5% (389) |
| State: | 5.0% (8,734) |
Number of households with income $60k - 75k:| Southbridge: | 4.3% (482) |
| State: | 5.8% (10,203) |
Number of households with income $75k - 100k:| Southbridge: | 6.1% (678) |
| State: | 8.6% (15,154) |
Number of households with income $100k - 125k:| Southbridge: | 9.7% (1,084) |
| Massachusetts: | 10.8% (18,942) |
Number of households with income $125k - 150k:| Southbridge: | 8.1% (898) |
| State: | 8.0% (14,037) |
Number of households with income $150k - 200k:| Southbridge: | 21.1% (2,345) |
| State: | 12.5% (21,856) |
Number of households with income > $200k:| Southbridge: | 25.4% (2,822) |
| Massachusetts: | 26.6% (46,694) |
Aggregate household income in Southbridge in 2022: $26,482,856
Median family income in Southbridge in 2022:| Southbridge: | $110,062 |
| State: | $140,113 |
Number of families with income < $10k:| Southbridge: | 14.1% (17) |
| Massachusetts: | 3.2% (3,752) |
Number of families with income $10k - 20k:| Southbridge: | 18.1% (22) |
| Massachusetts: | 3.5% (4,118) |
Number of families with income $20k - 30k:| Southbridge: | 2.2% (3) |
| Massachusetts: | 2.3% (2,708) |
Number of families with income $40k - 50k:| Southbridge: | 23.9% (29) |
| Massachusetts: | 3.9% (4,621) |
Number of families with income $60k - 75k:| Southbridge: | 2.6% (3) |
| State: | 6.1% (7,105) |
Number of families with income $75k - 100k:| Southbridge: | 3.2% (4) |
| State: | 8.5% (10,022) |
Number of families with income $100k - 125k:| Southbridge: | 21.2% (25) |
| State: | 10.0% (11,697) |
Number of families with income $125k - 150k:| Southbridge: | 14.7% (18) |
| State: | 8.6% (10,071) |
Median non-family income in Southbridge in 2022:| Southbridge: | $17,982 |
| Massachusetts: | $71,440 |
Median per capita income in Southbridge in 2022:| Southbridge: | $37,987 |
| Massachusetts: | $58,900 |
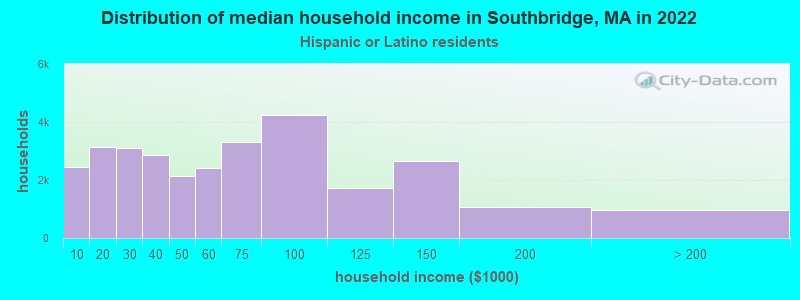
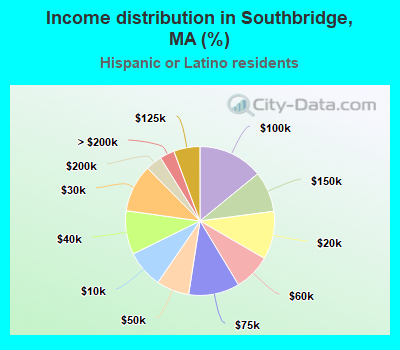
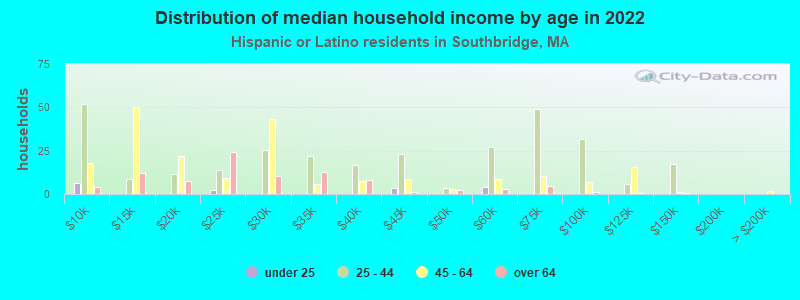
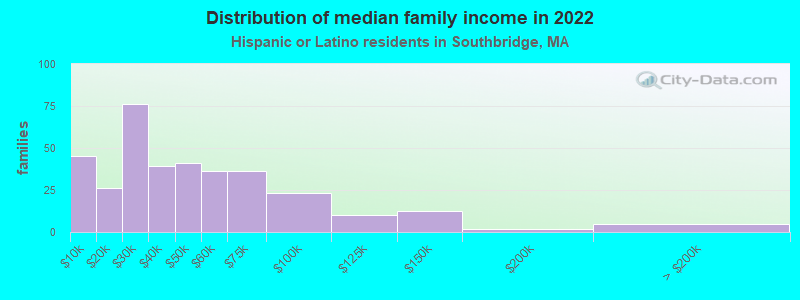
Income statistics for Hispanic or Latino residents
Median household income in Southbridge, MA in 2022:| Southbridge: | $47,689 |
| Massachusetts: | $61,523 |
Change in median household income between 2000 and 2022:| Southbridge, Massachusetts: | +116.0% |
| State: | +125.4% |
Number of households with income < $10k:| Southbridge: | 8.1% (2,441) |
| State: | 8.8% (25,307) |
Number of households with income $10k - 20k:| Southbridge: | 10.5% (3,139) |
| State: | 10.0% (28,653) |
Number of households with income $20k - 30k:| Southbridge: | 10.3% (3,104) |
| State: | 8.8% (25,189) |
Number of households with income $30k - 40k:| Southbridge: | 9.5% (2,855) |
| Massachusetts: | 7.2% (20,822) |
Number of households with income $40k - 50k:| Southbridge: | 7.1% (2,135) |
| Massachusetts: | 7.2% (20,817) |
Number of households with income $50k - 60k:| Southbridge: | 8.0% (2,398) |
| State: | 6.5% (18,748) |
Number of households with income $60k - 75k:| Southbridge: | 11.1% (3,323) |
| State: | 8.8% (25,390) |
Number of households with income $75k - 100k:| Southbridge: | 14.1% (4,228) |
| Massachusetts: | 12.0% (34,488) |
Number of households with income $100k - 125k:| Southbridge: | 5.7% (1,707) |
| State: | 8.6% (24,599) |
Number of households with income $125k - 150k:| Southbridge: | 8.8% (2,651) |
| Massachusetts: | 6.2% (17,743) |
Number of households with income $150k - 200k:| Southbridge: | 3.6% (1,066) |
| Massachusetts: | 7.3% (21,017) |
Number of households with income > $200k:| Southbridge: | 3.2% (956) |
| Massachusetts: | 8.6% (24,606) |
Aggregate household income in Southbridge in 2022: $116,302,669
Median family income in Southbridge in 2022:| Southbridge: | $47,260 |
| Massachusetts: | $66,072 |
Number of families with income < $10k:| Southbridge: | 12.8% (45) |
| State: | 6.2% (12,456) |
Number of families with income $10k - 20k:| Southbridge: | 7.4% (26) |
| State: | 6.0% (12,071) |
Number of families with income $20k - 30k:| Southbridge: | 21.6% (76) |
| Massachusetts: | 10.1% (20,376) |
Number of families with income $30k - 40k:| Southbridge: | 11.2% (39) |
| State: | 8.2% (16,470) |
Number of families with income $40k - 50k:| Southbridge: | 11.7% (41) |
| State: | 7.4% (14,829) |
Number of families with income $50k - 60k:| Southbridge: | 10.4% (37) |
| Massachusetts: | 7.3% (14,643) |
Number of families with income $60k - 75k:| Southbridge: | 10.3% (36) |
| State: | 10.6% (21,252) |
Number of families with income $75k - 100k:| Southbridge: | 6.5% (23) |
| Massachusetts: | 12.0% (24,088) |
Number of families with income $100k - 125k:| Southbridge: | 2.9% (10) |
| State: | 8.9% (17,954) |
Number of families with income $125k - 150k:| Southbridge: | 3.5% (12) |
| State: | 6.9% (13,837) |
Number of families with income $150k - 200k:| Southbridge: | 0.6% (2) |
| State: | 7.3% (14,683) |
Number of families with income > $200k:| Southbridge: | 1.3% (4) |
| State: | 9.3% (18,741) |
Median non-family income in Southbridge in 2022:| Southbridge: | $30,603 |
| Massachusetts: | $37,563 |
Change in median non-family income between 2000 and 2022:| Southbridge, Massachusetts: | +95.9% |
| State: | +115.0% |
Median per capita income in Southbridge in 2022:| Southbridge: | $19,726 |
| State: | $28,993 |
Change in median per capita income between 2000 and 2022:| Southbridge, Massachusetts: | +110.9% |
| Massachusetts: | +142.4% |
Income statistics for American Indian and Alaska Native residents
Number of households with income < $10k:| Southbridge: | 6.6% (260) |
| State: | 6.6% (451) |
Number of households with income $10k - 20k:| Southbridge: | 7.0% (275) |
| Massachusetts: | 7.0% (476) |
Number of households with income $20k - 30k:| Southbridge: | 2.8% (110) |
| Massachusetts: | 2.8% (192) |
Number of households with income $30k - 40k:| Southbridge: | 3.2% (126) |
| Massachusetts: | 3.2% (218) |
Number of households with income $40k - 50k:| Southbridge: | 2.9% (115) |
| State: | 2.9% (199) |
Number of households with income $50k - 60k:| Southbridge: | 9.9% (390) |
| State: | 9.9% (677) |
Number of households with income $60k - 75k:| Southbridge: | 11.5% (450) |
| Massachusetts: | 11.5% (781) |
Number of households with income $75k - 100k:| Southbridge: | 9.2% (363) |
| State: | 9.2% (629) |
Number of households with income $100k - 125k:| Southbridge: | 6.0% (234) |
| State: | 6.0% (406) |
Number of households with income $125k - 150k:| Southbridge: | 13.5% (531) |
| Massachusetts: | 13.5% (921) |
Number of households with income $150k - 200k:| Southbridge: | 12.6% (495) |
| State: | 12.6% (859) |
Number of households with income > $200k:| Southbridge: | 14.7% (578) |
| Massachusetts: | 14.7% (1,003) |
Median per capita income in Southbridge in 2022:| Southbridge: | $16,493 |
| Massachusetts: | $39,434 |
Change in median per capita income between 2000 and 2022:| Southbridge, Massachusetts: | +80.0% |
| Massachusetts: | +148.2% |
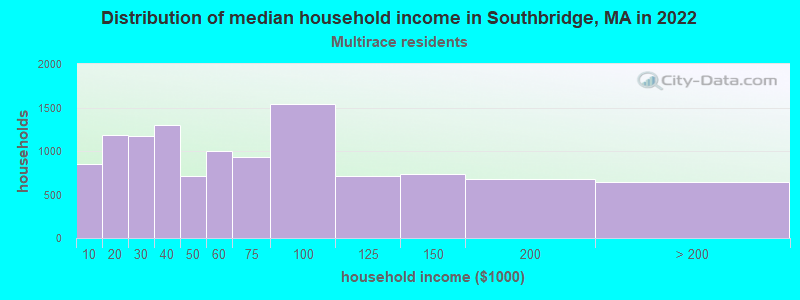
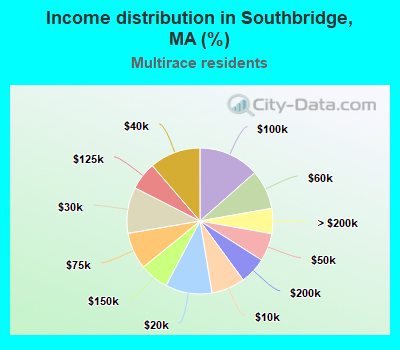
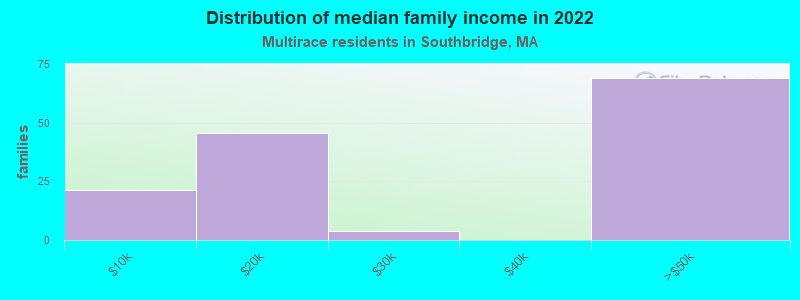
Income statistics for Multirace residents
Median household income in Southbridge, MA in 2022:| Southbridge: | $22,860 |
| State: | $71,552 |
Change in median household income between 2000 and 2022:| Southbridge, Massachusetts: | +84.7% |
| State: | +109.0% |
Number of households with income < $10k:| Southbridge: | 7.4% (851) |
| State: | 6.6% (15,127) |
Number of households with income $10k - 20k:| Southbridge: | 10.3% (1,183) |
| State: | 9.2% (21,158) |
Number of households with income $20k - 30k:| Southbridge: | 10.2% (1,169) |
| State: | 7.8% (18,016) |
Number of households with income $30k - 40k:| Southbridge: | 11.3% (1,294) |
| Massachusetts: | 7.9% (18,260) |
Number of households with income $40k - 50k:| Southbridge: | 6.2% (710) |
| Massachusetts: | 5.6% (13,027) |
Number of households with income $50k - 60k:| Southbridge: | 8.7% (1,000) |
| State: | 5.6% (12,909) |
Number of households with income $60k - 75k:| Southbridge: | 8.2% (935) |
| State: | 9.0% (20,800) |
Number of households with income $75k - 100k:| Southbridge: | 13.5% (1,545) |
| Massachusetts: | 12.1% (27,875) |
Number of households with income $100k - 125k:| Southbridge: | 6.2% (707) |
| Massachusetts: | 8.1% (18,754) |
Number of households with income $125k - 150k:| Southbridge: | 6.4% (736) |
| State: | 6.8% (15,621) |
Number of households with income $150k - 200k:| Southbridge: | 5.9% (679) |
| State: | 9.4% (21,618) |
Number of households with income > $200k:| Southbridge: | 5.6% (638) |
| State: | 12.0% (27,592) |
Aggregate household income in Southbridge in 2022: $16,826,010
Median family income in Southbridge in 2022:| Southbridge: | $33,550 |
| Massachusetts: | $78,380 |
Number of families with income < $10k:| Southbridge: | 15.3% (21) |
| State: | 4.5% (7,017) |
Number of families with income $10k - 20k:| Southbridge: | 32.7% (46) |
| State: | 4.9% (7,678) |
Number of families with income $20k - 30k:| Southbridge: | 2.6% (4) |
| State: | 8.5% (13,245) |
Number of families with income $40k - 50k:| Southbridge: | 49.3% (69) |
| State: | 5.3% (8,255) |
Median non-family income in Southbridge in 2022:| Southbridge: | $8,332 |
| Massachusetts: | $42,253 |
Change in median non-family income between 2000 and 2022:| Southbridge, Massachusetts: | +60.0% |
| State: | +93.7% |
Median per capita income in Southbridge in 2022:| Southbridge: | $12,167 |
| State: | $34,029 |
Change in median per capita income between 2000 and 2022:| Southbridge, Massachusetts: | +104.0% |
| Massachusetts: | +132.1% |
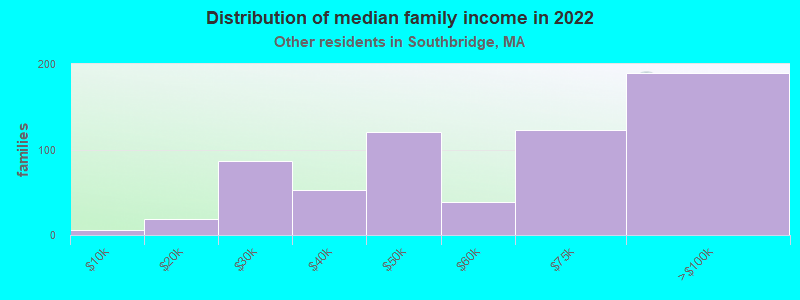
Income statistics for other residents
Number of households with income < $10k:| Southbridge: | 2.5% (21) |
| State: | 8.4% (11,559) |
Number of households with income $10k - 20k:| Southbridge: | 5.7% (47) |
| State: | 8.4% (11,499) |
Number of households with income $20k - 30k:| Southbridge: | 6.3% (52) |
| State: | 9.5% (13,070) |
Number of households with income $30k - 40k:| Southbridge: | 10.5% (87) |
| State: | 6.0% (8,291) |
Number of households with income $40k - 50k:| Southbridge: | 9.1% (75) |
| State: | 9.2% (12,611) |
Number of households with income $50k - 60k:| Southbridge: | 9.1% (75) |
| State: | 7.9% (10,879) |
Number of households with income $60k - 75k:| Southbridge: | 11.0% (91) |
| State: | 7.5% (10,239) |
Number of households with income $75k - 100k:| Southbridge: | 18.6% (154) |
| State: | 13.1% (18,032) |
Number of households with income $100k - 125k:| Southbridge: | 6.5% (54) |
| State: | 9.6% (13,141) |
Number of households with income $125k - 150k:| Southbridge: | 8.3% (69) |
| State: | 5.0% (6,808) |
Number of households with income $150k - 200k:| Southbridge: | 8.0% (66) |
| State: | 6.4% (8,843) |
Number of households with income > $200k:| Southbridge: | 4.5% (37) |
| State: | 9.0% (12,396) |
Aggregate household income in Southbridge in 2022: $69,848,362
Median family income in Southbridge in 2022:| Southbridge: | $65,677 |
| State: | $66,840 |
Number of families with income < $10k:| Southbridge: | 1.0% (6) |
| State: | 6.7% (6,769) |
Number of families with income $10k - 20k:| Southbridge: | 3.0% (19) |
| Massachusetts: | 4.7% (4,798) |
Number of families with income $20k - 30k:| Southbridge: | 13.6% (86) |
| State: | 10.4% (10,595) |
Number of families with income $30k - 40k:| Southbridge: | 8.3% (53) |
| State: | 7.0% (7,154) |
Number of families with income $40k - 50k:| Southbridge: | 18.8% (120) |
| Massachusetts: | 8.9% (9,052) |
Number of families with income $50k - 60k:| Southbridge: | 6.2% (39) |
| Massachusetts: | 8.7% (8,850) |
Number of families with income $60k - 75k:| Southbridge: | 19.3% (122) |
| State: | 8.5% (8,683) |
Number of families with income $75k - 100k:| Southbridge: | 29.8% (190) |
| State: | 12.8% (12,997) |
Median non-family income in Southbridge in 2022:| Southbridge: | $52,670 |
| State: | $36,127 |
Median per capita income in Southbridge in 2022:| Southbridge: | $28,433 |
| State: | $30,797 |