The median household income in Sutter Creek, CA in 2022 was $58,800, which was 55.7% less than the median annual income of $91,551 across the entire state of California. Compared to the median income of $47,000 in 2000 this represents an increase of 20.1%. The per capita income in 2022 was $41,537, which means an increase of 44.4% compared to 2000 when it was $23,100.
Whole page based on the data from 2000 / 2022 when the population of Sutter Creek, California was 2,303 / 2,637
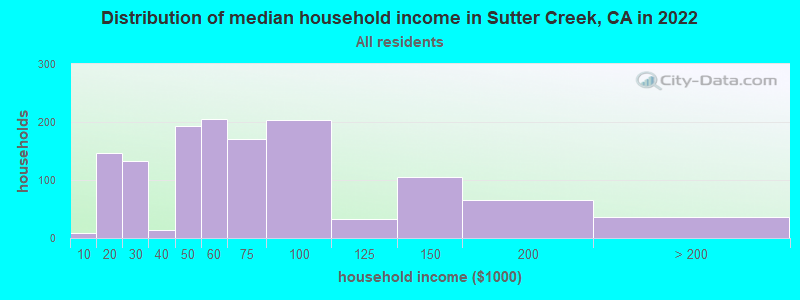
Income statistics for all residents
Median household income in Sutter Creek, CA in 2022:
Sutter Creek:
$58,801
State:
$91,551
Change in median household income between 2000 and 2022:
Sutter Creek, California:
+25.1%
California:
+92.8%
Number of households with income < $10k:
Sutter Creek:
0.6% (8)
California:
4.8% (654,370)
Number of households with income $10k - 20k:
Sutter Creek:
11.2% (147)
California:
5.8% (789,493)
Number of households with income $20k - 30k:
Sutter Creek:
10.1% (133)
State:
5.7% (778,318)
Number of households with income $30k - 40k:
Sutter Creek:
1.0% (13)
State:
5.8% (783,170)
Number of households with income $40k - 50k:
Sutter Creek:
14.7% (193)
State:
5.8% (781,352)
Number of households with income $50k - 60k:
Sutter Creek:
15.6% (205)
State:
5.6% (760,175)
Number of households with income $60k - 75k:
Sutter Creek:
13.0% (170)
California:
8.2% (1,104,699)
Number of households with income $75k - 100k:
Sutter Creek:
15.5% (203)
State:
12.0% (1,627,633)
Number of households with income $100k - 125k:
Sutter Creek:
2.5% (33)
State:
10.0% (1,358,619)
Number of households with income $125k - 150k:
Sutter Creek:
8.0% (105)
State:
7.6% (1,027,455)
Number of households with income $150k - 200k:
Sutter Creek:
5.0% (66)
State:
10.6% (1,439,811)
Number of households with income > $200k:
Sutter Creek:
2.7% (36)
California:
18.0% (2,445,491)
Aggregate household income in Sutter Creek in 2022: $102,248,488
Median family income in Sutter Creek in 2022:
Sutter Creek:
$63,880
State:
$104,823
Number of families with income $10k - 20k:
Sutter Creek:
6.6% (43)
State:
3.5% (322,064)
Number of families with income $20k - 30k:
Sutter Creek:
6.0% (39)
State:
4.7% (433,722)
Number of families with income $40k - 50k:
Sutter Creek:
4.8% (31)
State:
5.6% (511,647)
Number of families with income $50k - 60k:
Sutter Creek:
13.4% (87)
California:
5.5% (498,926)
Number of families with income $60k - 75k:
Sutter Creek:
21.9% (142)
State:
8.0% (731,094)
Number of families with income $75k - 100k:
Sutter Creek:
16.8% (109)
California:
12.2% (1,115,621)
Number of families with income $100k - 125k:
Sutter Creek:
1.7% (11)
California:
10.5% (959,600)
Number of families with income $125k - 150k:
Sutter Creek:
16.2% (105)
State:
8.4% (768,725)
Number of families with income $150k - 200k:
Sutter Creek:
9.7% (63)
State:
11.9% (1,087,239)
Number of families with income > $200k:
Sutter Creek:
3.0% (19)
State:
21.5% (1,963,769)
Median non-family income in Sutter Creek in 2022:
Sutter Creek:
$44,610
California:
$59,348
Change in median non-family income between 2000 and 2022:
Sutter Creek, California:
+100.6%
State:
+85.3%
Median per capita income in Sutter Creek in 2022:
Sutter Creek:
$41,538
State:
$46,661
Change in median per capita income between 2000 and 2022:
Sutter Creek, California:
+79.8%
State:
+105.5%
Income statistics for White residents
Median household income in Sutter Creek, CA in 2022:
Sutter Creek:
$60,733
State:
$100,917
Change in median household income between 2000 and 2022:
Sutter Creek, California:
+29.7%
California:
+96.8%
Number of households with income < $10k:
Sutter Creek:
0.7% (7)
State:
4.4% (284,109)
Number of households with income $10k - 20k:
Sutter Creek:
11.9% (124)
State:
5.3% (340,330)
Number of households with income $20k - 30k:
Sutter Creek:
10.7% (112)
State:
5.3% (343,145)
Number of households with income $30k - 40k:
Sutter Creek:
0.0% (0)
California:
5.1% (330,146)
Number of households with income $40k - 50k:
Sutter Creek:
14.8% (154)
California:
5.2% (335,310)
Number of households with income $50k - 60k:
Sutter Creek:
14.3% (149)
State:
5.1% (326,299)
Number of households with income $60k - 75k:
Sutter Creek:
13.6% (142)
California:
7.6% (487,640)
Number of households with income $75k - 100k:
Sutter Creek:
16.3% (170)
State:
11.5% (736,578)
Number of households with income $100k - 125k:
Sutter Creek:
2.2% (23)
State:
10.1% (648,782)
Number of households with income $125k - 150k:
Sutter Creek:
7.4% (77)
California:
7.8% (499,671)
Number of households with income $150k - 200k:
Sutter Creek:
5.0% (52)
California:
11.4% (729,603)
Number of households with income > $200k:
Sutter Creek:
3.2% (33)
State:
21.2% (1,364,246)
Aggregate household income in Sutter Creek in 2022: $85,041,741
Median family income in Sutter Creek in 2022:
Sutter Creek:
$68,596
California:
$125,379
Number of families with income $10k - 20k:
Sutter Creek:
6.7% (32)
State:
2.5% (97,716)
Number of families with income $20k - 30k:
Sutter Creek:
5.9% (28)
State:
3.5% (137,295)
Number of families with income $40k - 50k:
Sutter Creek:
4.8% (23)
California:
4.3% (169,197)
Number of families with income $50k - 60k:
Sutter Creek:
10.3% (49)
State:
4.5% (176,192)
Number of families with income $60k - 75k:
Sutter Creek:
23.3% (111)
California:
7.0% (274,752)
Number of families with income $75k - 100k:
Sutter Creek:
18.2% (87)
State:
11.3% (445,632)
Number of families with income $100k - 125k:
Sutter Creek:
1.0% (5)
California:
10.7% (423,630)
Number of families with income $125k - 150k:
Sutter Creek:
15.9% (76)
State:
9.1% (357,408)
Number of families with income $150k - 200k:
Sutter Creek:
10.2% (49)
State:
13.5% (532,693)
Number of families with income > $200k:
Sutter Creek:
3.7% (18)
State:
27.6% (1,086,948)
Median non-family income in Sutter Creek in 2022:
Sutter Creek:
$44,987
California:
$62,819
Change in median non-family income between 2000 and 2022:
Sutter Creek, California:
+103.4%
California:
+84.4%
Median per capita income in Sutter Creek in 2022:
Sutter Creek:
$48,384
State:
$61,706
Change in median per capita income between 2000 and 2022:
Sutter Creek, California:
+99.4%
California:
+122.7%
Income statistics for Asian residents
Aggregate household income in Sutter Creek in 2022: $837,245
Median per capita income in Sutter Creek in 2022:
Sutter Creek:
$83,902
State:
$58,824
Income statistics for Hispanic or Latino residents
Median per capita income in Sutter Creek in 2022:
Sutter Creek:
$43,879
State:
$27,240
Income statistics for American Indian and Alaska Native residents
Median per capita income in Sutter Creek in 2022:
Sutter Creek:
$9,293
State:
$30,289
Change in median per capita income between 2000 and 2022:: -49.6%
Sutter Creek, California:
-49.6%
State:
+98.9%
Income statistics for Multirace residents
Number of households with income < $10k:
Sutter Creek:
0.0% (0)
State:
4.2% (85,299)
Number of households with income $10k - 20k:
Sutter Creek:
0.0% (0)
State:
6.1% (122,966)
Number of households with income $20k - 30k:
Sutter Creek:
0.0% (0)
State:
6.4% (129,328)
Number of households with income $30k - 40k:
Sutter Creek:
15.6% (12)
California:
6.4% (130,070)
Number of households with income $40k - 50k:
Sutter Creek:
0.0% (0)
State:
6.5% (131,254)
Number of households with income $50k - 60k:
Sutter Creek:
41.6% (32)
State:
6.5% (132,382)
Number of households with income $60k - 75k:
Sutter Creek:
0.0% (0)
State:
9.4% (191,472)
Number of households with income $75k - 100k:
Sutter Creek:
0.0% (0)
California:
13.3% (269,691)
Number of households with income $100k - 125k:
Sutter Creek:
0.0% (0)
State:
10.2% (207,286)
Number of households with income $125k - 150k:
Sutter Creek:
29.9% (23)
State:
7.8% (158,259)
Number of households with income $150k - 200k:
Sutter Creek:
13.0% (10)
State:
10.3% (209,227)
Number of households with income > $200k:
Sutter Creek:
0.0% (0)
California:
13.0% (263,210)
Aggregate household income in Sutter Creek in 2022: $7,509,721
Median per capita income in Sutter Creek in 2022:
Sutter Creek:
$24,428
State:
$32,124
Change in median per capita income between 2000 and 2022:
Sutter Creek, California:
+90.1%
California:
+120.4%
Income statistics for other residents
Median per capita income in Sutter Creek in 2022:
Sutter Creek:
$30,439
State:
$25,164
Discuss Sutter Creek, California (CA) on our hugely popular California forum.