The median household income in Wallingford, VT in 2022 was $91,082, which was 18.8% greater than the median annual income of $73,991 across the entire state of Vermont. Compared to the median income of $38,456 in 2000 this represents an increase of 57.8%. The per capita income in 2022 was $37,517, which means an increase of 52.8% compared to 2000 when it was $17,699.
Whole page based on the data from 2000 / 2022 when the population of Wallingford, Vermont was 948 / 790
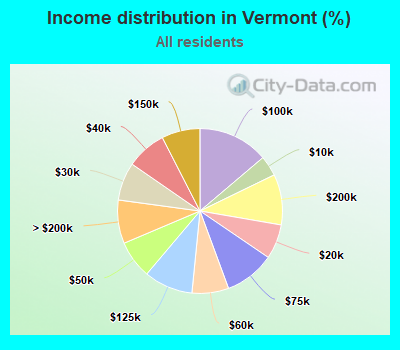
Income statistics for all residents
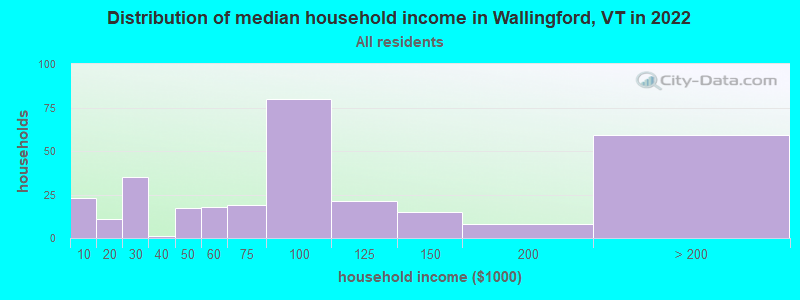
Median household income in Wallingford, VT in 2022:
Wallingford:
$91,083
State:
$73,991
Change in median household income between 2000 and 2022:
Wallingford, Vermont:
+136.8%
State:
+81.1%
Number of households with income < $10k:
Wallingford:
7.5% (23)
Vermont:
4.0% (11,050)
Number of households with income $10k - 20k:
Wallingford:
3.6% (11)
Vermont:
6.8% (18,853)
Number of households with income $20k - 30k:
Wallingford:
11.4% (35)
Vermont:
7.5% (20,673)
Number of households with income $30k - 40k:
Wallingford:
0.3% (1)
Vermont:
7.8% (21,750)
Number of households with income $40k - 50k:
Wallingford:
5.5% (17)
State:
7.4% (20,642)
Number of households with income $50k - 60k:
Wallingford:
5.9% (18)
Vermont:
7.2% (19,901)
Number of households with income $60k - 75k:
Wallingford:
6.2% (19)
State:
9.9% (27,351)
Number of households with income $75k - 100k:
Wallingford:
26.1% (80)
Vermont:
13.8% (38,275)
Number of households with income $100k - 125k:
Wallingford:
6.8% (21)
State:
9.6% (26,632)
Number of households with income $125k - 150k:
Wallingford:
4.9% (15)
State:
7.5% (20,857)
Number of households with income $150k - 200k:
Wallingford:
2.6% (8)
Vermont:
9.9% (27,469)
Number of households with income > $200k:
Wallingford:
19.2% (59)
State:
8.5% (23,637)
Aggregate household income in Wallingford in 2022: $31,006,175
Median family income in Wallingford in 2022:
Wallingford:
$95,148
State:
$96,345
Number of families with income < $10k:
Wallingford:
1.7% (4)
State:
2.0% (3,329)
Number of families with income $20k - 30k:
Wallingford:
2.6% (6)
Vermont:
4.4% (7,162)
Number of families with income $30k - 40k:
Wallingford:
2.7% (7)
State:
5.9% (9,690)
Number of families with income $40k - 50k:
Wallingford:
4.3% (10)
Vermont:
6.1% (10,098)
Number of families with income $50k - 60k:
Wallingford:
7.3% (18)
Vermont:
5.9% (9,726)
Number of families with income $60k - 75k:
Wallingford:
7.2% (17)
Vermont:
9.2% (15,108)
Number of families with income $75k - 100k:
Wallingford:
36.0% (87)
State:
15.7% (25,788)
Number of families with income $100k - 125k:
Wallingford:
5.0% (12)
Vermont:
12.7% (20,949)
Number of families with income $125k - 150k:
Wallingford:
21.4% (51)
Vermont:
9.6% (15,752)
Number of families with income $150k - 200k:
Wallingford:
3.3% (8)
State:
13.2% (21,675)
Number of families with income > $200k:
Wallingford:
8.5% (20)
Vermont:
12.0% (19,773)
Median non-family income in Wallingford in 2022:
Wallingford:
$23,767
State:
$46,022
Change in median non-family income between 2000 and 2022:
Wallingford, Vermont:
+31.1%
Vermont:
+87.4%
Median per capita income in Wallingford in 2022:
Wallingford:
$37,517
Vermont:
$42,251
Change in median per capita income between 2000 and 2022:
Wallingford, Vermont:
+112.0%
State:
+104.9%
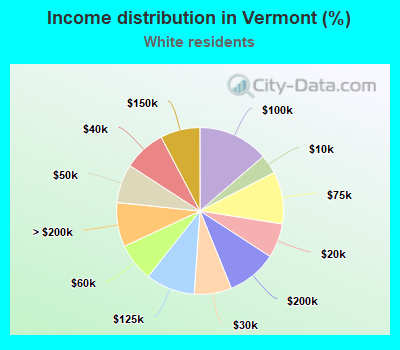
Income statistics for White residents
Median household income in Wallingford, VT in 2022:
Wallingford:
$76,062
State:
$73,591
Change in median household income between 2000 and 2022:
Wallingford, Vermont:
+97.8%
State:
+79.2%
Number of households with income < $10k:
Wallingford:
8.1% (21)
State:
3.7% (9,508)
Number of households with income $10k - 20k:
Wallingford:
3.5% (9)
Vermont:
6.7% (17,064)
Number of households with income $20k - 30k:
Wallingford:
13.1% (34)
State:
7.2% (18,552)
Number of households with income $30k - 40k:
Wallingford:
0.4% (1)
State:
8.2% (20,886)
Number of households with income $40k - 50k:
Wallingford:
6.5% (17)
Vermont:
7.5% (19,216)
Number of households with income $50k - 60k:
Wallingford:
7.3% (19)
State:
7.4% (18,898)
Number of households with income $60k - 75k:
Wallingford:
6.9% (18)
State:
10.1% (25,944)
Number of households with income $75k - 100k:
Wallingford:
30.0% (78)
Vermont:
13.7% (34,991)
Number of households with income $100k - 125k:
Wallingford:
7.7% (20)
State:
9.5% (24,409)
Number of households with income $125k - 150k:
Wallingford:
5.8% (15)
State:
7.7% (19,710)
Number of households with income $150k - 200k:
Wallingford:
3.1% (8)
State:
9.7% (24,802)
Number of households with income > $200k:
Wallingford:
7.7% (20)
State:
8.6% (21,983)
Aggregate household income in Wallingford in 2022: $21,559,156
Median family income in Wallingford in 2022:
Wallingford:
$91,528
State:
$96,147
Number of families with income < $10k:
Wallingford:
1.8% (4)
Vermont:
1.8% (2,669)
Number of families with income $20k - 30k:
Wallingford:
3.2% (6)
State:
4.1% (6,266)
Number of families with income $30k - 40k:
Wallingford:
3.3% (7)
State:
6.1% (9,273)
Number of families with income $40k - 50k:
Wallingford:
5.3% (11)
State:
6.4% (9,714)
Number of families with income $50k - 60k:
Wallingford:
8.8% (18)
State:
6.1% (9,310)
Number of families with income $60k - 75k:
Wallingford:
8.5% (17)
Vermont:
9.3% (14,175)
Number of families with income $75k - 100k:
Wallingford:
42.4% (85)
State:
15.5% (23,673)
Number of families with income $100k - 125k:
Wallingford:
5.9% (12)
State:
12.7% (19,323)
Number of families with income $125k - 150k:
Wallingford:
6.9% (14)
Vermont:
9.7% (14,805)
Number of families with income $150k - 200k:
Wallingford:
3.8% (8)
State:
13.1% (20,018)
Number of families with income > $200k:
Wallingford:
10.0% (20)
Vermont:
12.1% (18,463)
Median non-family income in Wallingford in 2022:
Wallingford:
$23,727
State:
$45,952
Change in median non-family income between 2000 and 2022:
Wallingford, Vermont:
+33.2%
State:
+86.1%
Median per capita income in Wallingford in 2022:
Wallingford:
$36,283
Vermont:
$43,031
Change in median per capita income between 2000 and 2022:
Wallingford, Vermont:
+104.6%
Vermont:
+106.0%
Income statistics for Hispanic or Latino residents
Median per capita income in Wallingford in 2022:
Wallingford:
$54,378
State:
$36,311
Change in median per capita income between 2000 and 2022:
Wallingford, Vermont:
+132.4%
State:
+131.1%
Income statistics for Multirace residents
Aggregate household income in Wallingford in 2022: $1,817,396
Median per capita income in Wallingford in 2022:
Wallingford:
$38,008
State:
$34,567
Discuss Wallingford, Vermont (VT) on our hugely popular Vermont forum.