Brewer neighborhood in Burlingame, California (CA), 94010, 94401, 94402 detailed profile
Settings
X

Business Search - 14 Million verified businesses
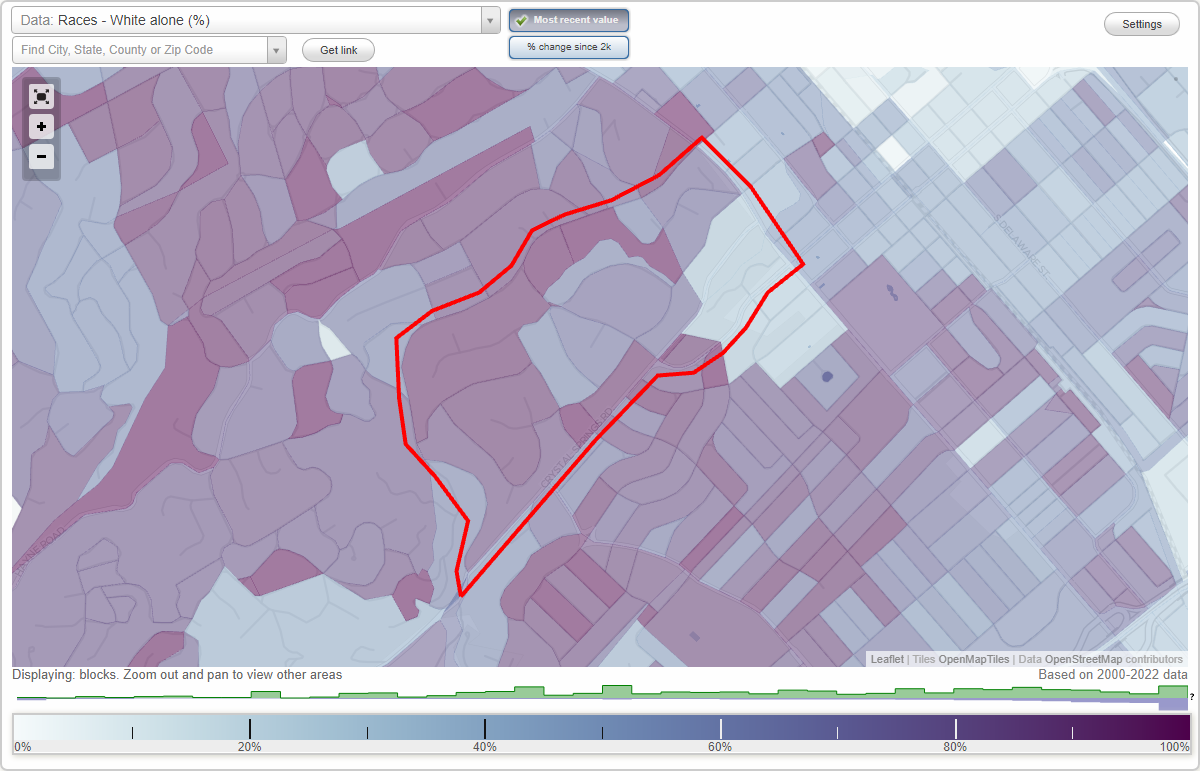
Area: 0.450 square miles
Population: 1,534
Population density:
| Brewer: | 3,411 people per square mile |
| Burlingame: | 7,151 people per square mile |

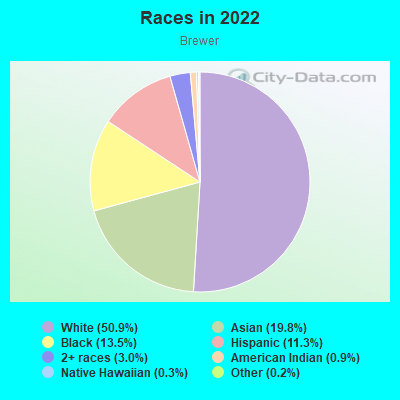
- 88650.9%White
- 34519.8%Asian
- 23413.5%Black
- 19711.3%Hispanic or Latino
- 533.0%Two or more races
- 150.9%American Indian
- 50.3%Native Hawaiian and Other
Pacific Islander - 40.2%Some other race
Median household income in 2022:
| Brewer: | $213,442 |
| Burlingame: | $165,940 |
Distribution of median household income
![Distribution of median household income]()
- 137Less than $10,000
- 87$10,000 to $19,999
- 168$20,000 to $29,999
- 316$30,000 to $39,999
- 43$40,000 to $49,999
- 53$50,000 to $59,999
- 33$60,000 to $74,999
- 70$75,000 to $99,999
- 40$100,000 to $124,999
- 40$125,000 to $149,999
- 90$150,000 to $199,999
- 361$200,000 or more

Distribution of owner-occupied house/condo value
![Distribution of owner-occupied house/condo value]()
- 16Less than $50,000
- 1$200,000 to $249,999
- 44$250,000 to $299,999
- 6$300,000 to $399,999
- 133$400,000 to $499,999
- 53$500,000 to $749,999
- 170$750,000 to $999,999
- 424$1,000,000 or more

Distribution of rent paid by renters
![Distribution of rent paid by renters]()
- 45$100 to $199
- 17$200 to $299
- 57$300 to $399
- 35$400 to $499
- 21$500 to $599
- 10$600 to $699
- 81$700 to $799
- 9$900 to $999
- 27$1,000 to $1,249
- 144$1,250 to $1,499
- 74$1,500 to $1,999
- 794$2,000 or more

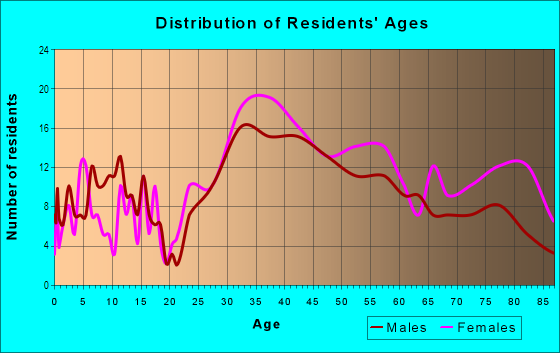
| Males: | 712 |
| Females: | 821 |
Males:
| This neighborhood: | 45.9 years |
| Whole city: | 39.7 years |
| This neighborhood: | 53.1 years |
| Whole city: | 41.7 years |
Average household size:
| Brewer: | 6.6 people |
| Burlingame: | 2.5 people |
Percentage of family households:
| Brewer: | 36.6% |
| Burlingame: | 45.6% |
| Here: | 50.6% |
| Burlingame: | 51.2% |
Percentage of married-couple families with children (among all households):
| Brewer: | 39.3% |
| Burlingame: | 34.1% |
Percentage of single-mother households (among all households):
| Brewer: | 7.7% |
| Burlingame: | 3.6% |
Percentage of never married males 15 years old and over:
Percentage of never married females 15 years old and over:
| Brewer: | 10.5% |
| Burlingame: | 18.3% |
Percentage of never married females 15 years old and over:
| Brewer: | 13.1% |
| city: | 13.4% |
Percentage of people that speak English not well or not at all:
| Brewer: | 0.7% |
| Burlingame: | 4.7% |
Percentage of people born in this state:
Percentage of people born in another U.S. state:
Percentage of native residents but born outside the U.S.:
Percentage of foreign born residents:
| Here: | 45.2% |
| Burlingame: | 52.5% |
Percentage of people born in another U.S. state:
| Brewer: | 20.2% |
| Burlingame: | 16.0% |
Percentage of native residents but born outside the U.S.:
| Here: | 0.5% |
| city: | 1.6% |
Percentage of foreign born residents:
| Here: | 34.1% |
| Burlingame: | 30.0% |
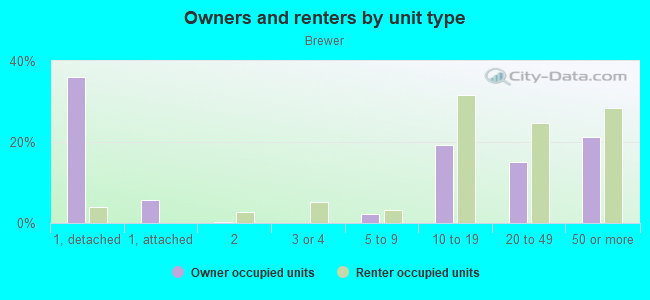
Owner-occupied
Renter-occupied

- Rooms in owner-occupied houses and condos in Brewer
- 381 room
- 322 rooms
- 4293 rooms
- 454 rooms
- 885 rooms
- 416 rooms
- 837 rooms
- 708 rooms
- 1609+ rooms
- Rooms in renter-occupied apartments in Brewer
- 1381 room
- 502 rooms
- 4313 rooms
- 644 rooms
- 135 rooms
- 336 rooms
- 257 rooms
- 48 rooms
- 1719+ rooms
Owner-occupied
Renter-occupied
- Bedrooms in owner-occupied houses and condos in Brewer
- 38no bedroom
- 991 bedroom
- 2332 bedrooms
- 823 bedrooms
- 1854 bedrooms
- 1115+ bedrooms
- Bedrooms in renter-occupied apartments in Brewer
- 180no bedroom
- 4631 bedroom
- 1702 bedrooms
- 323 bedrooms
- 354 bedrooms
- 55+ bedrooms
Average number of cars or other vehicles available in houses/condos:
Average number of cars or other vehicles available in apartments:
| This neighborhood: | 2.4 |
| Burlingame: | 2.2 |
Average number of cars or other vehicles available in apartments:
| Here: | 6.7 |
| city: | 1.4 |
Percentage of units with a mortgage:
| Brewer: | 64.2% |
| Burlingame: | 71.7% |
Average estimated value of detached houses in 2022 (58.1% of all units):
| Brewer: | $4,565,054 |
| California: | $988,808 |
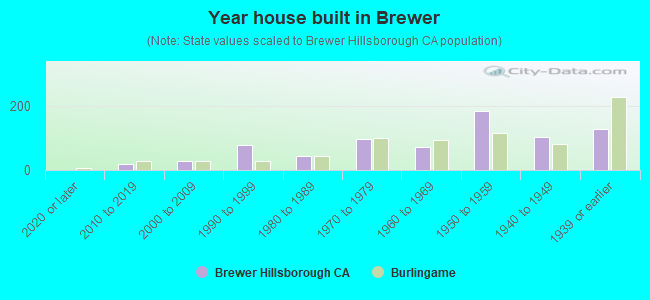
- Year house built in Brewer
- 12020 or later
- 202010 to 2019
- 282000 to 2009
- 771990 to 1999
- 451980 to 1989
- 951970 to 1979
- 711960 to 1969
- 1831950 to 1959
- 1021940 to 1949
- 1271939 or earlier
City-data.com crime index for city in 2020 (higher means more crime):
| City: | 236.7 |
| U.S. average: | 219.5 |
Travel time to work (commute)
![Travel time to work (commute)]()
- 10Less than 5 minutes
- 495 to 9 minutes
- 4410 to 14 minutes
- 5415 to 19 minutes
- 4820 to 24 minutes
- 3525 to 29 minutes
- 4930 to 34 minutes
- 1935 to 39 minutes
- 1940 to 44 minutes
- 6745 to 59 minutes
- 6960 to 89 minutes
- 1090 or more minutes

Means of transportation to work
![Means of transportation to work]()
- 67.3%504Drove a car alone
- 3.6%27Carpooled
- 5.1%38Bus
- 0.8%6Subway or elevated rail
- 16.7%125Long-distance train or commuter rail
- 0.1%1Taxi
- 4.8%36Bicycle
- 5.9%44Walked
- 2.3%17Other means
- 20.2%151Worked at home

Time leaving home to go to work
![Time leaving home to go to work]()
- 812:00 a.m. to 4:59 a.m.
- 95:00 a.m. to 5:29 a.m.
- 235:30 a.m. to 5:59 a.m.
- 166:00 a.m. to 6:29 a.m.
- 306:30 a.m. to 6:59 a.m.
- 367:00 a.m. to 7:29 a.m.
- 807:30 a.m. to 7:59 a.m.
- 668:00 a.m. to 8:29 a.m.
- 578:30 a.m. to 8:59 a.m.
- 899:00 a.m. to 9:59 a.m.
- 1110:00 a.m. to 10:59 a.m.
- 811:00 a.m. to 11:59 a.m.
- 1212:00 p.m. to 3:59 p.m.
- 184:00 p.m. to 11:59 p.m.

Occupations of males:
- Percentage of males in management occupations (except farmers):
Here: 20.2% city: 21.1%
- Percentage of males in business and financial operations occupations:
Here: 9.8% city: 8.6%
- Percentage of males in computer and mathematical occupations:
Here: 5.3% city: 7.1%
- Percentage of males in architecture and engineering occupations:
Here: 9.7% city: 4.9%
- Percentage of males in life, physical, and social science occupations:
Here: 4.2% city: 3.3%
- Percentage of males in community and social services occupations:
Here: 6.1% city: 1.3%
- Percentage of males in legal occupations:
Here: 1.7% city: 3.3%
- Percentage of males in education, training, and library occupations:
Here: 4.8% city: 3.4%
- Percentage of males in arts, design, entertainment, sports, and media occupations:
Here: 3.6% city: 2.6%
- Percentage of males in healthcare practitioners and technical occupations:
Here: 14.3% city: 3.1%
- Percentage of males in service occupations:
Here: 11.3% city: 12.7%
- Percentage of males in sales and office occupations:
Here: 7.5% city: 12.6%
Occupations of females:
- Percentage of females in management occupations (except farmers):
Here: 21.3% city: 20.8%
- Percentage of females in business and financial operations occupations:
Here: 3.3% city: 10.1%
- Percentage of females in computer and mathematical occupations:
Here: 7.4% city: 4.3%
- Percentage of females in architecture and engineering occupations:
Here: 9.1% city: 2.4%
- Percentage of females in community and social services occupations:
Here: 2.8% city: 1.0%
- Percentage of females in legal occupations:
Here: 10.6% city: 3.4%
- Percentage of females in education, training, and library occupations:
Here: 6.4% city: 7.2%
- Percentage of females in arts, design, entertainment, sports, and media occupations:
Here: 10.6% city: 2.1%
- Percentage of females in healthcare practitioners and technical occupations:
Here: 6.5% city: 10.3%
- Percentage of females in service occupations:
Here: 6.4% city: 11.2%
- Percentage of females in sales and office occupations:
Here: 8.9% city: 19.2%
- Percentage of females in transportation occupations:
Here: 2.3% city: 1.8%
- Percentage of females in material moving occupations:
Here: 4.1% city: 0.9%
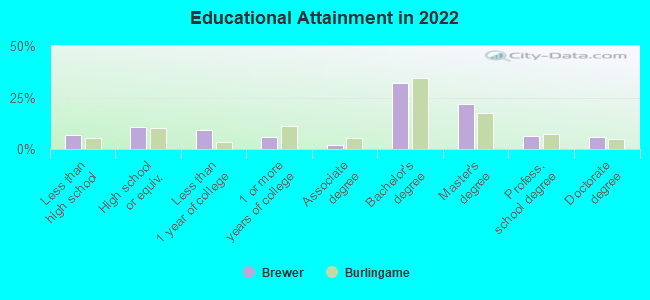
Education in this neighborhood (subdivision or community):
- Percentage of people 3 years and older in K-12 schools:
Brewer: 16.3% Burlingame: 17.3%
- Percentage of people 3 years and older in undergraduate colleges:
Brewer: 4.6% Burlingame: 4.6%
- Percentage of people 3 years and older in grad. or professional schools:
Brewer: 13.2% Burlingame: 1.3%
- Percentage of students K-12 enrolled in private schools:
Brewer: 68.5% Burlingame: 20.4%
Percentage of population below poverty level:
| Brewer: | 5.3% |
| Burlingame: | 5.0% |
Median year owner moved in (as recorded in 2022):
| Brewer: | 2005 |
| Burlingame: | 2002 |
Percentage of married-couple families with both working:
| Brewer: | 74.9% |
| Burlingame: | 75.6% |
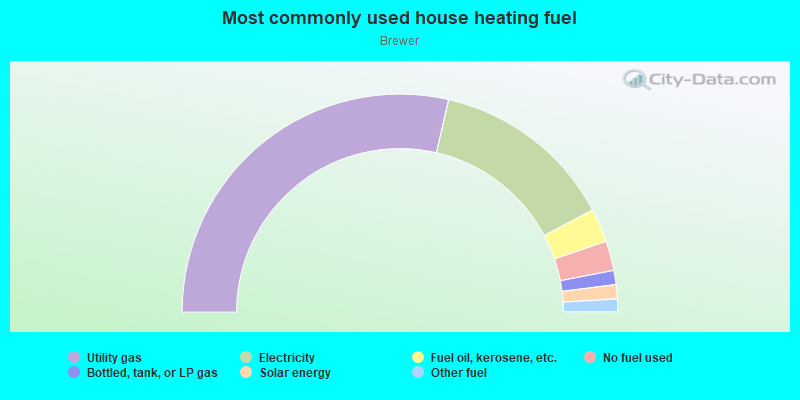
- 57.2%Utility gas
- 27.3%Electricity
- 5.0%Fuel oil, kerosene, etc.
- 4.4%No fuel used
- 2.1%Bottled, tank, or LP gas
- 2.1%Solar energy
- 1.9%Other fuel
Highways in this neighborhood:
S el Camino Real (State Hwy 82)
Length: 0.22 miles
Directions: N-S, SE-NW
Address range: 1 to 299
Directions: N-S, SE-NW
Address range: 1 to 299
N el Camino Real (State Hwy 82)
Length: 0.17 miles
Direction: SE-NW
Address range: 1 to 99
Direction: SE-NW
Address range: 1 to 99
Roads and streets:
Crystal Springs Rd
Length: 1.20 miles
Directions: N-S, SW-NE
Address range: 1 to 801
Directions: N-S, SW-NE
Address range: 1 to 801
el Cerrito Ave
Length: 1.10 miles
Directions: E-W, N-S, SW-NE
Address range: 1 to 598
Directions: E-W, N-S, SW-NE
Address range: 1 to 598
Bridge Rd
Length: 0.86 miles
Directions: E-W, N-S, SE-NW, SW-NE
Address range: 1 to 399
Directions: E-W, N-S, SE-NW, SW-NE
Address range: 1 to 399
Rockridge Rd
Length: 0.56 miles
Directions: E-W, N-S, SE-NW, SW-NE
Address range: 1 to 299
Directions: E-W, N-S, SE-NW, SW-NE
Address range: 1 to 299
Stonehedge Rd
Length: 0.51 miles
Directions: E-W, N-S, SE-NW, SW-NE
Address range: 1 to 299
Directions: E-W, N-S, SE-NW, SW-NE
Address range: 1 to 299
Baywood Ave
Length: 0.49 miles
Directions: E-W, N-S, SW-NE
Address range: 1 to 199
Directions: E-W, N-S, SW-NE
Address range: 1 to 199
W 3rd Ave
Length: 0.49 miles
Directions: E-W, SE-NW, SW-NE
Address range: 1 to 398
Directions: E-W, SE-NW, SW-NE
Address range: 1 to 398
de Sabla Rd
Length: 0.46 miles
Directions: E-W, N-S, SE-NW, SW-NE
Address range: 1 to 199
Directions: E-W, N-S, SE-NW, SW-NE
Address range: 1 to 199
Sierra Dr
Length: 0.45 miles
Directions: E-W, N-S, SW-NE
Address range: 200 to 363
Directions: E-W, N-S, SW-NE
Address range: 200 to 363
Uplands Dr
Length: 0.38 miles
Directions: E-W, SW-NE
Address range: 200 to 402
Directions: E-W, SW-NE
Address range: 200 to 402
Redwood Dr
Length: 0.32 miles
Directions: E-W, N-S, SE-NW
Address range: 1 to 199
Directions: E-W, N-S, SE-NW
Address range: 1 to 199
Arroyo Ct
Length: 0.26 miles
Directions: E-W, N-S, SE-NW, SW-NE
Address range: 1 to 199
Directions: E-W, N-S, SE-NW, SW-NE
Address range: 1 to 199
Fallen Leaf Dr
Length: 0.25 miles
Directions: N-S, SE-NW, SW-NE
Address range: 100 to 199
Directions: N-S, SE-NW, SW-NE
Address range: 100 to 199
Eaton Rd
Length: 0.22 miles
Directions: E-W, SW-NE
Address range: 200 to 299
Directions: E-W, SW-NE
Address range: 200 to 299
Baytree Way
Length: 0.08 miles
Directions: N-S, SE-NW
Address range: 1 to 99
Directions: N-S, SE-NW
Address range: 1 to 99
Belford Way
Length: 0.08 miles
Direction: SE-NW
Address range: 16 to 99
Direction: SE-NW
Address range: 16 to 99
St Francis Rd
Length: 0.07 miles
Direction: SW-NE
Address range: 1 to 99
Direction: SW-NE
Address range: 1 to 99
Laureldale Rd
Length: 0.05 miles
Directions: N-S, SE-NW
Address range: 1 to 99
Directions: N-S, SE-NW
Address range: 1 to 99
Homs Ct
Length: 0.05 miles
Direction: SE-NW
Address range: 1 to 99
Direction: SE-NW
Address range: 1 to 99
Dartmouth Rd
Length: 0.05 miles
Directions: N-S, SE-NW
Directions: N-S, SE-NW
Greenbriar Way
Length: 0.04 miles
Direction: SW-NE
Address range: 1 to 99
Direction: SW-NE
Address range: 1 to 99
Sherwood Ct
Length: 0.04 miles
Direction: SE-NW
Address range: 1 to 99
Direction: SE-NW
Address range: 1 to 99
Normandy Ct
Length: 0.04 miles
Direction: SE-NW
Address range: 1 to 99
Direction: SE-NW
Address range: 1 to 99
Creekwood Way
Length: 0.04 miles
Direction: SW-NE
Address range: 1 to 99
Direction: SW-NE
Address range: 1 to 99
Other features:
San Mateo Crk
Length: 1.62 miles
Directions: E-W, N-S, SE-NW, SW-NE
Directions: E-W, N-S, SE-NW, SW-NE