Burlingame Terrace (The Terrace) neighborhood in Burlingame, California (CA), 94010 detailed profile
Settings
X


Business Search - 14 Million verified businesses
Area: 0.293 square miles
Population: 2,789
Population density:
| Burlingame Terrace (The Terrace): | 9,517 people per square mile |
| Burlingame: | 7,151 people per square mile |

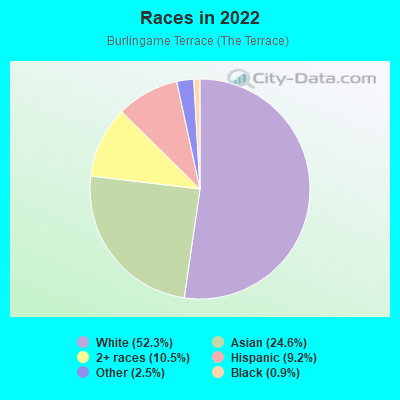
- 1,46852.3%White
- 69024.6%Asian
- 29410.5%Two or more races
- 2579.2%Hispanic or Latino
- 712.5%Some other race
- 240.9%Black
- 10.04%Native Hawaiian and Other
Pacific Islander
Distribution of median household income
![Distribution of median household income]()
- 20Less than $10,000
- 68$10,000 to $19,999
- 54$20,000 to $29,999
- 35$30,000 to $39,999
- 82$40,000 to $49,999
- 36$50,000 to $59,999
- 38$60,000 to $74,999
- 105$75,000 to $99,999
- 101$100,000 to $124,999
- 68$125,000 to $149,999
- 234$150,000 to $199,999
- 412$200,000 or more

Distribution of owner-occupied house/condo value
![Distribution of owner-occupied house/condo value]()
- 20Less than $50,000
- 2$100,000 to $149,999
- 4$150,000 to $199,999
- 11$200,000 to $249,999
- 126$500,000 to $749,999
- 38$750,000 to $999,999
- 526$1,000,000 or more

Distribution of rent paid by renters
![Distribution of rent paid by renters]()
- 11$300 to $399
- 25$1,000 to $1,249
- 17$1,250 to $1,499
- 62$1,500 to $1,999
- 496$2,000 or more

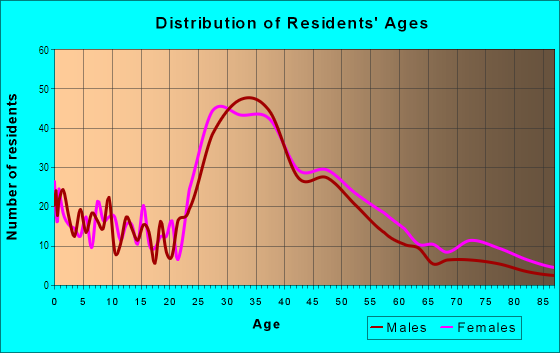
| Males: | 1,371 |
| Females: | 1,418 |
Males:
| This neighborhood: | 37.5 years |
| Whole city: | 39.7 years |
| This neighborhood: | 38.1 years |
| Whole city: | 41.7 years |
Average household size:
| Burlingame Terrace (The Terrace): | 7.4 people |
| Burlingame: | 2.5 people |
Percentage of family households:
| Burlingame Terrace (The Terrace): | 46.6% |
| Burlingame: | 45.6% |
| Here: | 49.7% |
| Burlingame: | 51.2% |
Percentage of married-couple families with children (among all households):
| Burlingame Terrace (The Terrace): | 32.9% |
| Burlingame: | 34.1% |
Percentage of single-mother households (among all households):
| Burlingame Terrace (The Terrace): | 4.0% |
| Burlingame: | 3.6% |
Percentage of never married males 15 years old and over:
Percentage of never married females 15 years old and over:
| Burlingame Terrace (The Terrace): | 16.0% |
| Burlingame: | 18.3% |
Percentage of never married females 15 years old and over:
| Burlingame Terrace (The Terrace): | 18.9% |
| city: | 13.4% |
Percentage of people that speak English not well or not at all:
| Burlingame Terrace (The Terrace): | 7.3% |
| Burlingame: | 4.7% |
Percentage of people born in this state:
Percentage of people born in another U.S. state:
Percentage of native residents but born outside the U.S.:
Percentage of foreign born residents:
| Here: | 54.2% |
| Burlingame: | 52.5% |
Percentage of people born in another U.S. state:
| Burlingame Terrace (The Terrace): | 15.6% |
| Burlingame: | 16.0% |
Percentage of native residents but born outside the U.S.:
| Here: | 1.4% |
| city: | 1.6% |
Percentage of foreign born residents:
| Here: | 28.9% |
| Burlingame: | 30.0% |
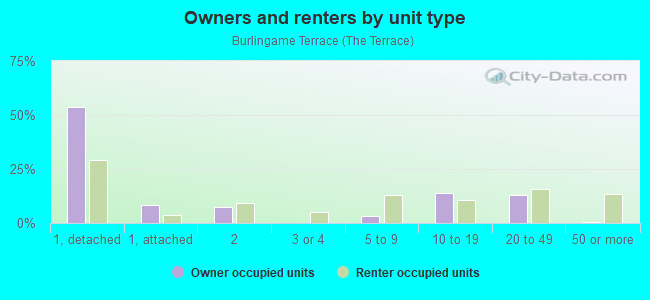
Owner-occupied
Renter-occupied

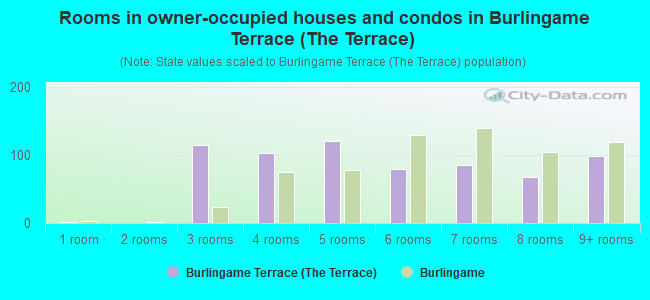
- Rooms in owner-occupied houses and condos in Burlingame Terrace <
> - 11 room
- 02 rooms
- 1143 rooms
- 1034 rooms
- 1215 rooms
- 806 rooms
- 857 rooms
- 688 rooms
- 999+ rooms
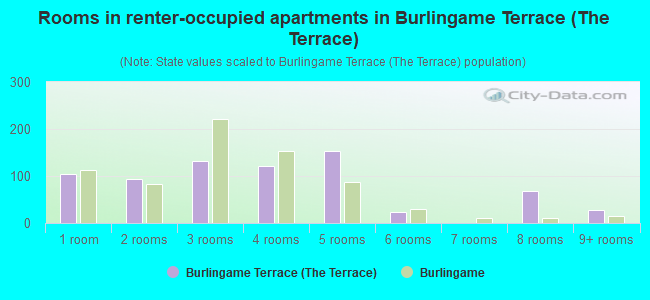
- Rooms in renter-occupied apartments in Burlingame Terrace <
> - 1041 room
- 942 rooms
- 1313 rooms
- 1214 rooms
- 1545 rooms
- 246 rooms
- 17 rooms
- 688 rooms
- 279+ rooms
Owner-occupied
Renter-occupied
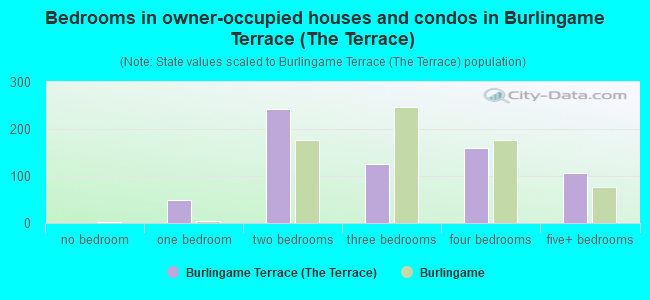
- Bedrooms in owner-occupied houses and condos in Burlingame Terrace <
> - 1no bedroom
- 481 bedroom
- 2432 bedrooms
- 1253 bedrooms
- 1604 bedrooms
- 1075+ bedrooms
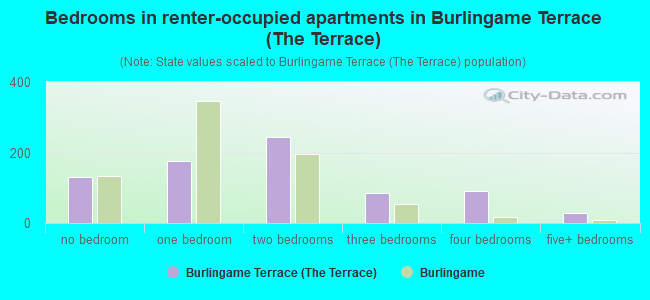
- Bedrooms in renter-occupied apartments in Burlingame Terrace <
> - 131no bedroom
- 1771 bedroom
- 2432 bedrooms
- 863 bedrooms
- 914 bedrooms
- 275+ bedrooms
Average number of cars or other vehicles available in houses/condos:
Average number of cars or other vehicles available in apartments:
| This neighborhood: | 1.8 |
| Burlingame: | 2.2 |
Average number of cars or other vehicles available in apartments:
| Here: | 1.4 |
| city: | 1.4 |
Percentage of units with a mortgage:
| Burlingame Terrace (The Terrace): | 59.3% |
| Burlingame: | 71.7% |
Average estimated value of detached houses in 2022 (56.4% of all units):
| Burlingame Terrace (The Terrace): | $4,034,851 |
| California: | $988,808 |
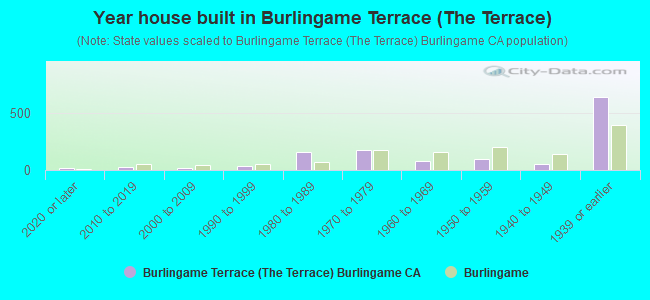
- Year house built in Burlingame Terrace <
> - 192020 or later
- 232010 to 2019
- 182000 to 2009
- 391990 to 1999
- 1561980 to 1989
- 1751970 to 1979
- 771960 to 1969
- 1001950 to 1959
- 511940 to 1949
- 6341939 or earlier
City-data.com crime index for city in 2020 (higher means more crime):
| City: | 236.7 |
| U.S. average: | 219.5 |
Travel time to work (commute)
![Travel time to work (commute)]()
- 10Less than 5 minutes
- 805 to 9 minutes
- 12610 to 14 minutes
- 10415 to 19 minutes
- 16020 to 24 minutes
- 7025 to 29 minutes
- 16130 to 34 minutes
- 5035 to 39 minutes
- 9840 to 44 minutes
- 13545 to 59 minutes
- 11860 to 89 minutes
- 790 or more minutes

Means of transportation to work
![Means of transportation to work]()
- 48.2%677Drove a car alone
- 2.8%40Carpooled
- 9.2%129Bus
- 8.0%113Subway or elevated rail
- 3.5%49Long-distance train or commuter rail
- 0.1%1Light rail, streetcar or trolley
- 2.3%32Taxi
- 2.1%29Bicycle
- 3.8%54Walked
- 0.4%6Other means
- 30.1%423Worked at home

Time leaving home to go to work
![Time leaving home to go to work]()
- 2812:00 a.m. to 4:59 a.m.
- 405:00 a.m. to 5:29 a.m.
- 355:30 a.m. to 5:59 a.m.
- 226:00 a.m. to 6:29 a.m.
- 466:30 a.m. to 6:59 a.m.
- 897:00 a.m. to 7:29 a.m.
- 1817:30 a.m. to 7:59 a.m.
- 1368:00 a.m. to 8:29 a.m.
- 2158:30 a.m. to 8:59 a.m.
- 1159:00 a.m. to 9:59 a.m.
- 3210:00 a.m. to 10:59 a.m.
- 3511:00 a.m. to 11:59 a.m.
- 7712:00 p.m. to 3:59 p.m.
- 384:00 p.m. to 11:59 p.m.

Occupations of males:
- Percentage of males in management occupations (except farmers):
Here: 37.1% city: 21.1%
- Percentage of males in business and financial operations occupations:
Here: 7.6% city: 8.6%
- Percentage of males in computer and mathematical occupations:
Here: 9.6% city: 7.1%
- Percentage of males in architecture and engineering occupations:
Here: 3.2% city: 4.9%
- Percentage of males in life, physical, and social science occupations:
Here: 1.8% city: 3.3%
- Percentage of males in education, training, and library occupations:
Here: 3.8% city: 3.4%
- Percentage of males in arts, design, entertainment, sports, and media occupations:
Here: 2.2% city: 2.6%
- Percentage of males in healthcare practitioners and technical occupations:
Here: 3.5% city: 3.1%
- Percentage of males in service occupations:
Here: 9.2% city: 12.7%
- Percentage of males in sales and office occupations:
Here: 9.2% city: 12.6%
- Percentage of males in construction, extraction, and maintenance occupations:
Here: 5.5% city: 6.1%
- Percentage of males in transportation occupations:
Here: 2.8% city: 3.9%
Occupations of females:
- Percentage of females in management occupations (except farmers):
Here: 16.5% city: 20.8%
- Percentage of females in business and financial operations occupations:
Here: 17.1% city: 10.1%
- Percentage of females in computer and mathematical occupations:
Here: 3.8% city: 4.3%
- Percentage of females in architecture and engineering occupations:
Here: 1.4% city: 2.4%
- Percentage of females in life, physical, and social science occupations:
Here: 2.1% city: 4.3%
- Percentage of females in community and social services occupations:
Here: 1.1% city: 1.0%
- Percentage of females in legal occupations:
Here: 5.9% city: 3.4%
- Percentage of females in education, training, and library occupations:
Here: 14.5% city: 7.2%
- Percentage of females in healthcare practitioners and technical occupations:
Here: 6.1% city: 10.3%
- Percentage of females in service occupations:
Here: 11.1% city: 11.2%
- Percentage of females in sales and office occupations:
Here: 16.3% city: 19.2%
- Percentage of females in production occupations:
Here: 2.8% city: 1.0%
- Percentage of females in transportation occupations:
Here: 1.1% city: 1.8%
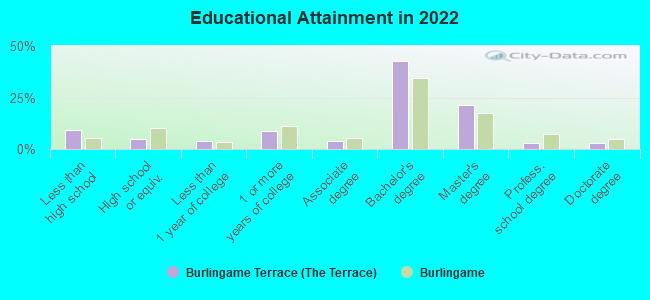
Education in this neighborhood (subdivision or community):
- Percentage of people 3 years and older in K-12 schools:
Burlingame Terrace (The Terrace): 25.0% Burlingame: 17.3%
- Percentage of people 3 years and older in undergraduate colleges:
Burlingame Terrace (The Terrace): 4.1% Burlingame: 4.6%
- Percentage of people 3 years and older in grad. or professional schools:
Burlingame Terrace (The Terrace): 1.6% Burlingame: 1.3%
- Percentage of students K-12 enrolled in private schools:
Burlingame Terrace (The Terrace): 50.2% Burlingame: 20.4%
Percentage of population below poverty level:
| Burlingame Terrace (The Terrace): | 8.2% |
| Burlingame: | 5.0% |
Median year owner moved in (as recorded in 2022):
| Burlingame Terrace (The Terrace): | 2003 |
| Burlingame: | 2002 |
Percentage of married-couple families with both working:
| Burlingame Terrace (The Terrace): | 78.1% |
| Burlingame: | 75.6% |
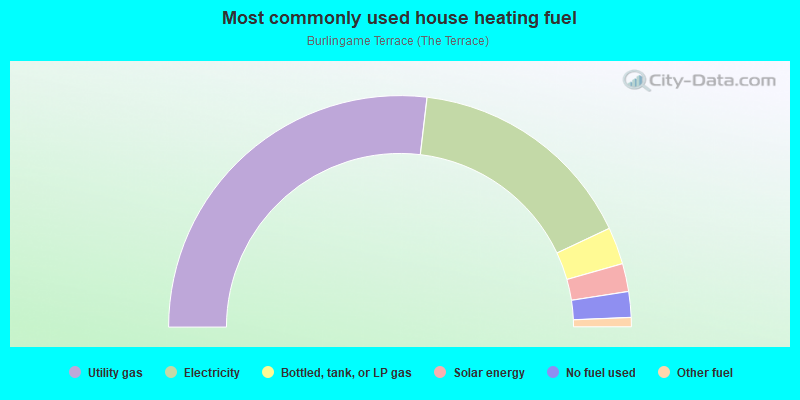
- 53.7%Utility gas
- 32.2%Electricity
- 5.2%Bottled, tank, or LP gas
- 3.9%Solar energy
- 3.6%No fuel used
- 1.3%Other fuel
Highways in this neighborhood:
State Hwy 82 (el Camino Real, Mission St)
Length: 0.80 miles
Direction: SE-NW
Address range: 801 to 1198
Direction: SE-NW
Address range: 801 to 1198
Roads and streets:
California Dr
Length: 0.93 miles
Directions: E-W, SE-NW
Address range: 700 to 1199
Directions: E-W, SE-NW
Address range: 700 to 1199
Paloma Ave
Length: 0.81 miles
Direction: SE-NW
Address range: 700 to 1199
Direction: SE-NW
Address range: 700 to 1199
Edgehill Dr
Length: 0.53 miles
Directions: E-W, SE-NW, SW-NE
Address range: 800 to 1499
Directions: E-W, SE-NW, SW-NE
Address range: 800 to 1499
Chula Vista Ave
Length: 0.52 miles
Directions: E-W, SE-NW
Address range: 900 to 1199
Directions: E-W, SE-NW
Address range: 900 to 1199
Oak Grove Ave
Length: 0.50 miles
Direction: SW-NE
Address range: 1023 to 1499
Direction: SW-NE
Address range: 1023 to 1499
Laguna Ave
Length: 0.48 miles
Direction: SE-NW
Address range: 900 to 1199
Direction: SE-NW
Address range: 900 to 1199
Capuchino Ave
Length: 0.42 miles
Direction: SE-NW
Address range: 900 to 1199
Direction: SE-NW
Address range: 900 to 1199
Palm Dr
Length: 0.41 miles
Direction: SW-NE
Address range: 1100 to 1499
Direction: SW-NE
Address range: 1100 to 1499
Crossway Rd
Length: 0.35 miles
Directions: E-W, SE-NW
Address range: 700 to 899
Directions: E-W, SE-NW
Address range: 700 to 899
Sanchez Ave
Length: 0.33 miles
Direction: SW-NE
Address range: 1100 to 1499
Direction: SW-NE
Address range: 1100 to 1499
Broadway
Length: 0.33 miles
Directions: N-S, SW-NE
Address range: 1090 to 1499
Directions: N-S, SW-NE
Address range: 1090 to 1499
Acacia Dr
Length: 0.32 miles
Direction: SE-NW
Address range: 700 to 899
Direction: SE-NW
Address range: 700 to 899
Carmelita Ave
Length: 0.31 miles
Direction: SW-NE
Address range: 1100 to 1499
Direction: SW-NE
Address range: 1100 to 1499
Fairfield Rd
Length: 0.29 miles
Direction: SE-NW
Address range: 700 to 899
Direction: SE-NW
Address range: 700 to 899
Carolan Ave
Length: 0.21 miles
Directions: E-W, SE-NW
Address range: 700 to 798
Directions: E-W, SE-NW
Address range: 700 to 798
Farringdon Ln
Length: 0.18 miles
Direction: SE-NW
Address range: 700 to 799
Direction: SE-NW
Address range: 700 to 799
Majilla Ave
Length: 0.12 miles
Direction: SW-NE
Address range: 1100 to 1299
Direction: SW-NE
Address range: 1100 to 1299
Neuchatel Ave
Length: 0.11 miles
Directions: E-W, SE-NW
Address range: 700 to 755
Directions: E-W, SE-NW
Address range: 700 to 755
Willborough Rd
Length: 0.10 miles
Directions: E-W, SE-NW
Address range: 746 to 799
Directions: E-W, SE-NW
Address range: 746 to 799
Willborough Pl
Length: 0.08 miles
Directions: E-W, N-S, SE-NW, SW-NE
Address range: 700 to 799
Directions: E-W, N-S, SE-NW, SW-NE
Address range: 700 to 799
San Mateo Ave
Length: 0.07 miles
Direction: SE-NW
Address range: 700 to 799
Direction: SE-NW
Address range: 700 to 799
Railroad features:
Joint Powers Authority RR (Union Pacific RR)
Length: 0.94 miles
Direction: SE-NW
Direction: SE-NW
Caltrain
Length: 0.24 miles
Directions: E-W, SE-NW
Directions: E-W, SE-NW
Other features:
Sanchez Crk
Length: 0.36 miles
Directions: N-S, SW-NE
Directions: N-S, SW-NE