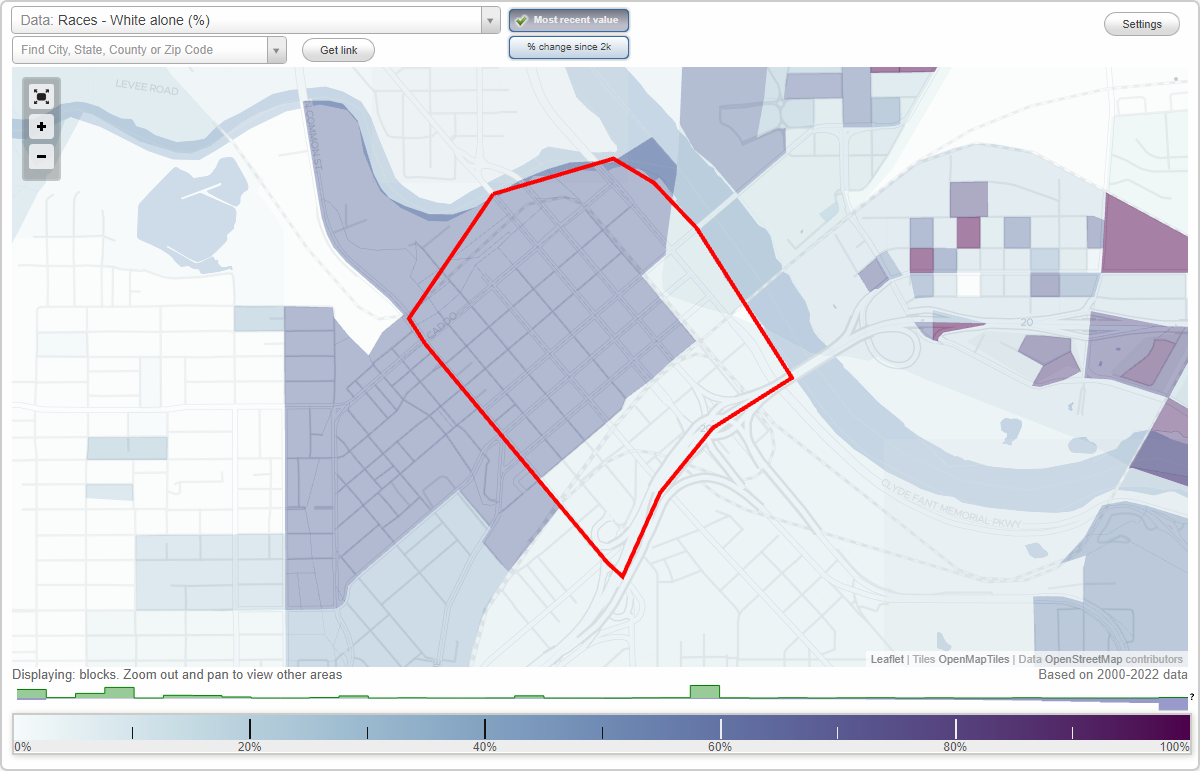
Downtown Shreveport Historic District neighborhood in Shreveport, Louisiana (LA), 71101 detailed profile
Settings
X

Business Search - 14 Million verified businesses
Area: 0.535 square miles
Population: 648
Population density:
| Downtown Shreveport Historic District: | 1,212 people per square mile |
| Shreveport: | 1,741 people per square mile |

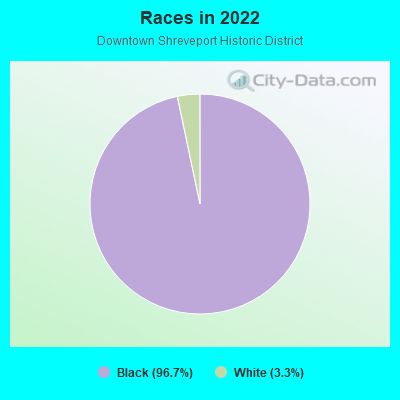
- 64896.7%Black
- 223.3%White
Median household income in 2022:
| Downtown Shreveport Historic District: | $52,188 |
| Shreveport: | $43,643 |
Distribution of median household income
![Distribution of median household income]()
- 10Less than $10,000
- 4$10,000 to $19,999
- 52$20,000 to $29,999
- 16$30,000 to $39,999
- 8$40,000 to $49,999
- 19$50,000 to $59,999
- 59$60,000 to $74,999
- 6$75,000 to $99,999
- 13$100,000 to $124,999
- 4$125,000 to $149,999
- 3$150,000 to $199,999

Distribution of owner-occupied house/condo value
![Distribution of owner-occupied house/condo value]()
- 14Less than $50,000
- 76$50,000 to $99,999
- 7$100,000 to $149,999
- 3$150,000 to $199,999
- 7$500,000 to $749,999

Distribution of rent paid by renters
![Distribution of rent paid by renters]()
- 3Less than $100
- 11$200 to $299
- 2$400 to $499
- 11$500 to $599
- 24$600 to $699
- 25$700 to $799
- 40$800 to $899
- 16$900 to $999

Median rent in 2022:
| Downtown Shreveport Historic District: | $828 |
| Shreveport: | $717 |
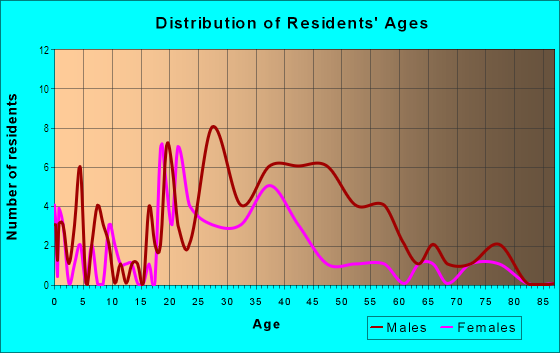
| Males: | 286 |
| Females: | 361 |
Males:
| This neighborhood: | 15.9 years |
| Whole city: | 37.3 years |
| This neighborhood: | 29.0 years |
| Whole city: | 39.8 years |
Average household size:
| Downtown Shreveport Historic District: | 3.7 people |
| Shreveport: | 2.2 people |
Percentage of family households:
| Downtown Shreveport Historic District: | 66.8% |
| Shreveport: | 39.7% |
| Here: | 41.1% |
| Shreveport: | 27.8% |
Percentage of married-couple families with children (among all households):
| Downtown Shreveport Historic District: | 11.3% |
| Shreveport: | 12.5% |
Percentage of single-mother households (among all households):
| Downtown Shreveport Historic District: | 15.2% |
| Shreveport: | 27.4% |
Percentage of never married males 15 years old and over:
Percentage of never married females 15 years old and over:
| Downtown Shreveport Historic District: | 17.4% |
| Shreveport: | 21.1% |
Percentage of never married females 15 years old and over:
| Downtown Shreveport Historic District: | 22.6% |
| city: | 21.2% |
Percentage of people born in this state:
Percentage of people born in another U.S. state:
Percentage of native residents but born outside the U.S.:
Percentage of foreign born residents:
| Here: | 90.4% |
| Shreveport: | 76.6% |
Percentage of people born in another U.S. state:
| Downtown Shreveport Historic District: | 9.6% |
| Shreveport: | 20.0% |
Percentage of native residents but born outside the U.S.:
| Here: | 0.0% |
| city: | 0.8% |
Percentage of foreign born residents:
| Here: | 0.0% |
| Shreveport: | 2.7% |
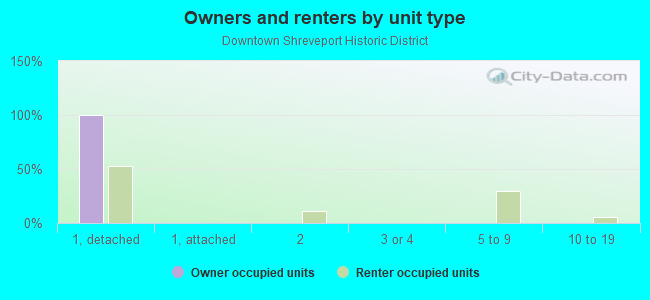
Owner-occupied
Renter-occupied

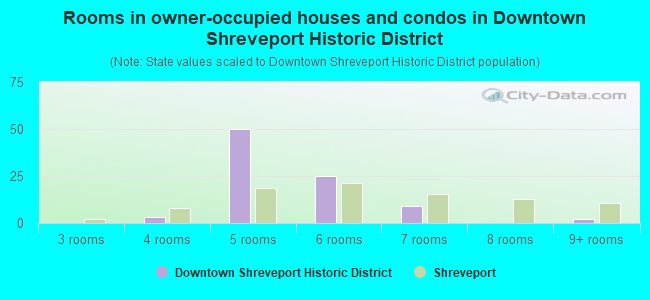
- Rooms in owner-occupied houses and condos in Downtown Shreveport Historic District
- 01 room
- 02 rooms
- 03 rooms
- 34 rooms
- 505 rooms
- 256 rooms
- 97 rooms
- 08 rooms
- 29+ rooms
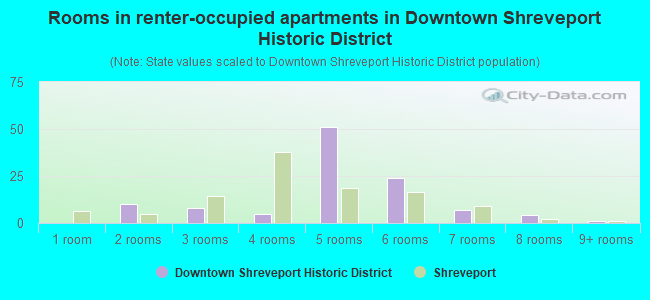
- Rooms in renter-occupied apartments in Downtown Shreveport Historic District
- 01 room
- 102 rooms
- 83 rooms
- 54 rooms
- 515 rooms
- 246 rooms
- 77 rooms
- 48 rooms
- 19+ rooms
Owner-occupied
Renter-occupied
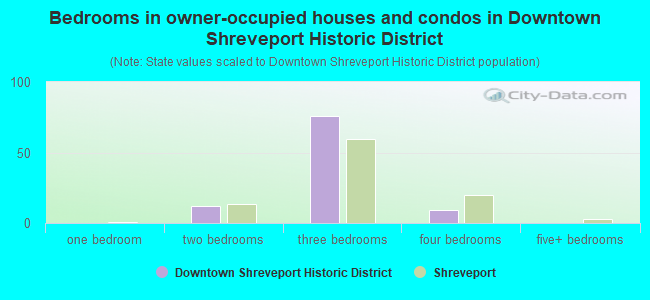
- Bedrooms in owner-occupied houses and condos in Downtown Shreveport Historic District
- 0no bedroom
- 01 bedroom
- 122 bedrooms
- 763 bedrooms
- 94 bedrooms
- 05+ bedrooms
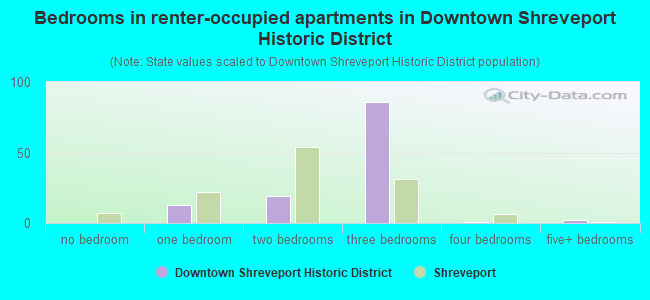
- Bedrooms in renter-occupied apartments in Downtown Shreveport Historic District
- 0no bedroom
- 131 bedroom
- 192 bedrooms
- 863 bedrooms
- 14 bedrooms
- 25+ bedrooms
Average number of cars or other vehicles available in houses/condos:
Average number of cars or other vehicles available in apartments:
| This neighborhood: | 2.0 |
| Shreveport: | 1.9 |
Average number of cars or other vehicles available in apartments:
| Here: | 1.2 |
| city: | 1.2 |
Percentage of units with a mortgage:
| Downtown Shreveport Historic District: | 68.6% |
| Shreveport: | 57.6% |
Average estimated value of detached houses in 2022 (91.9% of all units):
| Downtown Shreveport Historic District: | $106,576 |
| Louisiana: | $273,555 |
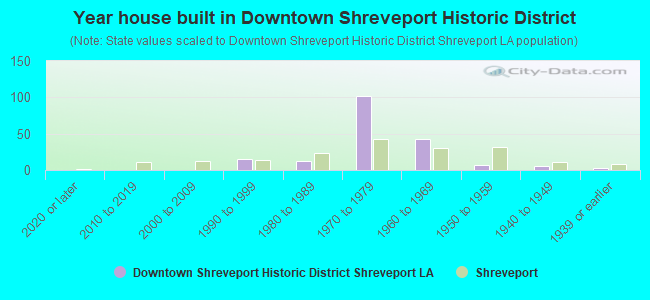
- Year house built in Downtown Shreveport Historic District
- 02020 or later
- 02010 to 2019
- 02000 to 2009
- 151990 to 1999
- 131980 to 1989
- 1021970 to 1979
- 421960 to 1969
- 71950 to 1959
- 51940 to 1949
- 31939 or earlier
City-data.com crime index for city in 2020 (higher means more crime):
| City: | 536.2 |
| U.S. average: | 219.5 |
Travel time to work (commute)
![Travel time to work (commute)]()
- 4Less than 5 minutes
- 105 to 9 minutes
- 610 to 14 minutes
- 9915 to 19 minutes
- 3620 to 24 minutes
- 1825 to 29 minutes
- 1530 to 34 minutes
- 745 to 59 minutes
- 660 to 89 minutes

Means of transportation to work
![Means of transportation to work]()
- 86.3%149Drove a car alone
- 12.7%22Carpooled
- 2.9%5Walked
- 2.9%5Other means

Time leaving home to go to work
![Time leaving home to go to work]()
- 3012:00 a.m. to 4:59 a.m.
- 35:00 a.m. to 5:29 a.m.
- 145:30 a.m. to 5:59 a.m.
- 296:00 a.m. to 6:29 a.m.
- 96:30 a.m. to 6:59 a.m.
- 117:00 a.m. to 7:29 a.m.
- 257:30 a.m. to 7:59 a.m.
- 198:00 a.m. to 8:29 a.m.
- 419:00 a.m. to 9:59 a.m.
- 110:00 a.m. to 10:59 a.m.
- 612:00 p.m. to 3:59 p.m.
- 84:00 p.m. to 11:59 p.m.

Occupations of males:
- Percentage of males in computer and mathematical occupations:
Here: 18.1% city: 2.0%
- Percentage of males in community and social services occupations:
Here: 7.6% city: 2.0%
- Percentage of males in education, training, and library occupations:
Here: 19.0% city: 4.1%
- Percentage of males in service occupations:
Here: 29.5% city: 20.6%
- Percentage of males in sales and office occupations:
Here: 12.4% city: 14.1%
- Percentage of males in construction, extraction, and maintenance occupations:
Here: 21.9% city: 7.8%
- Percentage of males in production occupations:
Here: 11.4% city: 6.5%
- Percentage of males in transportation occupations:
Here: 15.2% city: 7.4%
- Percentage of males in material moving occupations:
Here: 9.5% city: 6.3%
Occupations of females:
- Percentage of females in management occupations (except farmers):
Here: 9.3% city: 7.8%
- Percentage of females in business and financial operations occupations:
Here: 5.3% city: 4.1%
- Percentage of females in architecture and engineering occupations:
Here: 3.1% city: 0.3%
- Percentage of females in life, physical, and social science occupations:
Here: 3.7% city: 0.6%
- Percentage of females in community and social services occupations:
Here: 37.7% city: 3.5%
- Percentage of females in education, training, and library occupations:
Here: 11.2% city: 10.5%
- Percentage of females in healthcare practitioners and technical occupations:
Here: 5.9% city: 11.9%
- Percentage of females in service occupations:
Here: 14.0% city: 25.2%
- Percentage of females in sales and office occupations:
Here: 5.0% city: 26.9%
- Percentage of females in production occupations:
Here: 15.3% city: 1.7%
- Percentage of females in transportation occupations:
Here: 3.4% city: 1.7%
- Percentage of females in material moving occupations:
Here: 4.4% city: 1.3%
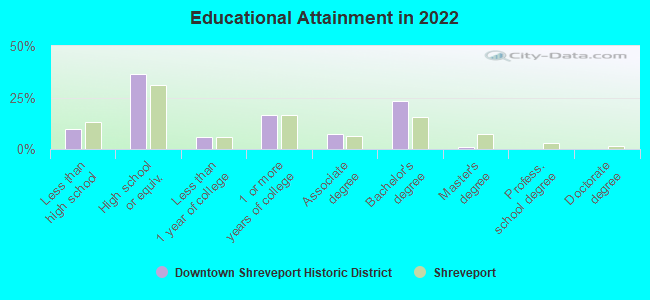
Education in this neighborhood (subdivision or community):
- Percentage of people 3 years and older in K-12 schools:
Downtown Shreveport Historic District: 40.2% Shreveport: 17.5%
- Percentage of people 3 years and older in undergraduate colleges:
Downtown Shreveport Historic District: 3.6% Shreveport: 4.5%
- Percentage of people 3 years and older in grad. or professional schools:
Downtown Shreveport Historic District: 8.1% Shreveport: 1.1%
- Percentage of students K-12 enrolled in private schools:
Downtown Shreveport Historic District: 2.8% Shreveport: 9.5%
Percentage of population below poverty level:
| Downtown Shreveport Historic District: | 36.5% |
| Shreveport: | 24.3% |
Median year owner moved in (as recorded in 2022):
Median year renter moved in (as recorded in 2022):
| Downtown Shreveport Historic District: | 2004 |
| Shreveport: | 2010 |
Median year renter moved in (as recorded in 2022):
| Downtown Shreveport Historic District: | 2015 |
| Shreveport: | 2020 |
Percentage of married-couple families with both working:
| Downtown Shreveport Historic District: | 100.0% |
| Shreveport: | 65.9% |
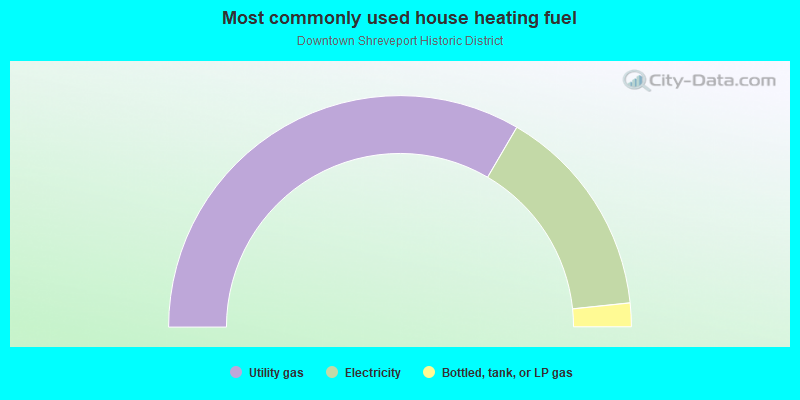
- 66.8%Utility gas
- 29.8%Electricity
- 3.3%Bottled, tank, or LP gas
Limited-access highways (interstate or state) in this neighborhood:
I- 20
Length: 1.15 miles
Direction: SW-NE
Direction: SW-NE
Highways in this neighborhood:
N Spring St (State Rte 1)
Length: 0.79 miles
Direction: SE-NW
Address range: 2 to 1005
Direction: SE-NW
Address range: 2 to 1005
State Rte 173 (Caddo St)
Length: 0.78 miles
Direction: SW-NE
Address range: 94 to 719
Direction: SW-NE
Address range: 94 to 719
US Hwy 80 (US Hwy 79, Texas St)
Length: 0.58 miles
Direction: SW-NE
Address range: 20 to 699
Direction: SW-NE
Address range: 20 to 699
US Hwy 71
Length: 0.48 miles
Direction: SE-NW
Address range: 200 to 699
Direction: SE-NW
Address range: 200 to 699
Market St (State Rte 1)
Length: 0.45 miles
Direction: SE-NW
Address range: 700 to 898
Direction: SE-NW
Address range: 700 to 898
Common St (State Rte 3036)
Length: 0.22 miles
Direction: SE-NW
Address range: 554 to 825
Direction: SE-NW
Address range: 554 to 825
Roads and streets:
Louisiana Ave
Length: 0.82 miles
Direction: SE-NW
Address range: 100 to 999
Direction: SE-NW
Address range: 100 to 999
Marshall St
Length: 0.79 miles
Direction: SE-NW
Address range: 100 to 1099
Direction: SE-NW
Address range: 100 to 1099
Lake St
Length: 0.74 miles
Directions: N-S, SW-NE
Address range: 1 to 699
Directions: N-S, SW-NE
Address range: 1 to 699
Commerce St
Length: 0.73 miles
Directions: N-S, SE-NW
Address range: 100 to 999
Directions: N-S, SE-NW
Address range: 100 to 999
Cotton St
Length: 0.69 miles
Directions: N-S, SW-NE
Address range: 1 to 799
Directions: N-S, SW-NE
Address range: 1 to 799
Crockett St
Length: 0.65 miles
Direction: SW-NE
Address range: 37 to 799
Direction: SW-NE
Address range: 37 to 799
Edwards St
Length: 0.63 miles
Direction: SE-NW
Address range: 100 to 899
Direction: SE-NW
Address range: 100 to 899
Mc Neil St
Length: 0.62 miles
Direction: SE-NW
Address range: 100 to 1299
Direction: SE-NW
Address range: 100 to 1299
Fannin St
Length: 0.60 miles
Direction: SW-NE
Address range: 1 to 699
Direction: SW-NE
Address range: 1 to 699
Milam St
Length: 0.60 miles
Direction: SW-NE
Address range: 75 to 799
Direction: SW-NE
Address range: 75 to 799
Clyde Fant Pkwy
Length: 0.53 miles
Direction: SE-NW
Address range: 200 to 899
Direction: SE-NW
Address range: 200 to 899
Travis St
Length: 0.50 miles
Direction: SW-NE
Address range: 100 to 699
Direction: SW-NE
Address range: 100 to 699
Cypress St
Length: 0.48 miles
Direction: SW-NE
Address range: 200 to 787
Direction: SW-NE
Address range: 200 to 787
Clyde Fant Memorial Pkwy
Length: 0.25 miles
Direction: SE-NW
Address range: 201 to 823
Direction: SE-NW
Address range: 201 to 823
Franklin St
Length: 0.19 miles
Directions: N-S, SE-NW, SW-NE
Address range: 300 to 499
Directions: N-S, SE-NW, SW-NE
Address range: 300 to 499
Fairfield Ave
Length: 0.18 miles
Directions: N-S, SW-NE
Address range: 674 to 745
Directions: N-S, SW-NE
Address range: 674 to 745
McNeil St
Length: 0.13 miles
Directions: N-S, SE-NW
Directions: N-S, SE-NW
Jones St
Length: 0.05 miles
Direction: SE-NW
Direction: SE-NW
N Louisiana Ave
Length: 0.04 miles
Direction: SE-NW
Address range: 100 to 107
Direction: SE-NW
Address range: 100 to 107
N Mc Neil St
Length: 0.04 miles
Direction: SE-NW
Address range: 109 to 199
Direction: SE-NW
Address range: 109 to 199
Cottage St
Length: 0.04 miles
Direction: SE-NW
Address range: 200 to 299
Direction: SE-NW
Address range: 200 to 299
Silver Lake Dr
Length: 0.04 miles
Direction: SE-NW
Address range: 1100 to 1149
Direction: SE-NW
Address range: 1100 to 1149
Railroad features:
Illinois Central RR
Length: 0.66 miles
Direction: SW-NE
Direction: SW-NE
Texas and Pacific Rlwy
Length: 0.56 miles
Directions: E-W, SE-NW, SW-NE
Directions: E-W, SE-NW, SW-NE
St Louis Southwestern Rlwy
Length: 0.43 miles
Direction: SE-NW
Direction: SE-NW
Railroad Spur
Length: 0.24 miles
Directions: E-W, SW-NE
Directions: E-W, SW-NE