Eastlake neighborhood in Denver, Colorado (CO), 80241 detailed profile
Settings
X


Business Search - 14 Million verified businesses
Area: 0.087 square miles
Population: 14,786
Population density:
| Eastlake: | 170,668 people per square mile |
| Denver: | 4,651 people per square mile |

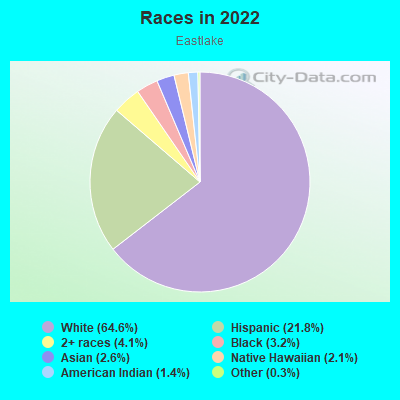
- 10,11664.6%White
- 3,41021.8%Hispanic or Latino
- 6364.1%Two or more races
- 4993.2%Black
- 4122.6%Asian
- 3232.1%Native Hawaiian and Other
Pacific Islander - 2161.4%American Indian
- 520.3%Some other race
Median household income in 2022:
| Eastlake: | $96,667 |
| Denver: | $88,213 |
Distribution of median household income
![Distribution of median household income]()
- 355Less than $10,000
- 295$10,000 to $19,999
- 243$20,000 to $29,999
- 498$30,000 to $39,999
- 573$40,000 to $49,999
- 496$50,000 to $59,999
- 657$60,000 to $74,999
- 925$75,000 to $99,999
- 762$100,000 to $124,999
- 647$125,000 to $149,999
- 516$150,000 to $199,999
- 475$200,000 or more

Distribution of owner-occupied house/condo value
![Distribution of owner-occupied house/condo value]()
- 885Less than $50,000
- 63$50,000 to $99,999
- 186$100,000 to $149,999
- 876$150,000 to $199,999
- 245$200,000 to $249,999
- 446$250,000 to $299,999
- 1,395$300,000 to $399,999
- 902$400,000 to $499,999
- 900$500,000 to $749,999
- 125$750,000 to $999,999
- 1,023$1,000,000 or more

Distribution of rent paid by renters
![Distribution of rent paid by renters]()
- 157Less than $100
- 242$200 to $299
- 454$300 to $399
- 123$400 to $499
- 30$500 to $599
- 79$800 to $899
- 626$900 to $999
- 4,015$1,000 to $1,249
- 563$1,250 to $1,499
- 992$1,500 to $1,999
- 648$2,000 or more

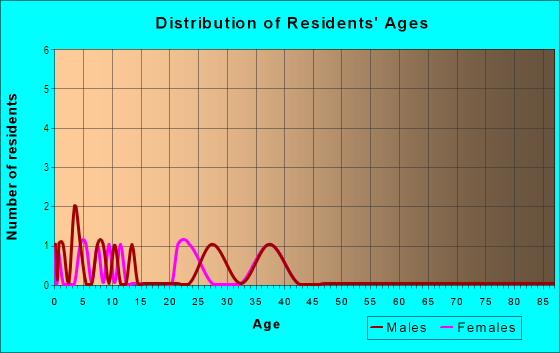
| Males: | 7,861 |
| Females: | 6,924 |
Males:
| This neighborhood: | 37.7 years |
| Whole city: | 35.2 years |
| This neighborhood: | 37.4 years |
| Whole city: | 35.1 years |
Average household size:
| Eastlake: | 7.5 people |
| Denver: | 28.0 people |
Percentage of family households:
| Eastlake: | 54.6% |
| Denver: | 35.1% |
| Here: | 47.6% |
| Denver: | 32.5% |
Percentage of married-couple families with children (among all households):
| Eastlake: | 22.7% |
| Denver: | 32.4% |
Percentage of single-mother households (among all households):
| Eastlake: | 12.9% |
| Denver: | 10.3% |
Percentage of never married males 15 years old and over:
Percentage of never married females 15 years old and over:
| Eastlake: | 17.8% |
| Denver: | 25.0% |
Percentage of never married females 15 years old and over:
| Eastlake: | 16.9% |
| city: | 20.8% |
Percentage of people that speak English not well or not at all:
| Eastlake: | 2.7% |
| Denver: | 3.9% |
Percentage of people born in this state:
Percentage of people born in another U.S. state:
Percentage of native residents but born outside the U.S.:
Percentage of foreign born residents:
| Here: | 55.3% |
| Denver: | 38.5% |
Percentage of people born in another U.S. state:
| Eastlake: | 34.4% |
| Denver: | 46.1% |
Percentage of native residents but born outside the U.S.:
| Here: | 1.2% |
| city: | 1.7% |
Percentage of foreign born residents:
| Here: | 9.1% |
| Denver: | 13.8% |

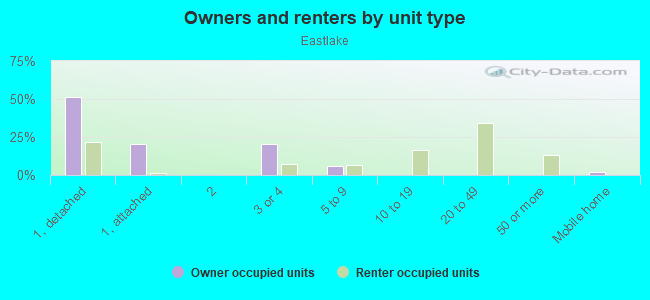
Owner-occupied
Renter-occupied


- Rooms in owner-occupied houses and condos in Eastlake
- 01 room
- 02 rooms
- 383 rooms
- 2994 rooms
- 7535 rooms
- 7636 rooms
- 1,0577 rooms
- 5298 rooms
- 8219+ rooms

- Rooms in renter-occupied apartments in Eastlake
- 4331 room
- 3072 rooms
- 6643 rooms
- 4234 rooms
- 3845 rooms
- 4256 rooms
- 2687 rooms
- 5688 rooms
- 1939+ rooms
Owner-occupied
Renter-occupied
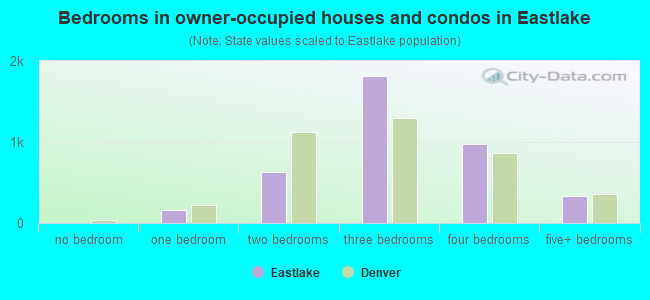
- Bedrooms in owner-occupied houses and condos in Eastlake
- 0no bedroom
- 1551 bedroom
- 6252 bedrooms
- 1,8193 bedrooms
- 9724 bedrooms
- 3335+ bedrooms
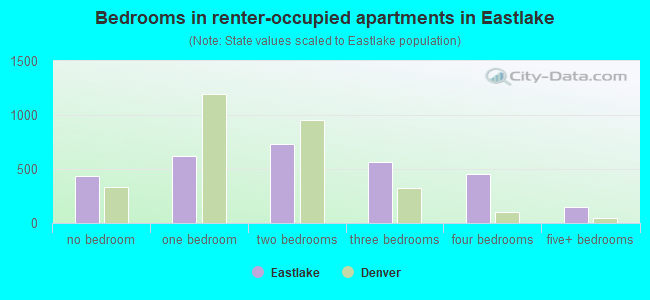
- Bedrooms in renter-occupied apartments in Eastlake
- 433no bedroom
- 6181 bedroom
- 7282 bedrooms
- 5673 bedrooms
- 4564 bedrooms
- 1525+ bedrooms
Average number of cars or other vehicles available in houses/condos:
Average number of cars or other vehicles available in apartments:
| This neighborhood: | 2.1 |
| Denver: | 1.9 |
Average number of cars or other vehicles available in apartments:
| Here: | |
| city: |
Percentage of units with a mortgage:
| Eastlake: | 79.3% |
| Denver: | 75.6% |
Average estimated value of detached houses in 2022 (68.0% of all units):
| Eastlake: | $467,970 |
| Colorado: | $676,667 |
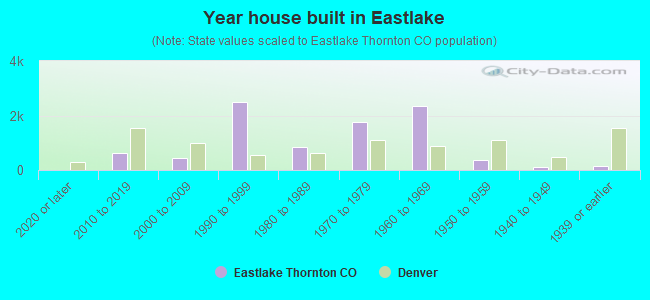
- Year house built in Eastlake
- 02020 or later
- 6292010 to 2019
- 4412000 to 2009
- 2,4971990 to 1999
- 8591980 to 1989
- 1,7631970 to 1979
- 2,3591960 to 1969
- 3711950 to 1959
- 1041940 to 1949
- 1561939 or earlier
City-data.com crime index for city in 2020 (higher means more crime):
| City: | 519.0 |
| U.S. average: | 219.5 |
Travel time to work (commute)
![Travel time to work (commute)]()
- 55Less than 5 minutes
- 2055 to 9 minutes
- 58310 to 14 minutes
- 69115 to 19 minutes
- 76520 to 24 minutes
- 79525 to 29 minutes
- 95130 to 34 minutes
- 34235 to 39 minutes
- 46940 to 44 minutes
- 65845 to 59 minutes
- 29760 to 89 minutes
- 27790 or more minutes

Means of transportation to work
![Means of transportation to work]()
- 75.3%5,358Drove a car alone
- 10.1%715Carpooled
- 5.4%382Bus
- 1.1%75Bicycle
- 3.2%227Walked
- 1.0%69Other means
- 10.2%722Worked at home

Time leaving home to go to work
![Time leaving home to go to work]()
- 38212:00 a.m. to 4:59 a.m.
- 1585:00 a.m. to 5:29 a.m.
- 5085:30 a.m. to 5:59 a.m.
- 9106:00 a.m. to 6:29 a.m.
- 6286:30 a.m. to 6:59 a.m.
- 8527:00 a.m. to 7:29 a.m.
- 3367:30 a.m. to 7:59 a.m.
- 4038:00 a.m. to 8:29 a.m.
- 2308:30 a.m. to 8:59 a.m.
- 2949:00 a.m. to 9:59 a.m.
- 13010:00 a.m. to 10:59 a.m.
- 2911:00 a.m. to 11:59 a.m.
- 75312:00 p.m. to 3:59 p.m.
- 3444:00 p.m. to 11:59 p.m.

Occupations of males:
- Percentage of males in management occupations (except farmers):
Here: 13.3% city: 15.4%
- Percentage of males in business and financial operations occupations:
Here: 7.6% city: 8.3%
- Percentage of males in computer and mathematical occupations:
Here: 1.9% city: 7.4%
- Percentage of males in architecture and engineering occupations:
Here: 6.8% city: 4.5%
- Percentage of males in education, training, and library occupations:
Here: 3.0% city: 3.1%
- Percentage of males in service occupations:
Here: 13.3% city: 11.9%
- Percentage of males in sales and office occupations:
Here: 9.8% city: 15.4%
- Percentage of males in construction, extraction, and maintenance occupations:
Here: 11.6% city: 8.0%
- Percentage of males in production occupations:
Here: 4.1% city: 3.2%
- Percentage of males in transportation occupations:
Here: 2.3% city: 4.2%
- Percentage of males in material moving occupations:
Here: 8.0% city: 3.5%
Occupations of females:
- Percentage of females in management occupations (except farmers):
Here: 8.4% city: 14.0%
- Percentage of females in business and financial operations occupations:
Here: 11.3% city: 10.0%
- Percentage of females in life, physical, and social science occupations:
Here: 1.7% city: 1.5%
- Percentage of females in legal occupations:
Here: 1.5% city: 2.4%
- Percentage of females in education, training, and library occupations:
Here: 9.0% city: 7.9%
- Percentage of females in healthcare practitioners and technical occupations:
Here: 4.2% city: 10.2%
- Percentage of females in service occupations:
Here: 23.3% city: 16.2%
- Percentage of females in sales and office occupations:
Here: 34.5% city: 21.4%
- Percentage of females in production occupations:
Here: 1.8% city: 1.7%
- Percentage of females in material moving occupations:
Here: 1.4% city: 1.4%
Education in this neighborhood (subdivision or community):
- Percentage of people 3 years and older in K-12 schools:
Eastlake: 24.2% Denver: 12.7%
- Percentage of people 3 years and older in undergraduate colleges:
Eastlake: 6.9% Denver: 4.1%
- Percentage of people 3 years and older in grad. or professional schools:
Eastlake: 5.3% Denver: 2.2%
- Percentage of students K-12 enrolled in private schools:
Eastlake: 47.6% Denver: 11.0%
Percentage of population below poverty level:
| Eastlake: | 7.8% |
| Denver: | 11.8% |
Median year owner moved in (as recorded in 2022):
| Eastlake: | 2083 |
| Denver: | 2014 |
Percentage of married-couple families with both working:
| Eastlake: | 90.8% |
| Denver: | 74.1% |

- 58.1%Utility gas
- 27.0%Electricity
- 4.5%Bottled, tank, or LP gas
- 3.9%No fuel used
- 3.0%Wood
- 2.2%Other fuel
- 1.4%Solar energy