Easton Forest neighborhood in Norfolk, Virginia (VA), 23502 detailed profile
Settings
X

Business Search - 14 Million verified businesses
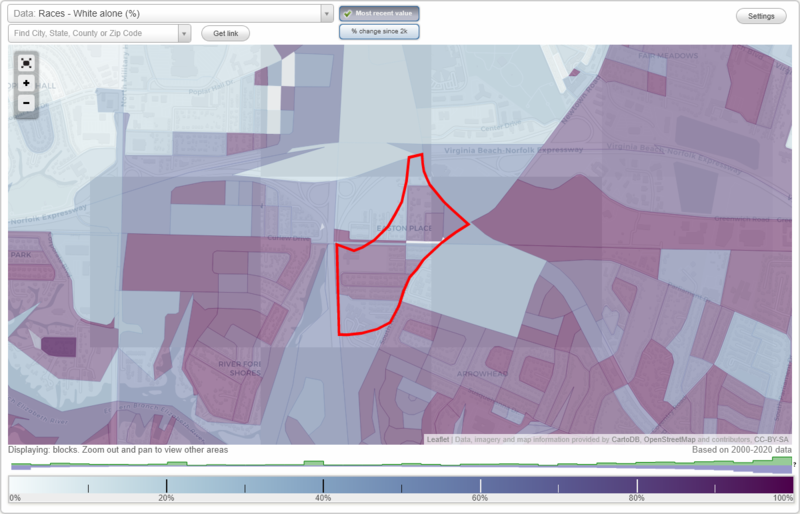
Area: 0.175 square miles
Population: 809
Population density:
| Easton Forest: | 4,624 people per square mile |
| Norfolk: | 4,337 people per square mile |

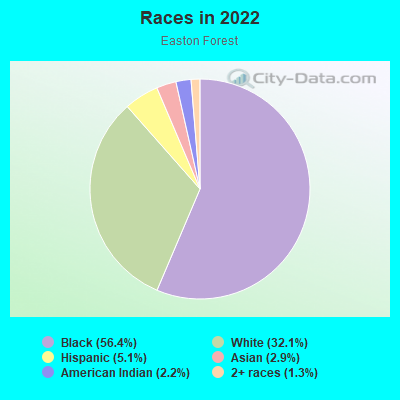
- 46556.4%Black
- 26532.1%White
- 425.1%Hispanic or Latino
- 242.9%Asian
- 182.2%American Indian
- 111.3%Two or more races
Median household income in 2022:
| Easton Forest: | $81,631 |
| Norfolk: | $61,090 |
Distribution of median household income
![Distribution of median household income]()
- 28Less than $10,000
- 19$10,000 to $19,999
- 32$20,000 to $29,999
- 6$30,000 to $39,999
- 10$40,000 to $49,999
- 34$50,000 to $59,999
- 234$60,000 to $74,999
- 10$75,000 to $99,999
- 123$100,000 to $124,999
- 9$125,000 to $149,999
- 51$150,000 to $199,999
- 20$200,000 or more

Distribution of owner-occupied house/condo value
![Distribution of owner-occupied house/condo value]()
- 7Less than $50,000
- 25$50,000 to $99,999
- 9$100,000 to $149,999
- 35$150,000 to $199,999
- 47$200,000 to $249,999
- 11$250,000 to $299,999
- 88$300,000 to $399,999
- 18$400,000 to $499,999
- 60$500,000 to $749,999

Distribution of rent paid by renters
![Distribution of rent paid by renters]()
- 12$200 to $299
- 5$300 to $399
- 6$600 to $699
- 12$700 to $799
- 6$800 to $899
- 47$900 to $999
- 18$1,000 to $1,249
- 22$1,250 to $1,499
- 4$1,500 to $1,999
- 3$2,000 or more

Median rent in 2022:
| Easton Forest: | $1,345 |
| Norfolk: | $1,035 |
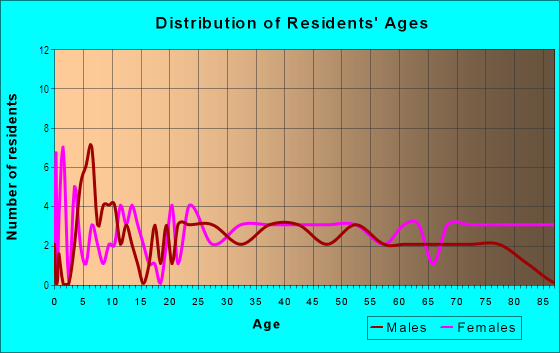
| Males: | 350 |
| Females: | 459 |
Males:
| This neighborhood: | 34.0 years |
| Whole city: | 31.3 years |
| This neighborhood: | 41.2 years |
| Whole city: | 34.4 years |
Average household size:
| Easton Forest: | 2.5 people |
| Norfolk: | 2.3 people |
Percentage of family households:
| Easton Forest: | 42.6% |
| Norfolk: | 41.3% |
| Here: | 47.2% |
| Norfolk: | 31.7% |
Percentage of married-couple families with children (among all households):
| Easton Forest: | 34.9% |
| Norfolk: | 20.2% |
Percentage of single-mother households (among all households):
| Easton Forest: | 29.0% |
| Norfolk: | 16.3% |
Percentage of never married males 15 years old and over:
Percentage of never married females 15 years old and over:
| Easton Forest: | 10.2% |
| Norfolk: | 25.4% |
Percentage of never married females 15 years old and over:
| Easton Forest: | 17.6% |
| city: | 20.5% |
Percentage of people that speak English not well or not at all:
| Easton Forest: | 0.5% |
| Norfolk: | 1.4% |
Percentage of people born in this state:
Percentage of people born in another U.S. state:
Percentage of native residents but born outside the U.S.:
Percentage of foreign born residents:
| Here: | 40.2% |
| Norfolk: | 51.1% |
Percentage of people born in another U.S. state:
| Easton Forest: | 51.7% |
| Norfolk: | 40.8% |
Percentage of native residents but born outside the U.S.:
| Here: | 0.8% |
| city: | 1.6% |
Percentage of foreign born residents:
| Here: | 7.3% |
| Norfolk: | 6.5% |
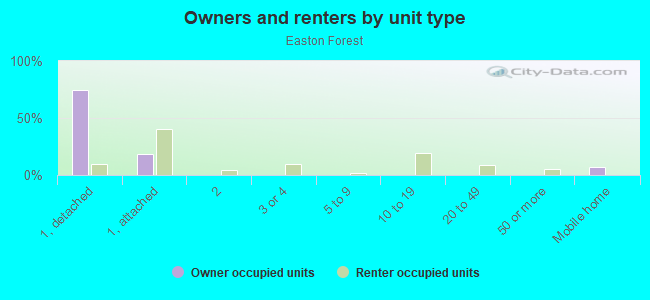
Owner-occupied
Renter-occupied

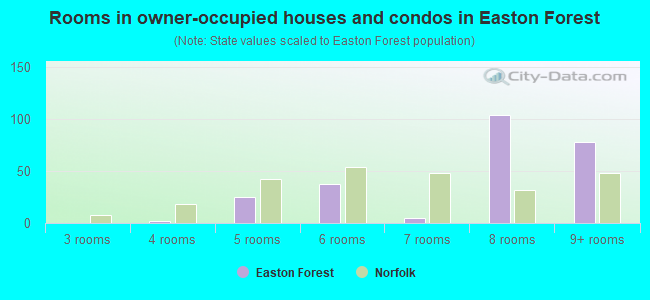
- Rooms in owner-occupied houses and condos in Easton Forest
- 01 room
- 02 rooms
- 03 rooms
- 24 rooms
- 255 rooms
- 386 rooms
- 57 rooms
- 1048 rooms
- 789+ rooms
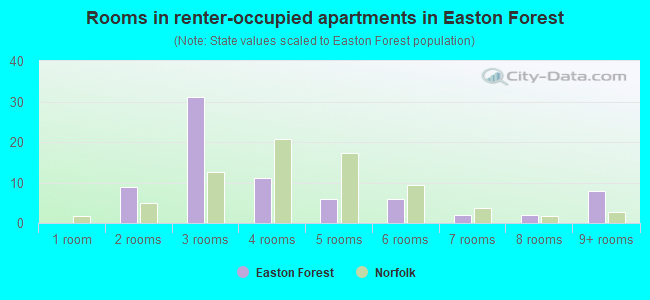
- Rooms in renter-occupied apartments in Easton Forest
- 01 room
- 92 rooms
- 313 rooms
- 114 rooms
- 65 rooms
- 66 rooms
- 27 rooms
- 28 rooms
- 89+ rooms
Owner-occupied
Renter-occupied
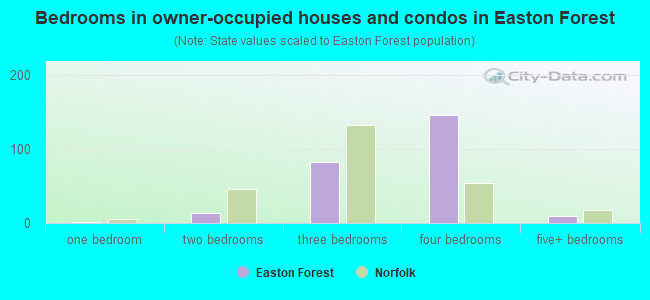
- Bedrooms in owner-occupied houses and condos in Easton Forest
- 0no bedroom
- 21 bedroom
- 132 bedrooms
- 833 bedrooms
- 1464 bedrooms
- 105+ bedrooms
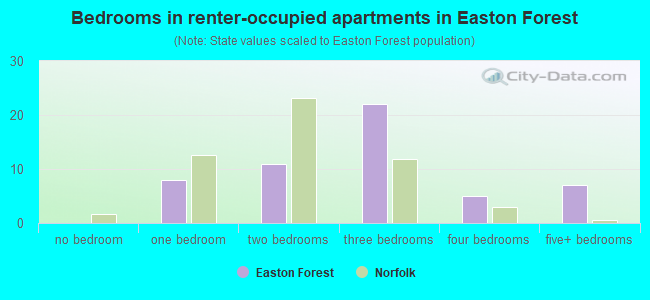
- Bedrooms in renter-occupied apartments in Easton Forest
- 0no bedroom
- 81 bedroom
- 112 bedrooms
- 223 bedrooms
- 54 bedrooms
- 75+ bedrooms
Average number of cars or other vehicles available in houses/condos:
Average number of cars or other vehicles available in apartments:
| This neighborhood: | 2.3 |
| Norfolk: | 2.0 |
Average number of cars or other vehicles available in apartments:
| Here: | 1.5 |
| city: | 1.3 |
Percentage of units with a mortgage:
| Easton Forest: | 83.5% |
| Norfolk: | 70.0% |
Average estimated value of detached houses in 2022 (96.2% of all units):
| Easton Forest: | $381,075 |
| Norfolk: | $337,508 |
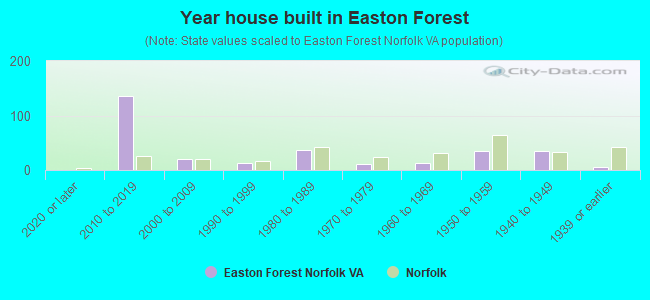
- Year house built in Easton Forest
- 02020 or later
- 1352010 to 2019
- 202000 to 2009
- 131990 to 1999
- 361980 to 1989
- 111970 to 1979
- 131960 to 1969
- 341950 to 1959
- 341940 to 1949
- 61939 or earlier
City-data.com crime index for city in 2020 (higher means more crime):
| City: | 327.9 |
| U.S. average: | 219.5 |
Travel time to work (commute)
![Travel time to work (commute)]()
- 8Less than 5 minutes
- 35 to 9 minutes
- 3210 to 14 minutes
- 10515 to 19 minutes
- 13420 to 24 minutes
- 1125 to 29 minutes
- 3030 to 34 minutes
- 335 to 39 minutes
- 140 to 44 minutes
- 545 to 59 minutes
- 360 to 89 minutes
- 4190 or more minutes

Means of transportation to work
![Means of transportation to work]()
- 66.6%293Drove a car alone
- 2.5%11Carpooled
- 1.6%7Bus
- 10.7%47Light rail, streetcar or trolley
- 1.6%7Motorcycle
- 1.4%6Walked
- 1.8%8Other means
- 15.9%70Worked at home

Time leaving home to go to work
![Time leaving home to go to work]()
- 1112:00 a.m. to 4:59 a.m.
- 545:00 a.m. to 5:29 a.m.
- 185:30 a.m. to 5:59 a.m.
- 416:00 a.m. to 6:29 a.m.
- 136:30 a.m. to 6:59 a.m.
- 257:00 a.m. to 7:29 a.m.
- 457:30 a.m. to 7:59 a.m.
- 468:00 a.m. to 8:29 a.m.
- 118:30 a.m. to 8:59 a.m.
- 149:00 a.m. to 9:59 a.m.
- 4210:00 a.m. to 10:59 a.m.
- 4511:00 a.m. to 11:59 a.m.
- 1312:00 p.m. to 3:59 p.m.
- 64:00 p.m. to 11:59 p.m.

Occupations of males:
- Percentage of males in management occupations (except farmers):
Here: 2.5% city: 8.2%
- Percentage of males in business and financial operations occupations:
Here: 2.1% city: 4.4%
- Percentage of males in computer and mathematical occupations:
Here: 3.6% city: 4.2%
- Percentage of males in architecture and engineering occupations:
Here: 7.4% city: 3.7%
- Percentage of males in community and social services occupations:
Here: 1.2% city: 1.3%
- Percentage of males in legal occupations:
Here: 13.9% city: 1.0%
- Percentage of males in arts, design, entertainment, sports, and media occupations:
Here: 1.8% city: 2.2%
- Percentage of males in sales and office occupations:
Here: 4.4% city: 15.6%
- Percentage of males in construction, extraction, and maintenance occupations:
Here: 3.3% city: 9.8%
- Percentage of males in production occupations:
Here: 6.7% city: 6.5%
Occupations of females:
- Percentage of females in management occupations (except farmers):
Here: 1.3% city: 7.7%
- Percentage of females in computer and mathematical occupations:
Here: 1.3% city: 1.7%
- Percentage of females in community and social services occupations:
Here: 29.7% city: 3.1%
- Percentage of females in arts, design, entertainment, sports, and media occupations:
Here: 4.3% city: 1.3%
- Percentage of females in healthcare practitioners and technical occupations:
Here: 3.5% city: 9.6%
- Percentage of females in service occupations:
Here: 29.7% city: 22.3%
- Percentage of females in sales and office occupations:
Here: 20.6% city: 28.7%
- Percentage of females in production occupations:
Here: 2.6% city: 2.7%
- Percentage of females in transportation occupations:
Here: 2.1% city: 1.6%
- Percentage of females in material moving occupations:
Here: 2.6% city: 2.4%
Percentage of people 16-64 in Armed Forces:
| Easton Forest: | 6.8% |
| Norfolk: | 15.8% |
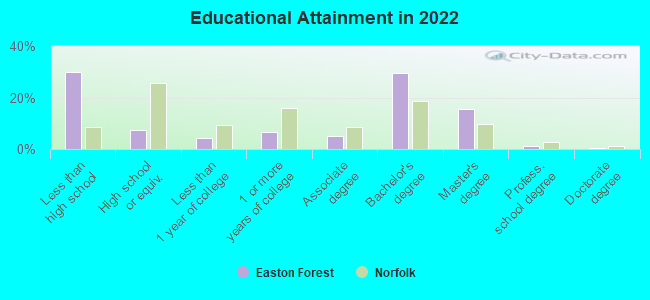
Education in this neighborhood (subdivision or community):
- Percentage of people 3 years and older in K-12 schools:
Easton Forest: 12.7% Norfolk: 14.3%
- Percentage of people 3 years and older in undergraduate colleges:
Easton Forest: 1.1% Norfolk: 8.0%
- Percentage of people 3 years and older in grad. or professional schools:
Easton Forest: 7.6% Norfolk: 2.1%
- Percentage of students K-12 enrolled in private schools:
Easton Forest: 95.0% Norfolk: 16.2%
Percentage of population below poverty level:
| Easton Forest: | 15.5% |
| Norfolk: | 17.7% |
Median year owner moved in (as recorded in 2022):
Median year renter moved in (as recorded in 2022):
| Easton Forest: | 2011 |
| Norfolk: | 2013 |
Median year renter moved in (as recorded in 2022):
| Easton Forest: | 2017 |
| Norfolk: | 2020 |
Percentage of married-couple families with both working:
| Easton Forest: | 97.0% |
| Norfolk: | 65.5% |
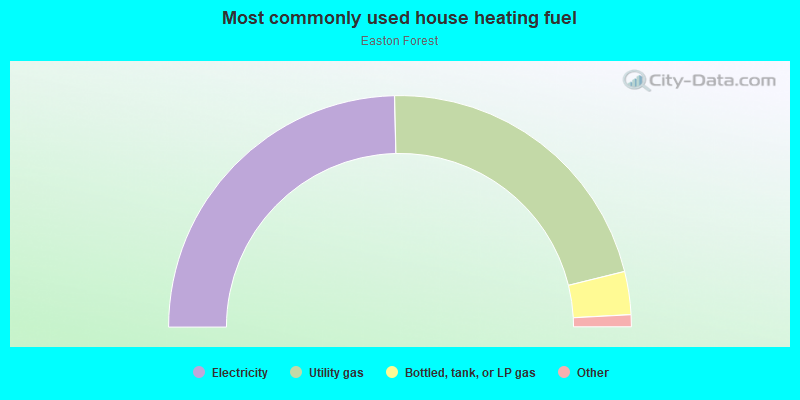
- 49.2%Electricity
- 43.0%Utility gas
- 6.0%Bottled, tank, or LP gas
- 0.9%No fuel used
- 0.8%Fuel oil, kerosene, etc.
Roads and streets:
Curlew Dr
Length: 0.76 miles
Directions: E-W, N-S, SE-NW, SW-NE
Address range: 6050 to 6298
Directions: E-W, N-S, SE-NW, SW-NE
Address range: 6050 to 6298
S Newtown Rd
Length: 0.46 miles
Direction: SW-NE
Address range: 116 to 217
Direction: SW-NE
Address range: 116 to 217
Edison Ave
Length: 0.39 miles
Directions: E-W, N-S, SE-NW, SW-NE
Address range: 100 to 6199
Directions: E-W, N-S, SE-NW, SW-NE
Address range: 100 to 6199
Abilene Ave
Length: 0.31 miles
Direction: N-S
Address range: 100 to 199
Direction: N-S
Address range: 100 to 199
Ivor Ave
Length: 0.25 miles
Direction: E-W
Address range: 6000 to 6199
Direction: E-W
Address range: 6000 to 6199
Stephenson Ave
Length: 0.23 miles
Directions: E-W, SE-NW
Address range: 6000 to 6199
Directions: E-W, SE-NW
Address range: 6000 to 6199
Newark Ave
Length: 0.15 miles
Direction: E-W
Address range: 6100 to 6199
Direction: E-W
Address range: 6100 to 6199
Houston Ave
Length: 0.12 miles
Directions: E-W, N-S, SW-NE
Address range: 100 to 139
Directions: E-W, N-S, SW-NE
Address range: 100 to 139
Foresttown Dr
Length: 0.12 miles
Directions: E-W, N-S, SW-NE
Address range: 6000 to 6099
Directions: E-W, N-S, SW-NE
Address range: 6000 to 6099
Lyndhurst Ave
Length: 0.11 miles
Direction: E-W
Address range: 6100 to 6142
Direction: E-W
Address range: 6100 to 6142
Bristol Ave
Length: 0.11 miles
Direction: N-S
Address range: 100 to 153
Direction: N-S
Address range: 100 to 153
Amarillo Ave
Length: 0.10 miles
Direction: N-S
Address range: 100 to 139
Direction: N-S
Address range: 100 to 139
Bangor Ave
Length: 0.08 miles
Direction: N-S
Address range: 100 to 143
Direction: N-S
Address range: 100 to 143
Cleveland St
Length: 0.06 miles
Direction: E-W
Address range: 6200 to 6299
Direction: E-W
Address range: 6200 to 6299
Blackstone St
Length: 0.04 miles
Direction: E-W
Address range: 6100 to 6160
Direction: E-W
Address range: 6100 to 6160
Railroad features:
Norfolk Southern Rlwy
Length: 0.32 miles
Direction: E-W
Direction: E-W
Roads and streets:
S Newtown Rd
Length: 0.46 miles
Direction: SW-NE
Address range: 116 to 217
Direction: SW-NE
Address range: 116 to 217