Flatirons neighborhood in Boulder, Colorado (CO), 80302 detailed profile
Settings
X


Business Search - 14 Million verified businesses
Area: 0.214 square miles
Population: 2,255
Population density:
| Flatirons: | 10,514 people per square mile |
| Boulder: | 4,328 people per square mile |

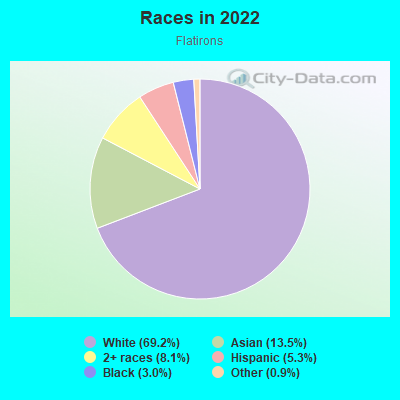
- 1,61869.2%White
- 31613.5%Asian
- 1898.1%Two or more races
- 1235.3%Hispanic or Latino
- 713.0%Black
- 200.9%Some other race
Median household income in 2022:
| Flatirons: | $30,571 |
| Boulder: | $81,608 |
Distribution of median household income
![Distribution of median household income]()
- 161Less than $10,000
- 290$10,000 to $19,999
- 80$20,000 to $29,999
- 171$30,000 to $39,999
- 115$40,000 to $49,999
- 28$50,000 to $59,999
- 136$60,000 to $74,999
- 32$75,000 to $99,999
- 120$100,000 to $124,999
- 29$125,000 to $149,999
- 121$150,000 to $199,999
- 110$200,000 or more

Distribution of owner-occupied house/condo value
![Distribution of owner-occupied house/condo value]()
- 45$50,000 to $99,999
- 8$100,000 to $149,999
- 49$150,000 to $199,999
- 109$300,000 to $399,999
- 63$400,000 to $499,999
- 137$500,000 to $749,999
- 30$750,000 to $999,999
- 77$1,000,000 or more

Distribution of rent paid by renters
![Distribution of rent paid by renters]()
- 22$100 to $199
- 21$200 to $299
- 11$300 to $399
- 17$400 to $499
- 241$500 to $599
- 93$800 to $899
- 26$900 to $999
- 221$1,000 to $1,249
- 364$1,250 to $1,499
- 75$1,500 to $1,999
- 208$2,000 or more

Median rent in 2022:
| Flatirons: | $1,393 |
| Boulder: | $1,700 |
| Males: | 826 |
| Females: | 1,429 |
Males:
| This neighborhood: | 25.8 years |
| Whole city: | 28.3 years |
| This neighborhood: | 23.8 years |
| Whole city: | 29.2 years |
Average household size:
| Flatirons: | 11.7 people |
| Boulder: | 2.1 people |
Percentage of family households:
| Flatirons: | 11.3% |
| Boulder: | 26.9% |
| Here: | 8.5% |
| Boulder: | 30.4% |
Percentage of married-couple families with children (among all households):
| Flatirons: | 53.3% |
| Boulder: | 32.8% |
Percentage of single-mother households (among all households):
| Flatirons: | 35.1% |
| Boulder: | 6.3% |
Percentage of never married males 15 years old and over:
Percentage of never married females 15 years old and over:
| Flatirons: | 29.6% |
| Boulder: | 32.7% |
Percentage of never married females 15 years old and over:
| Flatirons: | 51.6% |
| city: | 28.3% |
Percentage of people that speak English not well or not at all:
| Flatirons: | 0.1% |
| Boulder: | 1.0% |
Percentage of people born in this state:
Percentage of people born in another U.S. state:
Percentage of native residents but born outside the U.S.:
Percentage of foreign born residents:
| Here: | 29.5% |
| Boulder: | 28.3% |
Percentage of people born in another U.S. state:
| Flatirons: | 61.1% |
| Boulder: | 60.5% |
Percentage of native residents but born outside the U.S.:
| Here: | 0.7% |
| city: | 2.1% |
Percentage of foreign born residents:
| Here: | 8.6% |
| Boulder: | 9.1% |
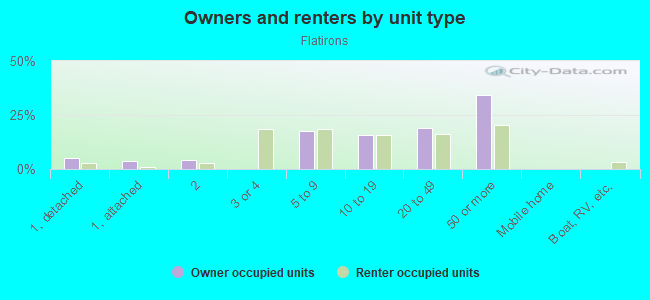
Owner-occupied
Renter-occupied

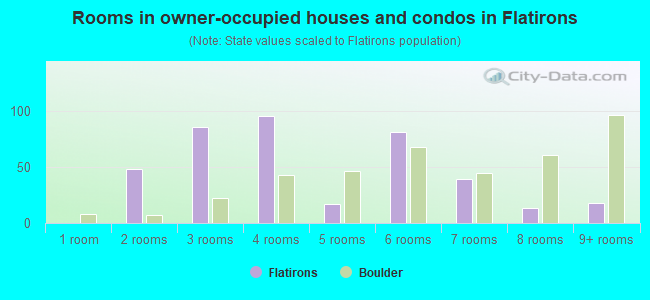
- Rooms in owner-occupied houses and condos in Flatirons
- 01 room
- 482 rooms
- 853 rooms
- 954 rooms
- 175 rooms
- 816 rooms
- 397 rooms
- 138 rooms
- 189+ rooms
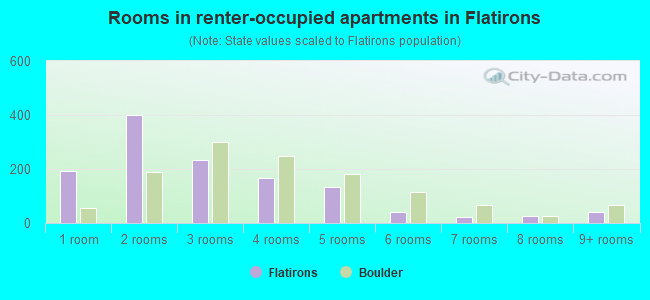
- Rooms in renter-occupied apartments in Flatirons
- 1931 room
- 3992 rooms
- 2343 rooms
- 1664 rooms
- 1325 rooms
- 396 rooms
- 237 rooms
- 268 rooms
- 419+ rooms
Owner-occupied
Renter-occupied
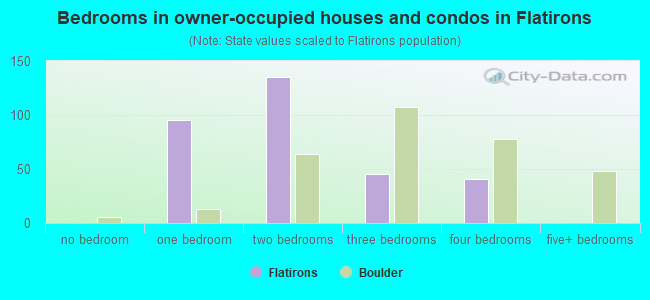
- Bedrooms in owner-occupied houses and condos in Flatirons
- 0no bedroom
- 951 bedroom
- 1352 bedrooms
- 453 bedrooms
- 414 bedrooms
- 05+ bedrooms
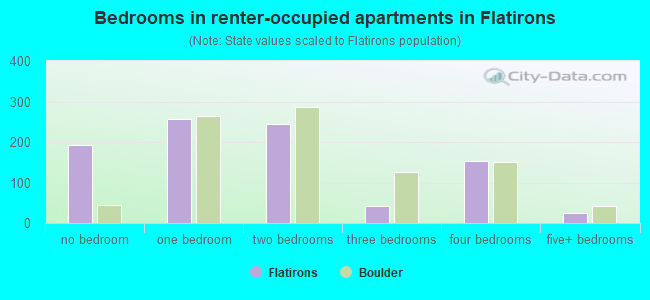
- Bedrooms in renter-occupied apartments in Flatirons
- 193no bedroom
- 2571 bedroom
- 2442 bedrooms
- 433 bedrooms
- 1524 bedrooms
- 245+ bedrooms
Average number of cars or other vehicles available in houses/condos:
Average number of cars or other vehicles available in apartments:
| This neighborhood: | 1.3 |
| Boulder: | 1.8 |
Average number of cars or other vehicles available in apartments:
| Here: | 1.2 |
| city: | 1.6 |
Percentage of units with a mortgage:
| Flatirons: | 51.0% |
| Boulder: | 60.5% |
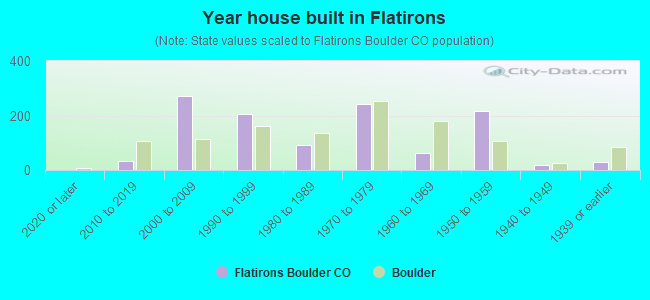
- Year house built in Flatirons
- 02020 or later
- 322010 to 2019
- 2732000 to 2009
- 2051990 to 1999
- 911980 to 1989
- 2421970 to 1979
- 631960 to 1969
- 2181950 to 1959
- 201940 to 1949
- 311939 or earlier
City-data.com crime index for city in 2020 (higher means more crime):
| City: | 275.1 |
| U.S. average: | 219.5 |
Travel time to work (commute)
![Travel time to work (commute)]()
- 16Less than 5 minutes
- 965 to 9 minutes
- 17310 to 14 minutes
- 12915 to 19 minutes
- 10720 to 24 minutes
- 2225 to 29 minutes
- 1130 to 34 minutes
- 735 to 39 minutes
- 7345 to 59 minutes
- 2060 to 89 minutes
- 11390 or more minutes

Means of transportation to work
![Means of transportation to work]()
- 46.5%572Drove a car alone
- 1.3%16Carpooled
- 4.1%51Bus
- 2.9%36Bicycle
- 30.2%372Walked
- 0.2%2Other means
- 16.0%197Worked at home

Time leaving home to go to work
![Time leaving home to go to work]()
- 1012:00 a.m. to 4:59 a.m.
- 95:00 a.m. to 5:29 a.m.
- 75:30 a.m. to 5:59 a.m.
- 1566:00 a.m. to 6:29 a.m.
- 216:30 a.m. to 6:59 a.m.
- 517:00 a.m. to 7:29 a.m.
- 397:30 a.m. to 7:59 a.m.
- 488:00 a.m. to 8:29 a.m.
- 558:30 a.m. to 8:59 a.m.
- 1129:00 a.m. to 9:59 a.m.
- 3010:00 a.m. to 10:59 a.m.
- 3211:00 a.m. to 11:59 a.m.
- 13112:00 p.m. to 3:59 p.m.
- 784:00 p.m. to 11:59 p.m.

Occupations of males:
- Percentage of males in management occupations (except farmers):
Here: 9.8% city: 12.9%
- Percentage of males in business and financial operations occupations:
Here: 5.8% city: 7.6%
- Percentage of males in computer and mathematical occupations:
Here: 14.2% city: 10.0%
- Percentage of males in architecture and engineering occupations:
Here: 15.5% city: 6.1%
- Percentage of males in life, physical, and social science occupations:
Here: 5.5% city: 6.1%
- Percentage of males in legal occupations:
Here: 6.2% city: 2.1%
- Percentage of males in education, training, and library occupations:
Here: 3.7% city: 8.1%
- Percentage of males in arts, design, entertainment, sports, and media occupations:
Here: 6.0% city: 3.3%
- Percentage of males in service occupations:
Here: 12.1% city: 14.4%
- Percentage of males in sales and office occupations:
Here: 13.8% city: 14.5%
- Percentage of males in construction, extraction, and maintenance occupations:
Here: 5.5% city: 2.8%
- Percentage of males in transportation occupations:
Here: 1.8% city: 2.5%
Occupations of females:
- Percentage of females in management occupations (except farmers):
Here: 9.3% city: 8.8%
- Percentage of females in life, physical, and social science occupations:
Here: 11.0% city: 4.7%
- Percentage of females in legal occupations:
Here: 1.6% city: 1.4%
- Percentage of females in education, training, and library occupations:
Here: 28.8% city: 13.1%
- Percentage of females in service occupations:
Here: 15.5% city: 20.9%
- Percentage of females in sales and office occupations:
Here: 31.2% city: 19.4%
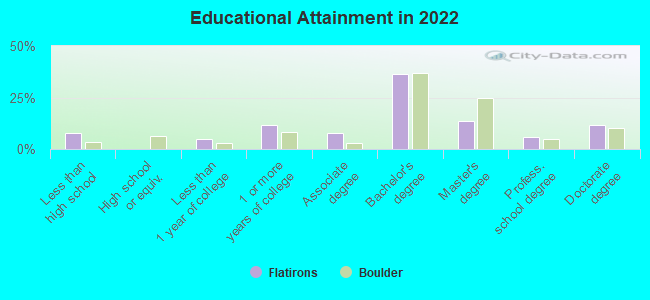
Education in this neighborhood (subdivision or community):
- Percentage of people 3 years and older in K-12 schools:
Flatirons: 17.6% Boulder: 8.8%
- Percentage of people 3 years and older in undergraduate colleges:
Flatirons: 41.6% Boulder: 28.2%
- Percentage of people 3 years and older in grad. or professional schools:
Flatirons: 14.6% Boulder: 6.1%
- Percentage of students K-12 enrolled in private schools:
Flatirons: 0.0% Boulder: 8.5%
Percentage of population below poverty level:
| Flatirons: | 47.3% |
| Boulder: | 24.1% |
Median year owner moved in (as recorded in 2022):
Median year renter moved in (as recorded in 2022):
| Flatirons: | 2015 |
| Boulder: | 2012 |
Median year renter moved in (as recorded in 2022):
| Flatirons: | 2019 |
| Boulder: | 2022 |
Percentage of married-couple families with both working:
| Flatirons: | 112.1% |
| Boulder: | 76.2% |
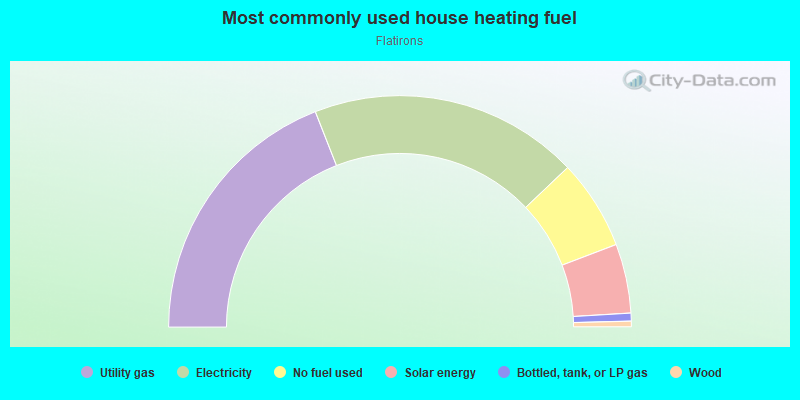
- 38.1%Utility gas
- 37.7%Electricity
- 12.6%No fuel used
- 9.7%Solar energy
- 1.1%Bottled, tank, or LP gas
- 0.8%Wood
Roads and streets:
Marine St
Length: 0.53 miles
Directions: E-W, SE-NW
Address range: 400 to 848
Directions: E-W, SE-NW
Address range: 400 to 848
Pleasant St
Length: 0.52 miles
Directions: E-W, SE-NW
Address range: 400 to 849
Directions: E-W, SE-NW
Address range: 400 to 849
7th St
Length: 0.44 miles
Direction: N-S
Address range: 1100 to 1746
Direction: N-S
Address range: 1100 to 1746
University Ave
Length: 0.43 miles
Directions: E-W, SW-NE
Address range: 400 to 814
Directions: E-W, SW-NE
Address range: 400 to 814
6th St
Length: 0.31 miles
Direction: N-S
Address range: 1100 to 1599
Direction: N-S
Address range: 1100 to 1599
College Ave
Length: 0.28 miles
Directions: E-W, SE-NW
Address range: 400 to 850
Directions: E-W, SE-NW
Address range: 400 to 850
Arapahoe Ave
Length: 0.24 miles
Direction: E-W
Address range: 339 to 899
Direction: E-W
Address range: 339 to 899
5th St
Length: 0.24 miles
Direction: N-S
Address range: 1300 to 1699
Direction: N-S
Address range: 1300 to 1699
8th St
Length: 0.16 miles
Direction: N-S
Address range: 1300 to 1632
Direction: N-S
Address range: 1300 to 1632
Marshall St
Length: 0.16 miles
Directions: N-S, SE-NW, SW-NE
Address range: 1249 to 1399
Directions: N-S, SE-NW, SW-NE
Address range: 1249 to 1399
Dean Pl
Length: 0.14 miles
Directions: E-W, N-S, SW-NE
Address range: 1200 to 1299
Directions: E-W, N-S, SW-NE
Address range: 1200 to 1299
Hapgood St
Length: 0.14 miles
Direction: E-W
Address range: 400 to 599
Direction: E-W
Address range: 400 to 599
Pennsylvania Ave
Length: 0.11 miles
Direction: E-W
Address range: 600 to 699
Direction: E-W
Address range: 600 to 699
Streamside Dr (Streamside Ln)
Length: 0.11 miles
Directions: E-W, SW-NE
Address range: 610 to 799
Directions: E-W, SW-NE
Address range: 610 to 799
Jay St
Length: 0.09 miles
Direction: N-S
Address range: 1100 to 1299
Direction: N-S
Address range: 1100 to 1299
4th St
Length: 0.09 miles
Directions: E-W, N-S, SE-NW
Address range: 1600 to 1699
Directions: E-W, N-S, SE-NW
Address range: 1600 to 1699
9th St
Length: 0.07 miles
Direction: N-S
Address range: 1700 to 1756
Direction: N-S
Address range: 1700 to 1756
Pleasant Street Ct
Length: 0.03 miles
Direction: N-S
Address range: 1300 to 1399
Direction: N-S
Address range: 1300 to 1399
Streamside Ln
Length: 0.02 miles
Direction: E-W
Direction: E-W
Other features:
Anderson Ditch Extd
Length: 0.59 miles
Directions: E-W, SE-NW
Directions: E-W, SE-NW
Other features:
Gregory Crk
Length: 0.55 miles
Directions: N-S, SW-NE
Directions: N-S, SW-NE
Boulder Crk
Length: 0.23 miles
Directions: E-W, SE-NW
Directions: E-W, SE-NW