Fourth Street (4th Street) neighborhood in Berkeley, California (CA), 94710 detailed profile
Settings
X

Business Search - 14 Million verified businesses
Area: 0.099 square miles
Population: 383
Population density:
| Fourth Street (4th Street): | 3,856 people per square mile |
| Berkeley: | 11,372 people per square mile |

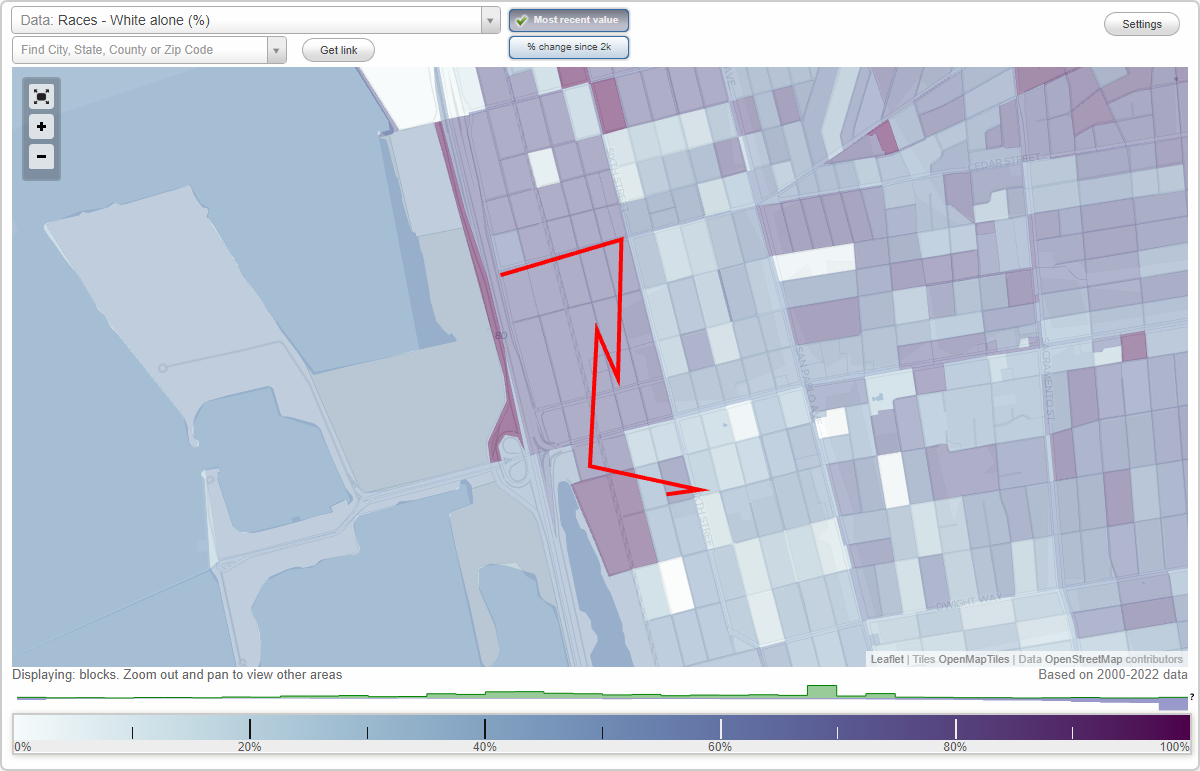
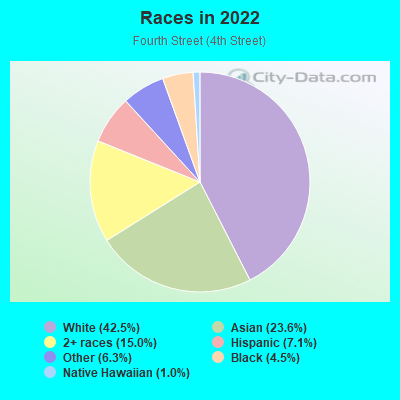
- 16242.5%White
- 9023.6%Asian
- 5715.0%Two or more races
- 277.1%Hispanic or Latino
- 246.3%Some other race
- 174.5%Black
- 41.0%Native Hawaiian and Other
Pacific Islander
Median household income in 2022:
| Fourth Street (4th Street): | $156,647 |
| Berkeley: | $94,846 |
Distribution of median household income
![Distribution of median household income]()
- 6Less than $10,000
- 8$10,000 to $19,999
- 4$20,000 to $29,999
- 4$30,000 to $39,999
- 8$40,000 to $49,999
- 5$50,000 to $59,999
- 12$60,000 to $74,999
- 24$75,000 to $99,999
- 35$100,000 to $124,999
- 30$125,000 to $149,999
- 22$150,000 to $199,999
- 57$200,000 or more

Distribution of owner-occupied house/condo value
![Distribution of owner-occupied house/condo value]()
- 3$100,000 to $149,999
- 3$400,000 to $499,999
- 8$500,000 to $749,999
- 3$750,000 to $999,999
- 19$1,000,000 or more

Distribution of rent paid by renters
![Distribution of rent paid by renters]()
- 3$200 to $299
- 2$700 to $799
- 2$800 to $899
- 2$900 to $999
- 8$1,000 to $1,249
- 8$1,500 to $1,999
- 158$2,000 or more

Median rent in 2022:
| Fourth Street (4th Street): | $3,601 |
| Berkeley: | $1,876 |
| Males: | 179 |
| Females: | 204 |
Males:
| This neighborhood: | 46.9 years |
| Whole city: | 31.4 years |
| This neighborhood: | 47.6 years |
| Whole city: | 31.7 years |
Average household size:
| Fourth Street (4th Street): | 2.3 people |
| Berkeley: | 2.3 people |
Percentage of family households:
| Fourth Street (4th Street): | 32.5% |
| Berkeley: | 31.4% |
| Here: | 26.7% |
| Berkeley: | 34.9% |
Percentage of married-couple families with children (among all households):
| Fourth Street (4th Street): | 18.5% |
| Berkeley: | 30.5% |
Percentage of single-mother households (among all households):
| Fourth Street (4th Street): | 36.1% |
| Berkeley: | 7.7% |
Percentage of never married males 15 years old and over:
Percentage of never married females 15 years old and over:
| Fourth Street (4th Street): | 23.8% |
| Berkeley: | 26.2% |
Percentage of never married females 15 years old and over:
| Fourth Street (4th Street): | 22.2% |
| city: | 29.6% |
Percentage of people that speak English not well or not at all:
| Fourth Street (4th Street): | 0.9% |
| Berkeley: | 1.9% |
Percentage of people born in this state:
Percentage of people born in another U.S. state:
Percentage of native residents but born outside the U.S.:
Percentage of foreign born residents:
| Here: | 44.6% |
| Berkeley: | 46.8% |
Percentage of people born in another U.S. state:
| Fourth Street (4th Street): | 31.6% |
| Berkeley: | 29.9% |
Percentage of native residents but born outside the U.S.:
| Here: | 1.9% |
| city: | 2.5% |
Percentage of foreign born residents:
| Here: | 22.0% |
| Berkeley: | 20.8% |
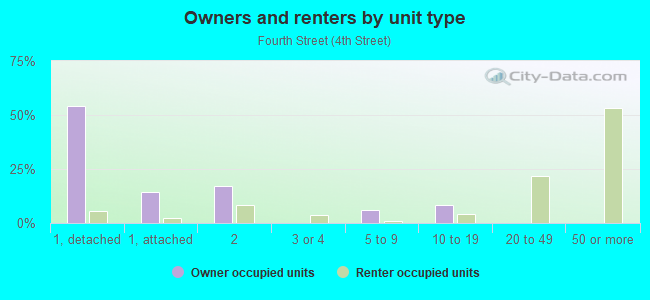
Owner-occupied
Renter-occupied

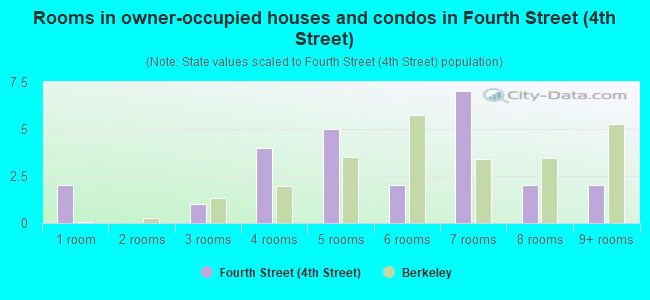
- Rooms in owner-occupied houses and condos in Fourth Street <<4th Street>>
- 21 room
- 02 rooms
- 13 rooms
- 44 rooms
- 55 rooms
- 26 rooms
- 77 rooms
- 28 rooms
- 29+ rooms
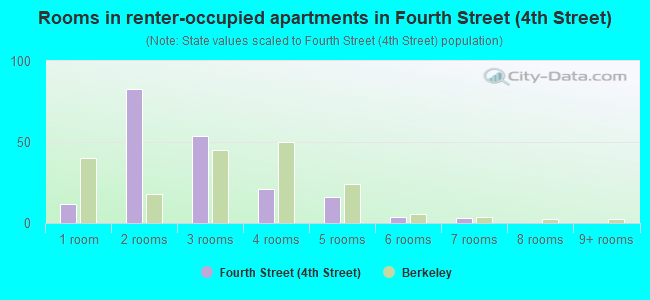
- Rooms in renter-occupied apartments in Fourth Street <<4th Street>>
- 121 room
- 832 rooms
- 543 rooms
- 214 rooms
- 165 rooms
- 46 rooms
- 37 rooms
- 08 rooms
- 09+ rooms
Owner-occupied
Renter-occupied
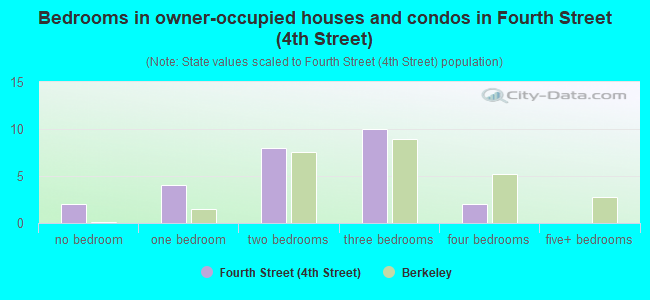
- Bedrooms in owner-occupied houses and condos in Fourth Street <<4th Street>>
- 2no bedroom
- 41 bedroom
- 82 bedrooms
- 103 bedrooms
- 24 bedrooms
- 05+ bedrooms
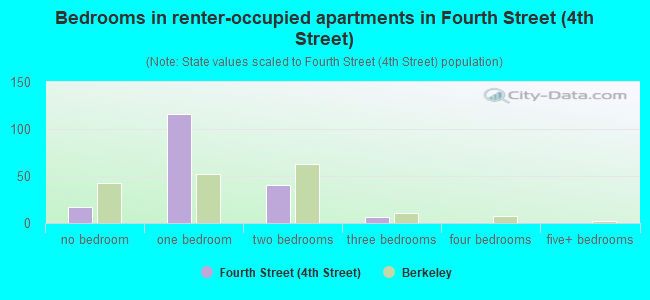
- Bedrooms in renter-occupied apartments in Fourth Street <<4th Street>>
- 17no bedroom
- 1161 bedroom
- 402 bedrooms
- 63 bedrooms
- 04 bedrooms
- 05+ bedrooms
Average number of cars or other vehicles available in houses/condos:
Average number of cars or other vehicles available in apartments:
| This neighborhood: | 1.2 |
| Berkeley: | 1.7 |
Average number of cars or other vehicles available in apartments:
| Here: | 1.1 |
| city: | 0.9 |
Percentage of units with a mortgage:
| Fourth Street (4th Street): | 60.1% |
| Berkeley: | 67.6% |
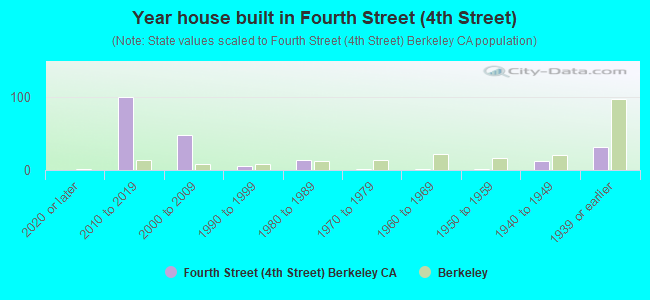
- Year house built in Fourth Street <<4th Street>>
- 02020 or later
- 992010 to 2019
- 482000 to 2009
- 61990 to 1999
- 131980 to 1989
- 11970 to 1979
- 11960 to 1969
- 21950 to 1959
- 121940 to 1949
- 321939 or earlier
City-data.com crime index for city in 2020 (higher means more crime):
| City: | 368.9 |
| U.S. average: | 219.5 |
Travel time to work (commute)
![Travel time to work (commute)]()
- 5Less than 5 minutes
- 245 to 9 minutes
- 810 to 14 minutes
- 3315 to 19 minutes
- 1920 to 24 minutes
- 325 to 29 minutes
- 2030 to 34 minutes
- 435 to 39 minutes
- 540 to 44 minutes
- 1745 to 59 minutes
- 1560 to 89 minutes
- 590 or more minutes

Means of transportation to work
![Means of transportation to work]()
- 27.7%80Drove a car alone
- 8.3%24Carpooled
- 13.2%38Bus
- 4.5%13Subway or elevated rail
- 1.0%3Long-distance train or commuter rail
- 0.3%1Ferryboat
- 0.3%1Bicycle
- 14.5%42Walked
- 1.0%3Other means
- 27.0%78Worked at home

Time leaving home to go to work
![Time leaving home to go to work]()
- 15:00 a.m. to 5:29 a.m.
- 85:30 a.m. to 5:59 a.m.
- 76:00 a.m. to 6:29 a.m.
- 146:30 a.m. to 6:59 a.m.
- 107:00 a.m. to 7:29 a.m.
- 137:30 a.m. to 7:59 a.m.
- 328:00 a.m. to 8:29 a.m.
- 178:30 a.m. to 8:59 a.m.
- 309:00 a.m. to 9:59 a.m.
- 810:00 a.m. to 10:59 a.m.
- 411:00 a.m. to 11:59 a.m.
- 712:00 p.m. to 3:59 p.m.

Occupations of males:
- Percentage of males in management occupations (except farmers):
Here: 19.9% city: 12.9%
- Percentage of males in business and financial operations occupations:
Here: 7.7% city: 5.0%
- Percentage of males in computer and mathematical occupations:
Here: 26.3% city: 12.2%
- Percentage of males in architecture and engineering occupations:
Here: 3.1% city: 6.4%
- Percentage of males in life, physical, and social science occupations:
Here: 9.6% city: 6.6%
- Percentage of males in education, training, and library occupations:
Here: 6.8% city: 11.4%
- Percentage of males in arts, design, entertainment, sports, and media occupations:
Here: 5.9% city: 6.4%
- Percentage of males in healthcare practitioners and technical occupations:
Here: 2.1% city: 2.6%
- Percentage of males in service occupations:
Here: 5.6% city: 9.3%
- Percentage of males in sales and office occupations:
Here: 7.3% city: 11.2%
- Percentage of males in production occupations:
Here: 1.0% city: 1.4%
- Percentage of males in transportation occupations:
Here: 4.5% city: 2.1%
Occupations of females:
- Percentage of females in management occupations (except farmers):
Here: 8.4% city: 14.2%
- Percentage of females in business and financial operations occupations:
Here: 10.4% city: 7.4%
- Percentage of females in computer and mathematical occupations:
Here: 5.8% city: 3.9%
- Percentage of females in architecture and engineering occupations:
Here: 4.6% city: 2.4%
- Percentage of females in life, physical, and social science occupations:
Here: 3.1% city: 5.5%
- Percentage of females in education, training, and library occupations:
Here: 17.1% city: 14.4%
- Percentage of females in arts, design, entertainment, sports, and media occupations:
Here: 11.4% city: 7.0%
- Percentage of females in healthcare practitioners and technical occupations:
Here: 5.4% city: 6.1%
- Percentage of females in service occupations:
Here: 8.9% city: 12.4%
- Percentage of females in sales and office occupations:
Here: 22.5% city: 18.1%
- Percentage of females in production occupations:
Here: 1.3% city: 1.1%
- Percentage of females in material moving occupations:
Here: 1.1% city: 1.0%
Education in this neighborhood (subdivision or community):
- Percentage of people 3 years and older in K-12 schools:
Fourth Street (4th Street): 6.6% Berkeley: 9.8%
- Percentage of people 3 years and older in undergraduate colleges:
Fourth Street (4th Street): 2.4% Berkeley: 22.4%
- Percentage of people 3 years and older in grad. or professional schools:
Fourth Street (4th Street): 6.6% Berkeley: 6.8%
- Percentage of students K-12 enrolled in private schools:
Fourth Street (4th Street): 16.0% Berkeley: 25.0%
Percentage of population below poverty level:
| Fourth Street (4th Street): | 7.8% |
| Berkeley: | 19.0% |
Median year owner moved in (as recorded in 2022):
Median year renter moved in (as recorded in 2022):
| Fourth Street (4th Street): | 2293 |
| Berkeley: | 2004 |
Median year renter moved in (as recorded in 2022):
| Fourth Street (4th Street): | 2301 |
| Berkeley: | 2021 |
Percentage of married-couple families with both working:
| Fourth Street (4th Street): | 100.0% |
| Berkeley: | 78.8% |
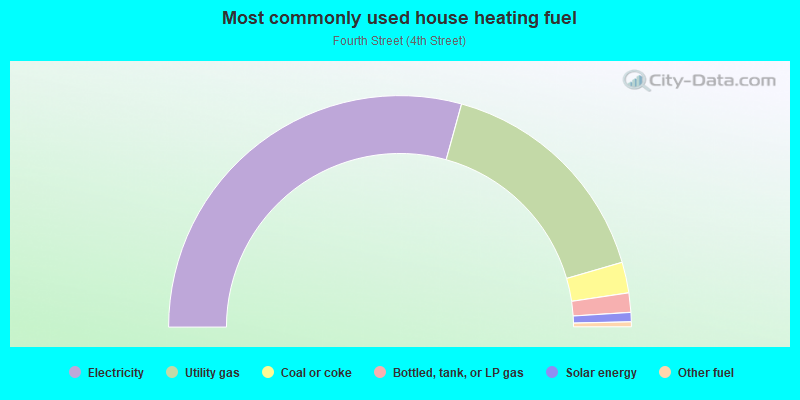
- 58.6%Electricity
- 32.4%Utility gas
- 4.3%Coal or coke
- 2.7%Bottled, tank, or LP gas
- 1.3%Solar energy
- 0.7%Other fuel
Roads and streets:
Virginia St
Length: 0.23 miles
Direction: E-W
Address range: 640 to 799
Direction: E-W
Address range: 640 to 799
5th St
Length: 0.22 miles
Direction: N-S
Address range: 1700 to 1899
Direction: N-S
Address range: 1700 to 1899
4th St
Length: 0.17 miles
Direction: N-S
Address range: 1700 to 1851
Direction: N-S
Address range: 1700 to 1851
3rd St (Union Pacific RR, Union Pacific RR, 3rd Street)
Length: 0.13 miles
Direction: N-S
Direction: N-S
Delaware St
Length: 0.07 miles
Direction: E-W
Direction: E-W
Hearst Ave
Length: 0.04 miles
Direction: E-W
Address range: 800 to 813
Direction: E-W
Address range: 800 to 813