Hillwood neighborhood in Falls Church, Virginia (VA), 22042, 22046 detailed profile
Settings
X


Business Search - 14 Million verified businesses
Area: 0.200 square miles
Population: 1,044
Population density:
| Hillwood: | 5,215 people per square mile |
| Falls Church: | 7,340 people per square mile |

- 49945.7%White
- 29226.7%Hispanic or Latino
- 18617.0%Asian
- 504.6%Black
- 464.2%Two or more races
- 151.4%Some other race
- 40.4%American Indian

Median household income in 2022:
| Hillwood: | $134,078 |
| Falls Church: | $164,536 |
Distribution of median household income
![Distribution of median household income]()
- 14Less than $10,000
- 64$10,000 to $19,999
- 34$20,000 to $29,999
- 45$30,000 to $39,999
- 52$40,000 to $49,999
- 14$50,000 to $59,999
- 27$60,000 to $74,999
- 55$75,000 to $99,999
- 49$100,000 to $124,999
- 35$125,000 to $149,999
- 86$150,000 to $199,999
- 84$200,000 or more

Distribution of owner-occupied house/condo value
![Distribution of owner-occupied house/condo value]()
- 6$150,000 to $199,999
- 17$200,000 to $249,999
- 31$250,000 to $299,999
- 7$300,000 to $399,999
- 22$400,000 to $499,999
- 100$500,000 to $749,999
- 62$750,000 to $999,999
- 98$1,000,000 or more

Distribution of rent paid by renters
![Distribution of rent paid by renters]()
- 57$300 to $399
- 23$400 to $499
- 6$700 to $799
- 21$1,250 to $1,499
- 55$1,500 to $1,999
- 128$2,000 or more

Median rent in 2022:
| Hillwood: | $2,264 |
| Falls Church: | $1,943 |
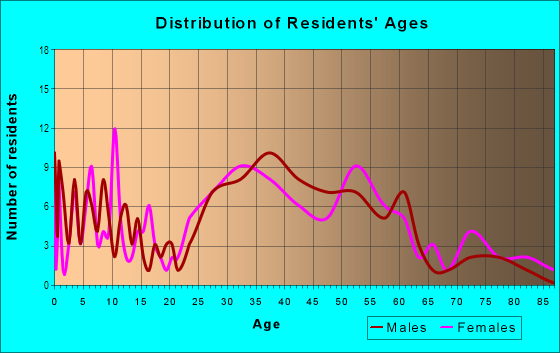
| Males: | 551 |
| Females: | 492 |
Males:
| This neighborhood: | 34.6 years |
| Whole city: | 36.7 years |
| This neighborhood: | 36.4 years |
| Whole city: | 41.5 years |
Average household size:
| Hillwood: | 8.2 people |
| Falls Church: | 2.5 people |
Percentage of family households:
| Hillwood: | 17.7% |
| Falls Church: | 46.0% |
| Here: | 48.4% |
| Falls Church: | 51.5% |
Percentage of married-couple families with children (among all households):
| Hillwood: | 35.6% |
| Falls Church: | 33.1% |
Percentage of single-mother households (among all households):
| Hillwood: | 35.3% |
| Falls Church: | 4.7% |
Percentage of never married males 15 years old and over:
Percentage of never married females 15 years old and over:
| Hillwood: | 16.4% |
| Falls Church: | 17.9% |
Percentage of never married females 15 years old and over:
| Hillwood: | 19.1% |
| city: | 16.2% |
Percentage of people that speak English not well or not at all:
| Hillwood: | 12.0% |
| Falls Church: | 2.2% |
Percentage of people born in this state:
Percentage of people born in another U.S. state:
Percentage of native residents but born outside the U.S.:
Percentage of foreign born residents:
| Here: | 24.2% |
| Falls Church: | 26.5% |
Percentage of people born in another U.S. state:
| Hillwood: | 47.4% |
| Falls Church: | 54.2% |
Percentage of native residents but born outside the U.S.:
| Here: | 2.0% |
| city: | 3.7% |
Percentage of foreign born residents:
| Here: | 26.4% |
| Falls Church: | 15.5% |

Owner-occupied
Renter-occupied


- Rooms in owner-occupied houses and condos in Hillwood
- 01 room
- 02 rooms
- 23 rooms
- 244 rooms
- 205 rooms
- 136 rooms
- 367 rooms
- 818 rooms
- 949+ rooms

- Rooms in renter-occupied apartments in Hillwood
- 351 room
- 882 rooms
- 463 rooms
- 694 rooms
- 355 rooms
- 66 rooms
- 27 rooms
- 68 rooms
- 179+ rooms
Owner-occupied
Renter-occupied

- Bedrooms in owner-occupied houses and condos in Hillwood
- 0no bedroom
- 111 bedroom
- 152 bedrooms
- 1453 bedrooms
- 984 bedrooms
- 555+ bedrooms

- Bedrooms in renter-occupied apartments in Hillwood
- 38no bedroom
- 1041 bedroom
- 522 bedrooms
- 243 bedrooms
- 64 bedrooms
- 35+ bedrooms
Average number of cars or other vehicles available in houses/condos:
Average number of cars or other vehicles available in apartments:
| This neighborhood: | 1.9 |
| Falls Church: | 1.9 |
Average number of cars or other vehicles available in apartments:
| Here: | 1.8 |
| city: | 1.4 |
Percentage of units with a mortgage:
| Hillwood: | 46.0% |
| Falls Church: | 70.0% |
Housing prices:
- Average estimated value of detached houses in 2022 (44.3% of all units):
Hillwood: $1,100,201 Virginia: $472,865
- Average estimated value of townhouses or other attached units in 2022 (6.7% of all units):
This neighborhood: $642,987 Virginia: $457,437

- Year house built in Hillwood
- 32020 or later
- 1772010 to 2019
- 242000 to 2009
- 231990 to 1999
- 391980 to 1989
- 1171970 to 1979
- 761960 to 1969
- 421950 to 1959
- 1281940 to 1949
- 441939 or earlier

City-data.com crime index for city in 2020 (higher means more crime):
| City: | 120.0 |
| U.S. average: | 219.5 |
Travel time to work (commute)
![Travel time to work (commute)]()
- 11Less than 5 minutes
- 315 to 9 minutes
- 5610 to 14 minutes
- 11515 to 19 minutes
- 5120 to 24 minutes
- 3825 to 29 minutes
- 6230 to 34 minutes
- 1735 to 39 minutes
- 5640 to 44 minutes
- 4445 to 59 minutes
- 2960 to 89 minutes
- 390 or more minutes

Means of transportation to work
![Means of transportation to work]()
- 59.4%313Drove a car alone
- 5.9%31Carpooled
- 3.0%16Bus
- 10.3%54Subway or elevated rail
- 0.4%2Long-distance train or commuter rail
- 13.9%73Motorcycle
- 6.3%33Walked
- 10.8%57Other means
- 18.4%97Worked at home

Time leaving home to go to work
![Time leaving home to go to work]()
- 1912:00 a.m. to 4:59 a.m.
- 145:00 a.m. to 5:29 a.m.
- 35:30 a.m. to 5:59 a.m.
- 496:00 a.m. to 6:29 a.m.
- 466:30 a.m. to 6:59 a.m.
- 837:00 a.m. to 7:29 a.m.
- 847:30 a.m. to 7:59 a.m.
- 778:00 a.m. to 8:29 a.m.
- 408:30 a.m. to 8:59 a.m.
- 639:00 a.m. to 9:59 a.m.
- 3510:00 a.m. to 10:59 a.m.
- 411:00 a.m. to 11:59 a.m.
- 1812:00 p.m. to 3:59 p.m.
- 254:00 p.m. to 11:59 p.m.

Occupations of males:
- Percentage of males in management occupations (except farmers):
Here: 15.1% city: 24.7%
- Percentage of males in business and financial operations occupations:
Here: 6.5% city: 9.3%
- Percentage of males in computer and mathematical occupations:
Here: 10.8% city: 15.0%
- Percentage of males in architecture and engineering occupations:
Here: 10.2% city: 3.6%
- Percentage of males in legal occupations:
Here: 1.4% city: 6.6%
- Percentage of males in arts, design, entertainment, sports, and media occupations:
Here: 1.2% city: 2.1%
- Percentage of males in service occupations:
Here: 23.6% city: 7.4%
- Percentage of males in sales and office occupations:
Here: 17.3% city: 12.4%
- Percentage of males in construction, extraction, and maintenance occupations:
Here: 2.7% city: 4.0%
- Percentage of males in transportation occupations:
Here: 7.9% city: 0.5%
- Percentage of males in material moving occupations:
Here: 1.4% city: 2.9%
Occupations of females:
- Percentage of females in management occupations (except farmers):
Here: 2.4% city: 15.1%
- Percentage of females in business and financial operations occupations:
Here: 6.8% city: 14.3%
- Percentage of females in computer and mathematical occupations:
Here: 3.4% city: 8.7%
- Percentage of females in community and social services occupations:
Here: 9.4% city: 1.9%
- Percentage of females in legal occupations:
Here: 1.2% city: 4.6%
- Percentage of females in education, training, and library occupations:
Here: 8.6% city: 10.6%
- Percentage of females in arts, design, entertainment, sports, and media occupations:
Here: 5.0% city: 3.0%
- Percentage of females in healthcare practitioners and technical occupations:
Here: 7.6% city: 9.4%
- Percentage of females in service occupations:
Here: 38.0% city: 12.6%
- Percentage of females in sales and office occupations:
Here: 16.7% city: 15.9%
Percentage of people 16-64 in Armed Forces:
| Hillwood: | 0.2% |
| Falls Church: | 1.3% |
Education in this neighborhood (subdivision or community):
- Percentage of people 3 years and older in K-12 schools:
Hillwood: 20.3% Falls Church: 21.3%
- Percentage of people 3 years and older in undergraduate colleges:
Hillwood: 5.3% Falls Church: 4.5%
- Percentage of people 3 years and older in grad. or professional schools:
Hillwood: 4.5% Falls Church: 2.0%
- Percentage of students K-12 enrolled in private schools:
Hillwood: 43.6% Falls Church: 11.0%
Percentage of population below poverty level:
| Hillwood: | 6.1% |
| Falls Church: | 2.3% |
Median year owner moved in (as recorded in 2022):
Median year renter moved in (as recorded in 2022):
| Hillwood: | 2006 |
| Falls Church: | 2010 |
Median year renter moved in (as recorded in 2022):
| Hillwood: | 2019 |
| Falls Church: | 2018 |
Percentage of married-couple families with both working:
| Hillwood: | 104.7% |
| Falls Church: | 77.3% |

- 51.5%Electricity
- 41.0%Utility gas
- 2.4%Other fuel
- 2.4%No fuel used
- 1.2%Solar energy
- 0.9%Fuel oil, kerosene, etc.
- 0.7%Bottled, tank, or LP gas
Highways in this neighborhood:
US Hwy 50 (Arlington Blvd)
Length: 0.95 miles
Direction: E-W
Address range: 6401 to 6548
Direction: E-W
Address range: 6401 to 6548
State Rte 7 (E Broad St)
Length: 0.15 miles
Direction: SE-NW
Direction: SE-NW
Hillwood Ave (State Rte 338)
Length: 0.12 miles
Directions: E-W, SE-NW
Directions: E-W, SE-NW
Leesburg Pike (State Rte 7)
Length: 0.08 miles
Direction: SE-NW
Direction: SE-NW
Roads and streets:
Westover St
Length: 0.45 miles
Directions: E-W, SE-NW
Address range: 6400 to 6599
Directions: E-W, SE-NW
Address range: 6400 to 6599
Cherry St
Length: 0.43 miles
Directions: N-S, SE-NW
Address range: 2800 to 2999
Directions: N-S, SE-NW
Address range: 2800 to 2999
Meadow Ln
Length: 0.39 miles
Directions: N-S, SW-NE
Address range: 2800 to 2999
Directions: N-S, SW-NE
Address range: 2800 to 2999
South St
Length: 0.33 miles
Directions: N-S, SW-NE
Address range: 6400 to 6498
Directions: N-S, SW-NE
Address range: 6400 to 6498
Brook Dr
Length: 0.30 miles
Directions: N-S, SW-NE
Address range: 2800 to 2999
Directions: N-S, SW-NE
Address range: 2800 to 2999
Linden Ln
Length: 0.30 miles
Directions: N-S, SW-NE
Address range: 2800 to 2999
Directions: N-S, SW-NE
Address range: 2800 to 2999
Shady Ln
Length: 0.27 miles
Direction: SW-NE
Address range: 6400 to 6499
Direction: SW-NE
Address range: 6400 to 6499
Cleave Dr
Length: 0.26 miles
Direction: SW-NE
Address range: 2800 to 2999
Direction: SW-NE
Address range: 2800 to 2999
Cedar Ln
Length: 0.25 miles
Direction: E-W
Address range: 6500 to 6536
Direction: E-W
Address range: 6500 to 6536
Franklin Walk
Length: 0.06 miles
Direction: N-S
Address range: 2800 to 2899
Direction: N-S
Address range: 2800 to 2899
Seven Oaks Ct
Length: 0.03 miles
Direction: E-W
Address range: 6400 to 6499
Direction: E-W
Address range: 6400 to 6499
Seven Oaks Dr
Length: 0.02 miles
Direction: SE-NW
Direction: SE-NW
Wilson Blvd
Length: 0.01 miles
Direction: SW-NE
Direction: SW-NE
Highways in this neighborhood:
State Rte 338 (Hillwood Ave)
Length: 0.69 miles
Directions: E-W, SE-NW
Address range: 500 to 1099
Directions: E-W, SE-NW
Address range: 500 to 1099
Roads and streets:
S Cherry St
Length: 0.04 miles
Direction: N-S
Address range: 200 to 208
Direction: N-S
Address range: 200 to 208
Meadow Ln
Length: 0.04 miles
Direction: SW-NE
Direction: SW-NE
Brook Dr
Length: 0.04 miles
Direction: SW-NE
Address range: 400 to 403
Direction: SW-NE
Address range: 400 to 403
Linden Ln
Length: 0.04 miles
Direction: SW-NE
Direction: SW-NE
Cleave Dr
Length: 0.03 miles
Direction: SW-NE
Address range: 400 to 406
Direction: SW-NE
Address range: 400 to 406
Shady Ln
Length: 0.03 miles
Direction: SW-NE
Address range: 401 to 403
Direction: SW-NE
Address range: 401 to 403
S Roosevelt St
Length: 0.03 miles
Direction: SW-NE
Direction: SW-NE