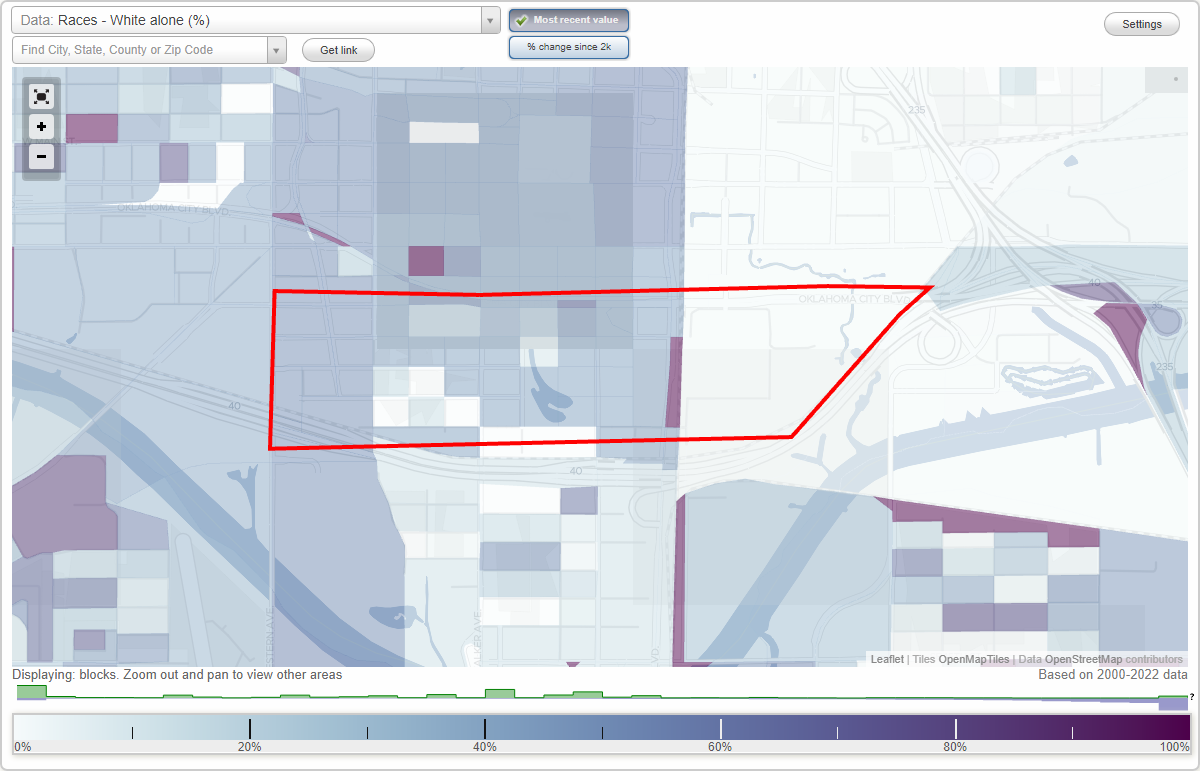
I-40 Expansion Area neighborhood in Oklahoma City, Oklahoma (OK), 73109, 73129 detailed profile
Settings
X

Business Search - 14 Million verified businesses
Area: 0.517 square miles
Population: 702
Population density:
| I-40 Expansion Area: | 1,358 people per square mile |
| Oklahoma City: | 1,145 people per square mile |

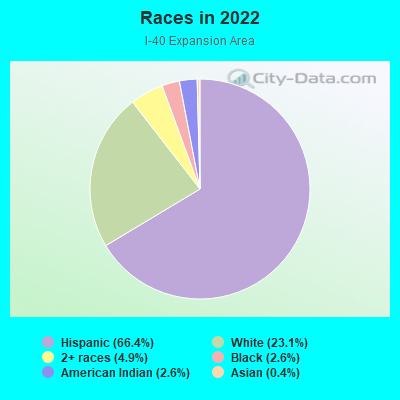
- 46566.4%Hispanic or Latino
- 16223.1%White
- 344.9%Two or more races
- 182.6%Black
- 182.6%American Indian
- 30.4%Asian
Median household income in 2022:
| I-40 Expansion Area: | $53,889 |
| Oklahoma City: | $63,713 |
Distribution of median household income
![Distribution of median household income]()
- 20Less than $10,000
- 31$10,000 to $19,999
- 16$20,000 to $29,999
- 14$30,000 to $39,999
- 27$40,000 to $49,999
- 24$50,000 to $59,999
- 38$60,000 to $74,999
- 15$75,000 to $99,999
- 18$100,000 to $124,999
- 12$125,000 to $149,999
- 7$150,000 to $199,999
- 2$200,000 or more

Distribution of owner-occupied house/condo value
![Distribution of owner-occupied house/condo value]()
- 21Less than $50,000
- 102$50,000 to $99,999
- 5$100,000 to $149,999
- 9$150,000 to $199,999
- 1$250,000 to $299,999
- 1$300,000 to $399,999
- 7$500,000 to $749,999

Distribution of rent paid by renters
![Distribution of rent paid by renters]()
- 4$100 to $199
- 2$200 to $299
- 15$400 to $499
- 16$500 to $599
- 14$600 to $699
- 10$700 to $799
- 14$800 to $899
- 10$900 to $999
- 2$1,000 to $1,249

Median rent in 2022:
| I-40 Expansion Area: | $638 |
| Oklahoma City: | $833 |
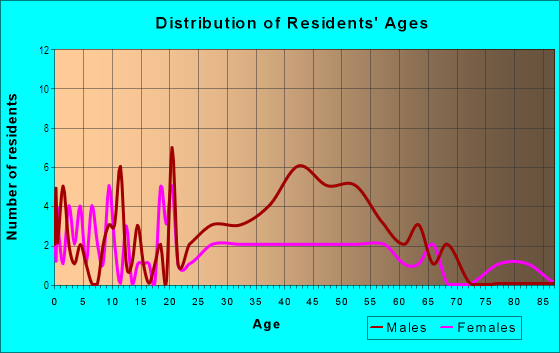
| Males: | 402 |
| Females: | 299 |
Males:
| This neighborhood: | 27.2 years |
| Whole city: | 33.6 years |
| This neighborhood: | 33.0 years |
| Whole city: | 35.8 years |
Average household size:
| I-40 Expansion Area: | 3.2 people |
| Oklahoma City: | 2.5 people |
Percentage of family households:
| I-40 Expansion Area: | 61.9% |
| Oklahoma City: | 47.3% |
| Here: | 34.4% |
| Oklahoma City: | 43.0% |
Percentage of married-couple families with children (among all households):
| I-40 Expansion Area: | 16.3% |
| Oklahoma City: | 24.7% |
Percentage of single-mother households (among all households):
| I-40 Expansion Area: | 13.0% |
| Oklahoma City: | 11.9% |
Percentage of never married males 15 years old and over:
Percentage of never married females 15 years old and over:
| I-40 Expansion Area: | 24.1% |
| Oklahoma City: | 17.7% |
Percentage of never married females 15 years old and over:
| I-40 Expansion Area: | 18.8% |
| city: | 16.7% |
Percentage of people born in this state:
Percentage of people born in another U.S. state:
Percentage of native residents but born outside the U.S.:
Percentage of foreign born residents:
| Here: | 52.8% |
| Oklahoma City: | 56.0% |
Percentage of people born in another U.S. state:
| I-40 Expansion Area: | 15.4% |
| Oklahoma City: | 30.7% |
Percentage of native residents but born outside the U.S.:
| Here: | 3.4% |
| city: | 1.6% |
Percentage of foreign born residents:
| Here: | 28.4% |
| Oklahoma City: | 11.6% |
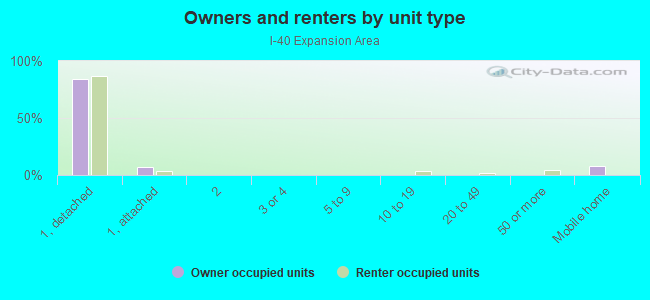
Owner-occupied
Renter-occupied

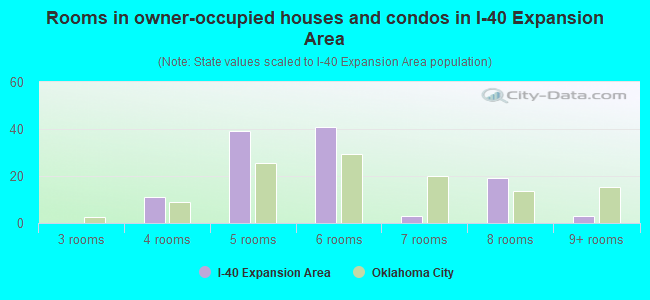
- Rooms in owner-occupied houses and condos in I-40 Expansion Area
- 01 room
- 02 rooms
- 03 rooms
- 114 rooms
- 395 rooms
- 416 rooms
- 37 rooms
- 198 rooms
- 39+ rooms
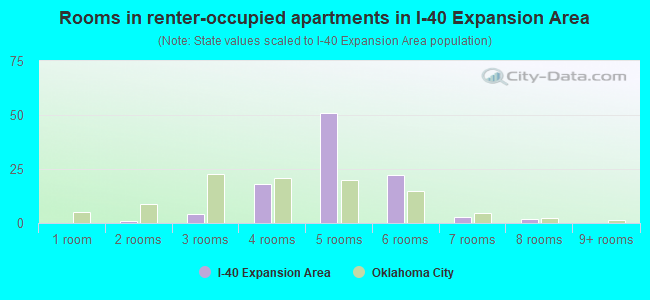
- Rooms in renter-occupied apartments in I-40 Expansion Area
- 01 room
- 12 rooms
- 43 rooms
- 184 rooms
- 515 rooms
- 226 rooms
- 37 rooms
- 28 rooms
- 09+ rooms
Owner-occupied
Renter-occupied
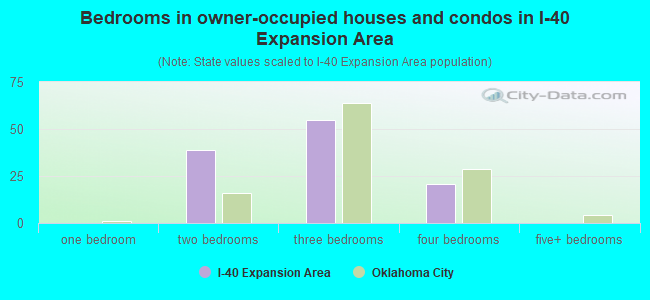
- Bedrooms in owner-occupied houses and condos in I-40 Expansion Area
- 0no bedroom
- 01 bedroom
- 392 bedrooms
- 553 bedrooms
- 214 bedrooms
- 05+ bedrooms
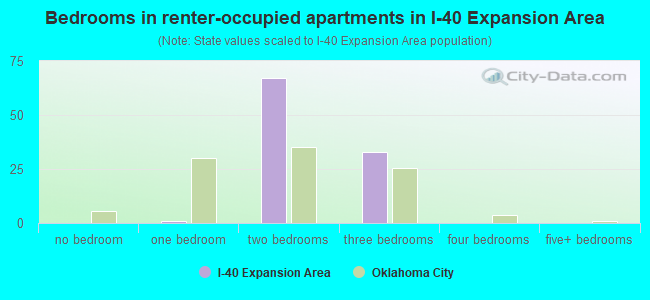
- Bedrooms in renter-occupied apartments in I-40 Expansion Area
- 0no bedroom
- 11 bedroom
- 672 bedrooms
- 333 bedrooms
- 04 bedrooms
- 05+ bedrooms
Average number of cars or other vehicles available in houses/condos:
Average number of cars or other vehicles available in apartments:
| This neighborhood: | 2.4 |
| Oklahoma City: | 2.1 |
Average number of cars or other vehicles available in apartments:
| Here: | 1.8 |
| city: | 1.3 |
Percentage of units with a mortgage:
| I-40 Expansion Area: | 25.9% |
| Oklahoma City: | 60.2% |
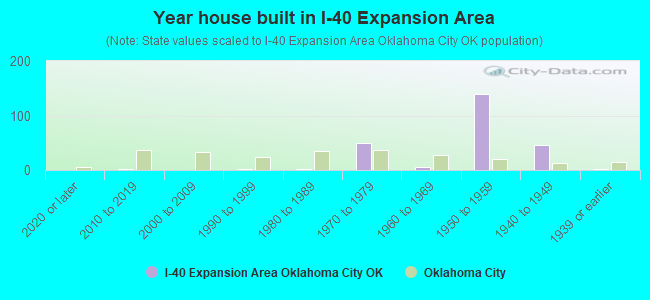
- Year house built in I-40 Expansion Area
- 02020 or later
- 12010 to 2019
- 02000 to 2009
- 11990 to 1999
- 11980 to 1989
- 501970 to 1979
- 51960 to 1969
- 1401950 to 1959
- 451940 to 1949
- 11939 or earlier
City-data.com crime index for city in 2020 (higher means more crime):
| City: | 430.2 |
| U.S. average: | 219.5 |
Travel time to work (commute)
![Travel time to work (commute)]()
- 12Less than 5 minutes
- 185 to 9 minutes
- 4710 to 14 minutes
- 4115 to 19 minutes
- 1620 to 24 minutes
- 525 to 29 minutes
- 3530 to 34 minutes
- 135 to 39 minutes
- 740 to 44 minutes
- 245 to 59 minutes
- 360 to 89 minutes
- 390 or more minutes

Means of transportation to work
![Means of transportation to work]()
- 83.7%327Drove a car alone
- 2.8%11Carpooled
- 1.8%7Bus
- 0.3%1Motorcycle
- 0.5%2Walked
- 6.1%24Other means
- 4.6%18Worked at home

Time leaving home to go to work
![Time leaving home to go to work]()
- 812:00 a.m. to 4:59 a.m.
- 25:00 a.m. to 5:29 a.m.
- 115:30 a.m. to 5:59 a.m.
- 666:00 a.m. to 6:29 a.m.
- 76:30 a.m. to 6:59 a.m.
- 137:00 a.m. to 7:29 a.m.
- 257:30 a.m. to 7:59 a.m.
- 198:00 a.m. to 8:29 a.m.
- 78:30 a.m. to 8:59 a.m.
- 119:00 a.m. to 9:59 a.m.
- 210:00 a.m. to 10:59 a.m.
- 412:00 p.m. to 3:59 p.m.
- 124:00 p.m. to 11:59 p.m.

Occupations of males:
- Percentage of males in management occupations (except farmers):
Here: 1.8% city: 10.4%
- Percentage of males in life, physical, and social science occupations:
Here: 1.3% city: 1.0%
- Percentage of males in legal occupations:
Here: 1.2% city: 1.5%
- Percentage of males in healthcare practitioners and technical occupations:
Here: 1.6% city: 3.9%
- Percentage of males in service occupations:
Here: 19.3% city: 13.2%
- Percentage of males in sales and office occupations:
Here: 34.3% city: 15.7%
- Percentage of males in construction, extraction, and maintenance occupations:
Here: 21.6% city: 11.0%
- Percentage of males in production occupations:
Here: 9.4% city: 6.3%
- Percentage of males in transportation occupations:
Here: 4.7% city: 5.4%
- Percentage of males in material moving occupations:
Here: 4.0% city: 5.6%
Occupations of females:
- Percentage of females in management occupations (except farmers):
Here: 6.3% city: 8.7%
- Percentage of females in business and financial operations occupations:
Here: 1.6% city: 7.6%
- Percentage of females in community and social services occupations:
Here: 3.5% city: 2.0%
- Percentage of females in education, training, and library occupations:
Here: 4.0% city: 8.0%
- Percentage of females in healthcare practitioners and technical occupations:
Here: 2.8% city: 10.3%
- Percentage of females in service occupations:
Here: 36.0% city: 21.4%
- Percentage of females in sales and office occupations:
Here: 39.1% city: 27.6%
- Percentage of females in construction, extraction, and maintenance occupations:
Here: 1.4% city: 0.4%
- Percentage of females in production occupations:
Here: 7.0% city: 3.1%
- Percentage of females in material moving occupations:
Here: 5.8% city: 2.7%
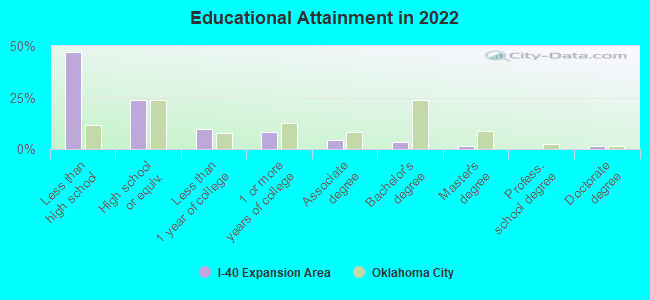
Education in this neighborhood (subdivision or community):
- Percentage of people 3 years and older in K-12 schools:
I-40 Expansion Area: 28.4% Oklahoma City: 18.8%
- Percentage of people 3 years and older in undergraduate colleges:
I-40 Expansion Area: 1.5% Oklahoma City: 5.0%
- Percentage of people 3 years and older in grad. or professional schools:
I-40 Expansion Area: 0.0% Oklahoma City: 1.4%
- Percentage of students K-12 enrolled in private schools:
I-40 Expansion Area: 3.7% Oklahoma City: 14.4%
Percentage of population below poverty level:
| I-40 Expansion Area: | 18.9% |
| Oklahoma City: | 15.5% |
Median year owner moved in (as recorded in 2022):
Median year renter moved in (as recorded in 2022):
| I-40 Expansion Area: | 2005 |
| Oklahoma City: | 2013 |
Median year renter moved in (as recorded in 2022):
| I-40 Expansion Area: | 2015 |
| Oklahoma City: | 2020 |
Percentage of married-couple families with both working:
| I-40 Expansion Area: | 114.6% |
| Oklahoma City: | 64.6% |
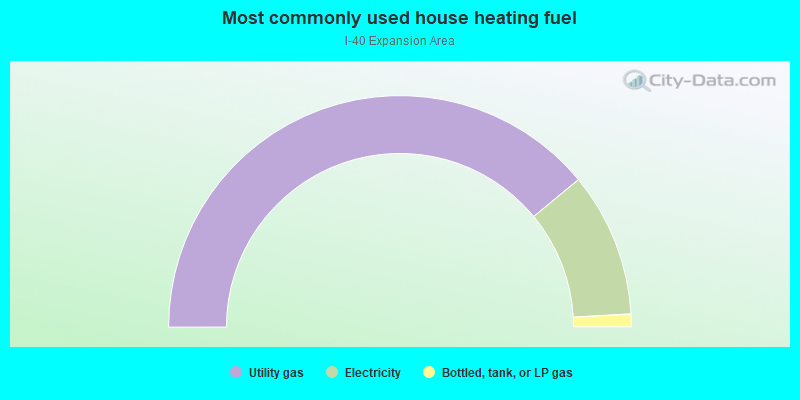
- 78.1%Utility gas
- 20.2%Electricity
- 1.8%Bottled, tank, or LP gas
Limited-access highways (interstate or state) in this neighborhood:
I- 40 (US Hwy 270)
Length: 0.69 miles
Direction: E-W
Address range: 1 to 399
Direction: E-W
Address range: 1 to 399
Roads and streets:
SW 7th St
Length: 1.12 miles
Direction: E-W
Address range: 1 to 999
Direction: E-W
Address range: 1 to 999
SW 5th St
Length: 1.04 miles
Direction: E-W
Address range: 1 to 999
Direction: E-W
Address range: 1 to 999
SW 3rd St
Length: 1.02 miles
Direction: E-W
Address range: 1 to 997
Direction: E-W
Address range: 1 to 997
SW 4th St
Length: 1.02 miles
Directions: E-W, N-S
Address range: 1 to 893
Directions: E-W, N-S
Address range: 1 to 893
SW 6th St
Length: 0.98 miles
Direction: E-W
Address range: 1 to 999
Direction: E-W
Address range: 1 to 999
S Broadway Ave
Length: 0.35 miles
Directions: E-W, N-S, SE-NW
Address range: 342 to 799
Directions: E-W, N-S, SE-NW
Address range: 342 to 799
S Harvey Ave
Length: 0.31 miles
Direction: N-S
Address range: 350 to 799
Direction: N-S
Address range: 350 to 799
S Robinson Ave
Length: 0.31 miles
Direction: N-S
Address range: 350 to 799
Direction: N-S
Address range: 350 to 799
S Walker Ave
Length: 0.31 miles
Direction: N-S
Address range: 356 to 799
Direction: N-S
Address range: 356 to 799
W I-40 Hwy
Length: 0.29 miles
Direction: E-W
Direction: E-W
S Lee Ave
Length: 0.29 miles
Direction: N-S
Address range: 400 to 899
Direction: N-S
Address range: 400 to 899
S Shartel Ave
Length: 0.29 miles
Direction: N-S
Address range: 400 to 799
Direction: N-S
Address range: 400 to 799
S Shields Blvd
Length: 0.29 miles
Direction: N-S
Address range: 400 to 799
Direction: N-S
Address range: 400 to 799
S Hudson Ave
Length: 0.29 miles
Direction: N-S
Address range: 400 to 799
Direction: N-S
Address range: 400 to 799
SE 4th St
Length: 0.27 miles
Directions: E-W, SE-NW
Address range: 1 to 499
Directions: E-W, SE-NW
Address range: 1 to 499
S Dewey Ave
Length: 0.25 miles
Direction: N-S
Address range: 400 to 899
Direction: N-S
Address range: 400 to 899
S Classen Blvd
Length: 0.22 miles
Direction: N-S
Address range: 400 to 499
Direction: N-S
Address range: 400 to 499
SE 3rd St
Length: 0.18 miles
Direction: E-W
Address range: 1 to 299
Direction: E-W
Address range: 1 to 299
S Olie Ave
Length: 0.14 miles
Direction: N-S
Address range: 600 to 799
Direction: N-S
Address range: 600 to 799
Compress St
Length: 0.14 miles
Directions: E-W, N-S, SW-NE
Address range: 366 to 463
Directions: E-W, N-S, SW-NE
Address range: 366 to 463
S Santa Fe Ave
Length: 0.10 miles
Direction: N-S
Address range: 340 to 749
Direction: N-S
Address range: 340 to 749
S Walnut Ave
Length: 0.10 miles
Direction: N-S
Address range: 400 to 499
Direction: N-S
Address range: 400 to 499
E I-40 Hwy
Length: 0.05 miles
Direction: E-W
Direction: E-W
Railroad features:
Union Pacific RR (Burlington Northern Santa Fe Rlwy)
Length: 0.33 miles
Direction: N-S
Direction: N-S