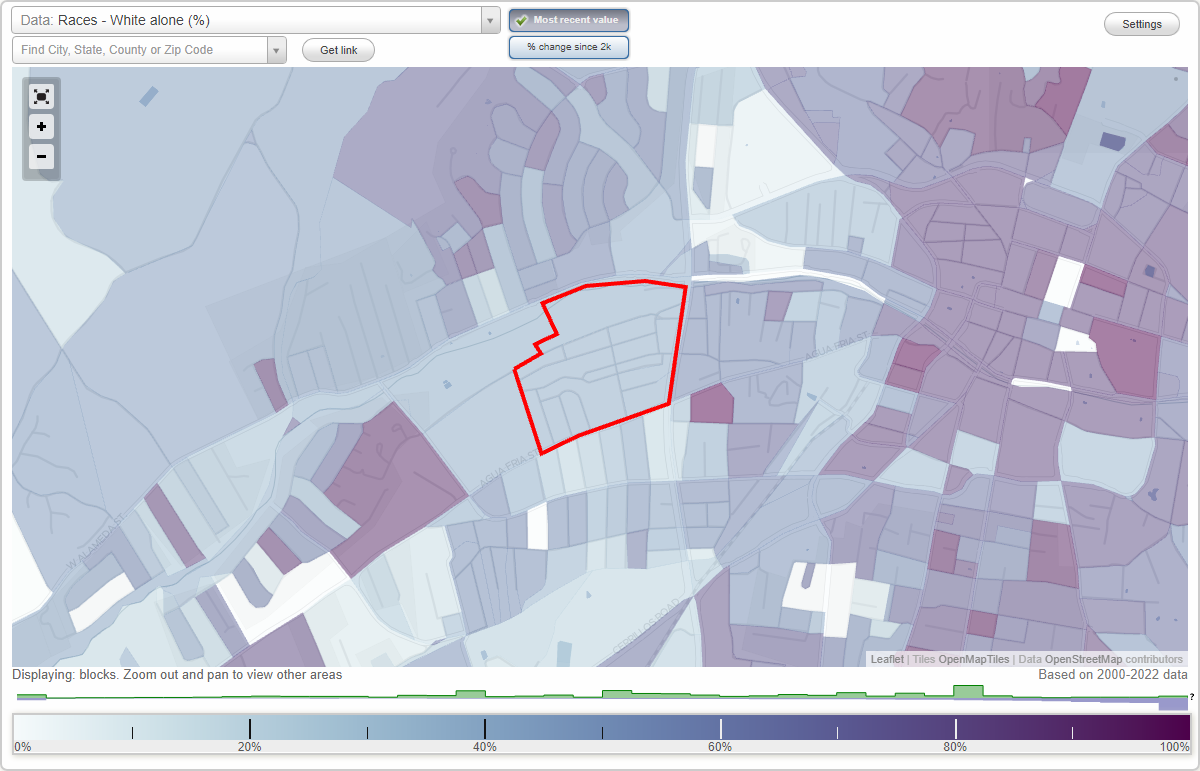
La Madera neighborhood in Santa Fe, New Mexico (NM), 87501 detailed profile
Settings
X

Business Search - 14 Million verified businesses
Area: 0.116 square miles
Population: 269
Population density:
| La Madera: | 2,328 people per square mile |
| Santa Fe: | 2,384 people per square mile |

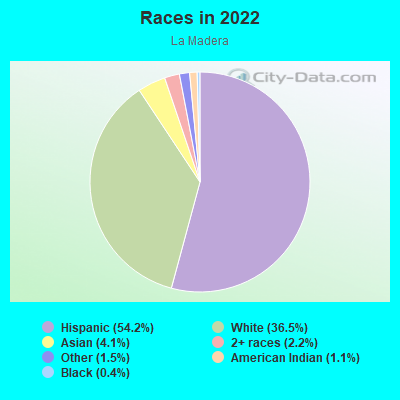
- 14754.2%Hispanic or Latino
- 9936.5%White
- 114.1%Asian
- 62.2%Two or more races
- 41.5%Some other race
- 31.1%American Indian
- 10.4%Black
Median household income in 2022:
| La Madera: | $65,778 |
| Santa Fe: | $68,793 |
Distribution of median household income
![Distribution of median household income]()
- 6Less than $10,000
- 20$10,000 to $19,999
- 27$20,000 to $29,999
- 22$30,000 to $39,999
- 12$40,000 to $49,999
- 10$50,000 to $59,999
- 17$60,000 to $74,999
- 15$75,000 to $99,999
- 8$100,000 to $124,999
- 9$125,000 to $149,999
- 8$150,000 to $199,999
- 7$200,000 or more

Distribution of owner-occupied house/condo value
![Distribution of owner-occupied house/condo value]()
- 6Less than $50,000
- 3$50,000 to $99,999
- 7$100,000 to $149,999
- 8$150,000 to $199,999
- 10$200,000 to $249,999
- 14$250,000 to $299,999
- 27$300,000 to $399,999
- 17$400,000 to $499,999
- 15$500,000 to $749,999
- 3$750,000 to $999,999
- 2$1,000,000 or more

Distribution of rent paid by renters
![Distribution of rent paid by renters]()
- 1$200 to $299
- 2$500 to $599
- 7$700 to $799
- 8$800 to $899
- 5$900 to $999
- 13$1,000 to $1,249
- 9$1,250 to $1,499
- 6$1,500 to $1,999
- 7$2,000 or more

Median rent in 2022:
| La Madera: | $1,161 |
| Santa Fe: | $1,233 |
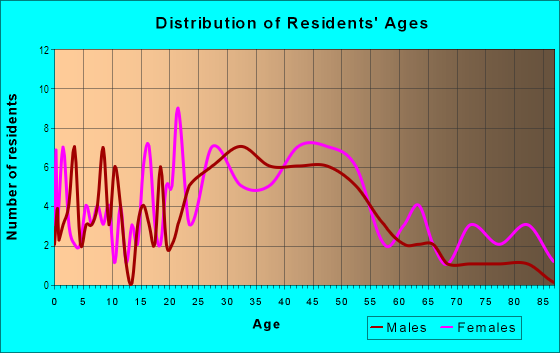
| Males: | 136 |
| Females: | 132 |
Males:
| This neighborhood: | 44.6 years |
| Whole city: | 43.9 years |
| This neighborhood: | 43.6 years |
| Whole city: | 47.5 years |
Average household size:
| La Madera: | 14.1 people |
| Santa Fe: | 21.0 people |
Percentage of family households:
| La Madera: | 34.0% |
| Santa Fe: | 34.0% |
| Here: | 27.0% |
| Santa Fe: | 32.0% |
Percentage of married-couple families with children (among all households):
| La Madera: | 41.3% |
| Santa Fe: | 23.8% |
Percentage of single-mother households (among all households):
| La Madera: | 7.0% |
| Santa Fe: | 19.5% |
Percentage of never married males 15 years old and over:
Percentage of never married females 15 years old and over:
| La Madera: | 22.1% |
| Santa Fe: | 17.9% |
Percentage of never married females 15 years old and over:
| La Madera: | 16.2% |
| city: | 18.9% |
Percentage of people that speak English not well or not at all:
| La Madera: | 0.4% |
| Santa Fe: | 5.1% |
Percentage of people born in this state:
Percentage of people born in another U.S. state:
Percentage of native residents but born outside the U.S.:
Percentage of foreign born residents:
| Here: | 49.7% |
| Santa Fe: | 45.1% |
Percentage of people born in another U.S. state:
| La Madera: | 45.1% |
| Santa Fe: | 37.8% |
Percentage of native residents but born outside the U.S.:
| Here: | 0.3% |
| city: | 1.6% |
Percentage of foreign born residents:
| Here: | 4.8% |
| Santa Fe: | 15.6% |
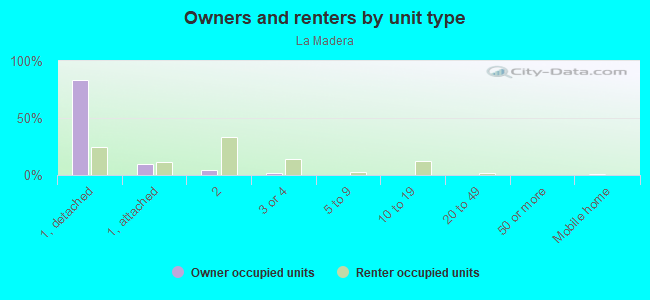
Owner-occupied
Renter-occupied

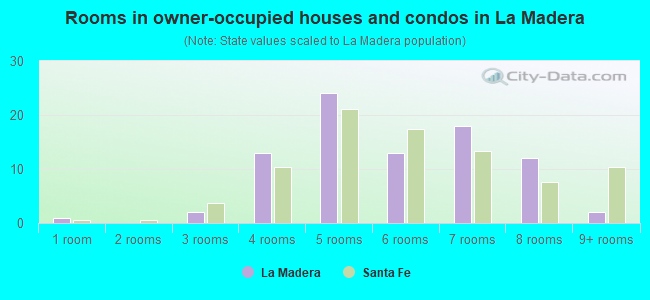
- Rooms in owner-occupied houses and condos in La Madera
- 11 room
- 02 rooms
- 23 rooms
- 134 rooms
- 245 rooms
- 136 rooms
- 187 rooms
- 128 rooms
- 29+ rooms
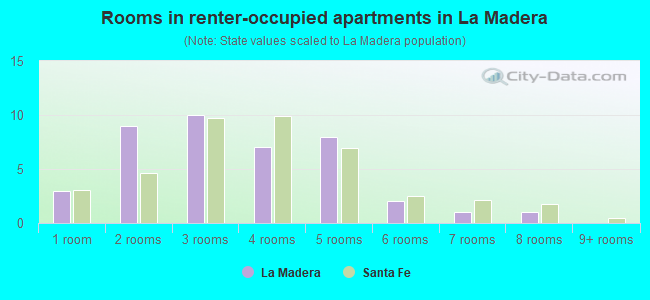
- Rooms in renter-occupied apartments in La Madera
- 31 room
- 92 rooms
- 103 rooms
- 74 rooms
- 85 rooms
- 26 rooms
- 17 rooms
- 18 rooms
- 09+ rooms
Owner-occupied
Renter-occupied
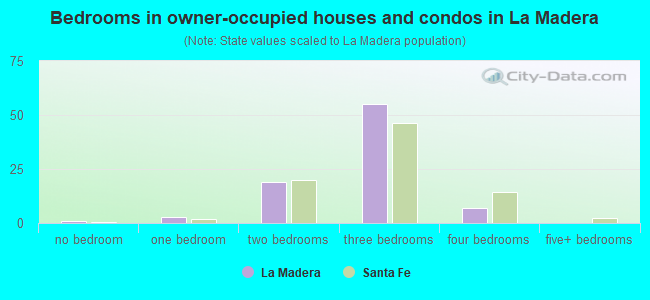
- Bedrooms in owner-occupied houses and condos in La Madera
- 1no bedroom
- 31 bedroom
- 192 bedrooms
- 553 bedrooms
- 74 bedrooms
- 05+ bedrooms
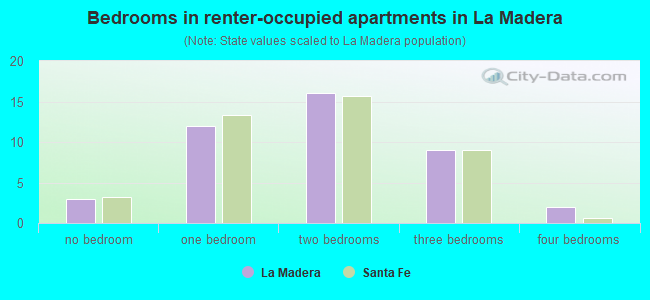
- Bedrooms in renter-occupied apartments in La Madera
- 3no bedroom
- 121 bedroom
- 162 bedrooms
- 93 bedrooms
- 24 bedrooms
- 05+ bedrooms
Average number of cars or other vehicles available in houses/condos:
Average number of cars or other vehicles available in apartments:
| This neighborhood: | 1.7 |
| Santa Fe: | 1.9 |
Average number of cars or other vehicles available in apartments:
| Here: | 1.4 |
| city: | 1.3 |
Percentage of units with a mortgage:
| La Madera: | 68.2% |
| Santa Fe: | 60.0% |
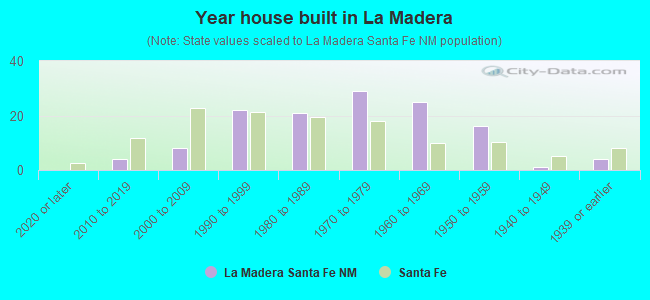
- Year house built in La Madera
- 02020 or later
- 42010 to 2019
- 82000 to 2009
- 221990 to 1999
- 211980 to 1989
- 291970 to 1979
- 251960 to 1969
- 161950 to 1959
- 11940 to 1949
- 41939 or earlier
City-data.com crime index for city in 2020 (higher means more crime):
| City: | 121.4 |
| U.S. average: | 219.5 |
Travel time to work (commute)
![Travel time to work (commute)]()
- 4Less than 5 minutes
- 205 to 9 minutes
- 2910 to 14 minutes
- 3915 to 19 minutes
- 1120 to 24 minutes
- 1725 to 29 minutes
- 1430 to 34 minutes
- 240 to 44 minutes
- 845 to 59 minutes
- 260 to 89 minutes
- 190 or more minutes

Means of transportation to work
![Means of transportation to work]()
- 71.0%103Drove a car alone
- 8.3%12Carpooled
- 4.8%7Bicycle
- 4.8%7Walked
- 0.7%1Other means
- 13.1%19Worked at home

Time leaving home to go to work
![Time leaving home to go to work]()
- 112:00 a.m. to 4:59 a.m.
- 156:30 a.m. to 6:59 a.m.
- 97:00 a.m. to 7:29 a.m.
- 387:30 a.m. to 7:59 a.m.
- 118:00 a.m. to 8:29 a.m.
- 58:30 a.m. to 8:59 a.m.
- 149:00 a.m. to 9:59 a.m.
- 610:00 a.m. to 10:59 a.m.
- 211:00 a.m. to 11:59 a.m.
- 1312:00 p.m. to 3:59 p.m.
- 144:00 p.m. to 11:59 p.m.

Occupations of males:
- Percentage of males in management occupations (except farmers):
Here: 14.1% city: 11.8%
- Percentage of males in computer and mathematical occupations:
Here: 3.5% city: 3.3%
- Percentage of males in architecture and engineering occupations:
Here: 6.2% city: 2.6%
- Percentage of males in life, physical, and social science occupations:
Here: 4.0% city: 4.3%
- Percentage of males in community and social services occupations:
Here: 3.5% city: 1.9%
- Percentage of males in education, training, and library occupations:
Here: 5.3% city: 5.2%
- Percentage of males in arts, design, entertainment, sports, and media occupations:
Here: 1.6% city: 3.2%
- Percentage of males in service occupations:
Here: 26.8% city: 17.6%
- Percentage of males in sales and office occupations:
Here: 8.4% city: 12.1%
- Percentage of males in construction, extraction, and maintenance occupations:
Here: 6.0% city: 9.6%
- Percentage of males in production occupations:
Here: 4.0% city: 2.6%
- Percentage of males in transportation occupations:
Here: 3.1% city: 3.1%
- Percentage of males in material moving occupations:
Here: 1.5% city: 5.0%
Occupations of females:
- Percentage of females in management occupations (except farmers):
Here: 9.5% city: 10.4%
- Percentage of females in business and financial operations occupations:
Here: 14.8% city: 6.1%
- Percentage of females in computer and mathematical occupations:
Here: 4.1% city: 1.5%
- Percentage of females in architecture and engineering occupations:
Here: 1.8% city: 0.8%
- Percentage of females in life, physical, and social science occupations:
Here: 3.9% city: 2.3%
- Percentage of females in legal occupations:
Here: 8.8% city: 2.7%
- Percentage of females in education, training, and library occupations:
Here: 21.4% city: 9.7%
- Percentage of females in arts, design, entertainment, sports, and media occupations:
Here: 1.0% city: 4.4%
- Percentage of females in healthcare practitioners and technical occupations:
Here: 4.3% city: 7.0%
- Percentage of females in service occupations:
Here: 6.6% city: 24.6%
- Percentage of females in sales and office occupations:
Here: 22.0% city: 24.6%
- Percentage of females in production occupations:
Here: 1.9% city: 1.2%
- Percentage of females in material moving occupations:
Here: 1.8% city: 1.0%
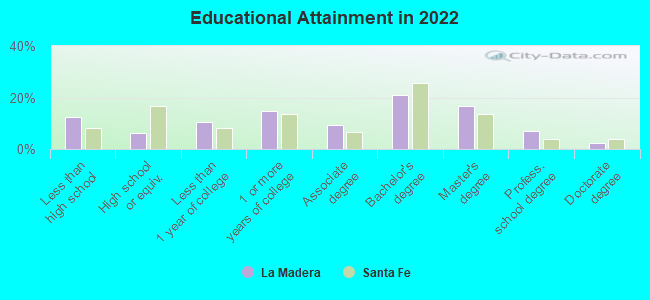
Education in this neighborhood (subdivision or community):
- Percentage of people 3 years and older in K-12 schools:
La Madera: 7.7% Santa Fe: 12.3%
- Percentage of people 3 years and older in undergraduate colleges:
La Madera: 2.3% Santa Fe: 4.5%
- Percentage of people 3 years and older in grad. or professional schools:
La Madera: 1.9% Santa Fe: 1.6%
- Percentage of students K-12 enrolled in private schools:
La Madera: 15.0% Santa Fe: 11.0%
Percentage of population below poverty level:
| La Madera: | 13.9% |
| Santa Fe: | 13.5% |
Median year owner moved in (as recorded in 2022):
Median year renter moved in (as recorded in 2022):
| La Madera: | 2003 |
| Santa Fe: | 2011 |
Median year renter moved in (as recorded in 2022):
| La Madera: | 2017 |
| Santa Fe: | 2020 |
Percentage of married-couple families with both working:
| La Madera: | 62.1% |
| Santa Fe: | 75.7% |
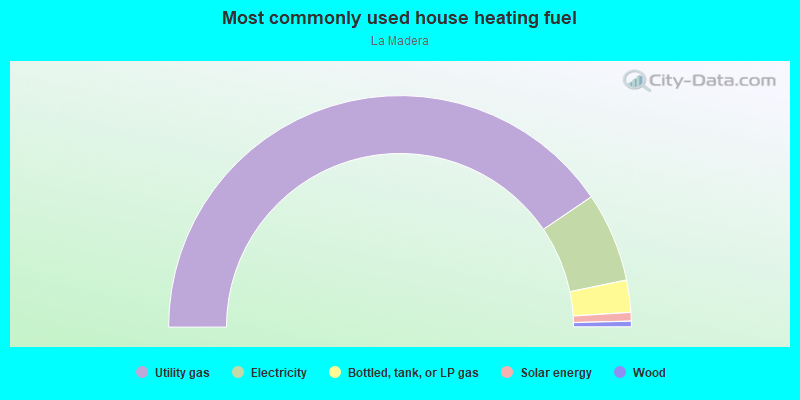
- 81.0%Utility gas
- 12.5%Electricity
- 4.5%Bottled, tank, or LP gas
- 1.2%Solar energy
- 0.8%Wood
Highways in this neighborhood:
State Rte 22 (State Rte 588, Agua Fria St)
Length: 0.35 miles
Direction: E-W
Address range: 865 to 1114
Direction: E-W
Address range: 865 to 1114
S St Francis Dr (US Hwy 285)
Length: 0.12 miles
Direction: N-S
Address range: 300 to 398
Direction: N-S
Address range: 300 to 398
Roads and streets:
Lopez St
Length: 0.41 miles
Directions: E-W, N-S, SE-NW, SW-NE
Address range: 905 to 1175
Directions: E-W, N-S, SE-NW, SW-NE
Address range: 905 to 1175
Dunlap St
Length: 0.29 miles
Directions: E-W, SW-NE
Address range: 852 to 1099
Directions: E-W, SW-NE
Address range: 852 to 1099
Alto St
Length: 0.29 miles
Direction: E-W
Address range: 900 to 1034
Direction: E-W
Address range: 900 to 1034
Don Juan St
Length: 0.27 miles
Direction: E-W
Address range: 900 to 1099
Direction: E-W
Address range: 900 to 1099
Urioste St
Length: 0.23 miles
Directions: N-S, SE-NW
Address range: 280 to 951
Directions: N-S, SE-NW
Address range: 280 to 951
Kathryn Pl
Length: 0.22 miles
Directions: E-W, N-S, SE-NW, SW-NE
Address range: 400 to 499
Directions: E-W, N-S, SE-NW, SW-NE
Address range: 400 to 499
Salazar Pl
Length: 0.15 miles
Directions: N-S, SE-NW
Address range: 400 to 499
Directions: N-S, SE-NW
Address range: 400 to 499
Cortez Pl
Length: 0.11 miles
Directions: N-S, SE-NW
Address range: 400 to 499
Directions: N-S, SE-NW
Address range: 400 to 499
Lorenzo St
Length: 0.10 miles
Direction: E-W
Address range: 800 to 999
Direction: E-W
Address range: 800 to 999
Montoya St
Length: 0.09 miles
Directions: N-S, SW-NE
Address range: 200 to 399
Directions: N-S, SW-NE
Address range: 200 to 399
Franklin Pl
Length: 0.07 miles
Direction: N-S
Direction: N-S
Cll Eloy
Length: 0.04 miles
Direction: N-S
Address range: 300 to 399
Direction: N-S
Address range: 300 to 399
Roybal St
Length: 0.03 miles
Directions: E-W, SE-NW
Address range: 983 to 999
Directions: E-W, SE-NW
Address range: 983 to 999