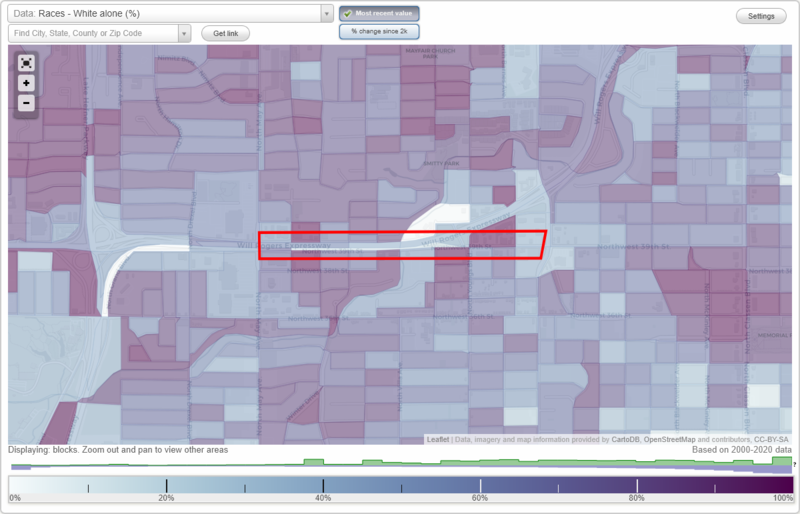
Northwest 39 Street Enclave neighborhood in Oklahoma City, Oklahoma (OK), 73112 detailed profile
Settings
X

Business Search - 14 Million verified businesses
Area: 0.099 square miles
Population: 646
Population density:
| Northwest 39 Street Enclave: | 6,528 people per square mile |
| Oklahoma City: | 1,145 people per square mile |

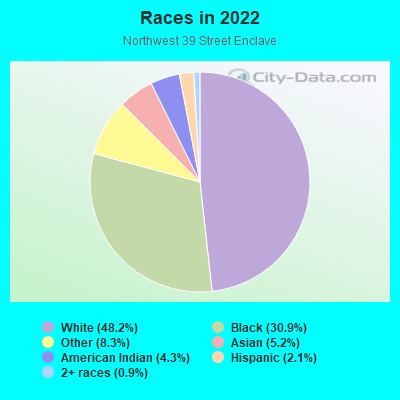
- 37048.2%White
- 23730.9%Black
- 648.3%Some other race
- 405.2%Asian
- 334.3%American Indian
- 162.1%Hispanic or Latino
- 70.9%Two or more races
Distribution of median household income
![Distribution of median household income]()
- 7Less than $10,000
- 30$10,000 to $19,999
- 23$20,000 to $29,999
- 34$30,000 to $39,999
- 9$40,000 to $49,999
- 23$50,000 to $59,999
- 45$60,000 to $74,999
- 50$75,000 to $99,999
- 13$100,000 to $124,999
- 44$125,000 to $149,999
- 4$150,000 to $199,999
- 10$200,000 or more

Distribution of owner-occupied house/condo value
![Distribution of owner-occupied house/condo value]()
- 29Less than $50,000
- 68$50,000 to $99,999
- 15$100,000 to $149,999
- 36$150,000 to $199,999
- 29$200,000 to $249,999
- 23$250,000 to $299,999
- 13$300,000 to $399,999
- 6$400,000 to $499,999
- 3$750,000 to $999,999
- 3$1,000,000 or more

Distribution of rent paid by renters
![Distribution of rent paid by renters]()
- 7$100 to $199
- 2$200 to $299
- 21$400 to $499
- 33$500 to $599
- 14$600 to $699
- 30$700 to $799
- 4$800 to $899
- 6$900 to $999
- 16$1,000 to $1,249
- 6$1,250 to $1,499
- 5$2,000 or more

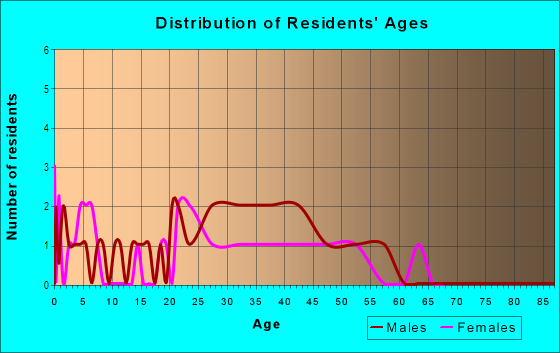
| Males: | 317 |
| Females: | 329 |
Males:
| This neighborhood: | |
| Whole city: |
| This neighborhood: | |
| Whole city: |
Percentage of family households:
| Northwest 39 Street Enclave: | 47.3% |
| Oklahoma City: | 47.3% |
| Here: | 45.1% |
| Oklahoma City: | 43.0% |
Percentage of married-couple families with children (among all households):
| Northwest 39 Street Enclave: | 33.9% |
| Oklahoma City: | 24.7% |
Percentage of single-mother households (among all households):
| Northwest 39 Street Enclave: | 1.4% |
| Oklahoma City: | 11.9% |
Percentage of never married males 15 years old and over:
Percentage of never married females 15 years old and over:
| Northwest 39 Street Enclave: | 23.4% |
| Oklahoma City: | 17.7% |
Percentage of never married females 15 years old and over:
| Northwest 39 Street Enclave: | 22.3% |
| city: | 16.7% |
Percentage of people that speak English not well or not at all:
| Northwest 39 Street Enclave: | 19.1% |
| Oklahoma City: | 4.2% |
Percentage of people born in this state:
Percentage of people born in another U.S. state:
Percentage of native residents but born outside the U.S.:
Percentage of foreign born residents:
| Here: | 54.3% |
| Oklahoma City: | 56.0% |
Percentage of people born in another U.S. state:
| Northwest 39 Street Enclave: | 29.2% |
| Oklahoma City: | 30.7% |
Percentage of native residents but born outside the U.S.:
| Here: | 1.7% |
| city: | 1.6% |
Percentage of foreign born residents:
| Here: | 14.8% |
| Oklahoma City: | 11.6% |
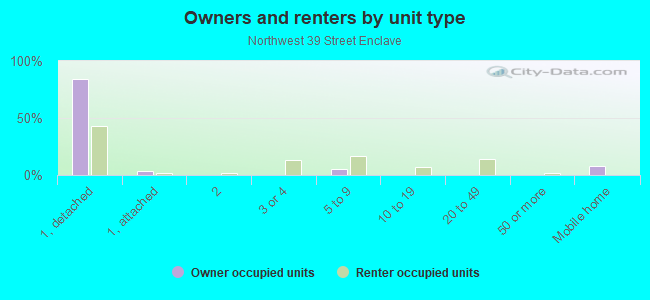
Owner-occupied
Renter-occupied

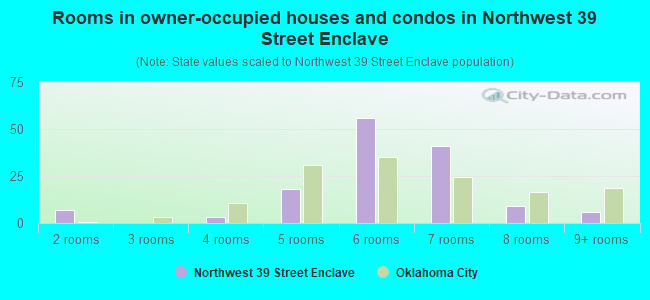
- Rooms in owner-occupied houses and condos in Northwest 39 Street Enclave
- 01 room
- 72 rooms
- 03 rooms
- 34 rooms
- 185 rooms
- 566 rooms
- 417 rooms
- 98 rooms
- 69+ rooms
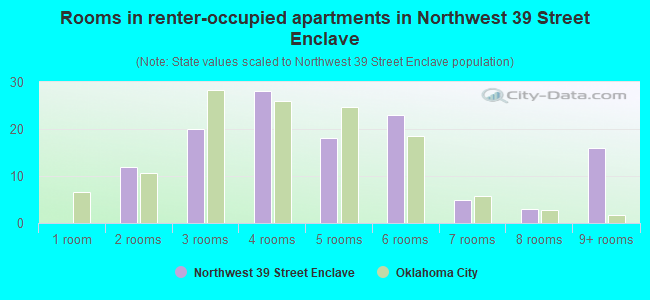
- Rooms in renter-occupied apartments in Northwest 39 Street Enclave
- 01 room
- 122 rooms
- 203 rooms
- 284 rooms
- 185 rooms
- 236 rooms
- 57 rooms
- 38 rooms
- 169+ rooms
Owner-occupied
Renter-occupied
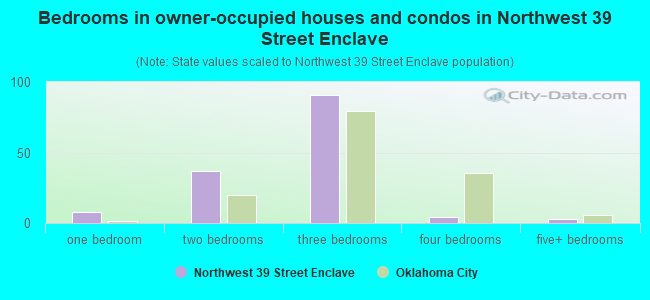
- Bedrooms in owner-occupied houses and condos in Northwest 39 Street Enclave
- 0no bedroom
- 81 bedroom
- 372 bedrooms
- 913 bedrooms
- 44 bedrooms
- 35+ bedrooms
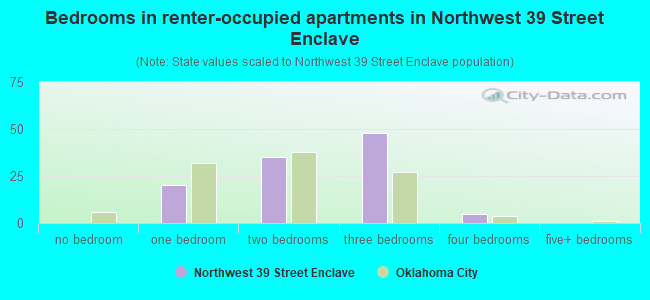
- Bedrooms in renter-occupied apartments in Northwest 39 Street Enclave
- 0no bedroom
- 201 bedroom
- 352 bedrooms
- 483 bedrooms
- 54 bedrooms
- 05+ bedrooms
Average number of cars or other vehicles available in houses/condos:
Average number of cars or other vehicles available in apartments:
| This neighborhood: | |
| Oklahoma City: |
Average number of cars or other vehicles available in apartments:
| Here: | |
| city: |
Percentage of units with a mortgage:
| Northwest 39 Street Enclave: | 60.1% |
| Oklahoma City: | 60.2% |
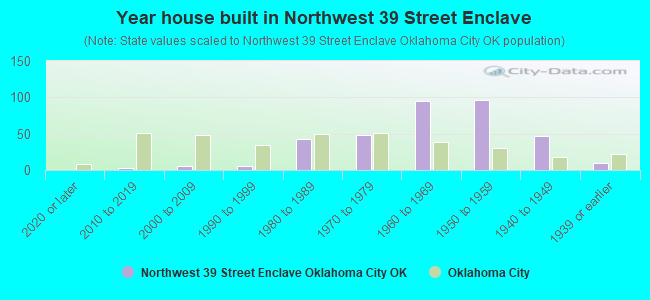
- Year house built in Northwest 39 Street Enclave
- 02020 or later
- 32010 to 2019
- 52000 to 2009
- 51990 to 1999
- 431980 to 1989
- 481970 to 1979
- 951960 to 1969
- 971950 to 1959
- 471940 to 1949
- 91939 or earlier
City-data.com crime index for city in 2020 (higher means more crime):
| City: | 430.2 |
| U.S. average: | 219.5 |
Travel time to work (commute)
![Travel time to work (commute)]()
- 5Less than 5 minutes
- 255 to 9 minutes
- 5110 to 14 minutes
- 5915 to 19 minutes
- 5620 to 24 minutes
- 1025 to 29 minutes
- 1230 to 34 minutes
- 135 to 39 minutes
- 140 to 44 minutes
- 1045 to 59 minutes
- 860 to 89 minutes
- 390 or more minutes

Means of transportation to work
![Means of transportation to work]()
- 77.4%225Drove a car alone
- 10.7%31Carpooled
- 1.7%5Walked
- 2.1%6Other means
- 11.4%33Worked at home

Time leaving home to go to work
![Time leaving home to go to work]()
- 712:00 a.m. to 4:59 a.m.
- 85:00 a.m. to 5:29 a.m.
- 55:30 a.m. to 5:59 a.m.
- 36:00 a.m. to 6:29 a.m.
- 296:30 a.m. to 6:59 a.m.
- 177:00 a.m. to 7:29 a.m.
- 467:30 a.m. to 7:59 a.m.
- 448:00 a.m. to 8:29 a.m.
- 178:30 a.m. to 8:59 a.m.
- 129:00 a.m. to 9:59 a.m.
- 910:00 a.m. to 10:59 a.m.
- 211:00 a.m. to 11:59 a.m.
- 1512:00 p.m. to 3:59 p.m.
- 134:00 p.m. to 11:59 p.m.

Occupations of males:
- Percentage of males in management occupations (except farmers):
Here: 7.8% city: 10.4%
- Percentage of males in business and financial operations occupations:
Here: 3.3% city: 4.8%
- Percentage of males in computer and mathematical occupations:
Here: 10.1% city: 4.9%
- Percentage of males in architecture and engineering occupations:
Here: 2.8% city: 3.6%
- Percentage of males in life, physical, and social science occupations:
Here: 1.7% city: 1.0%
- Percentage of males in education, training, and library occupations:
Here: 3.7% city: 2.7%
- Percentage of males in arts, design, entertainment, sports, and media occupations:
Here: 1.5% city: 2.1%
- Percentage of males in healthcare practitioners and technical occupations:
Here: 1.9% city: 3.9%
- Percentage of males in service occupations:
Here: 21.7% city: 13.2%
- Percentage of males in sales and office occupations:
Here: 20.5% city: 15.7%
- Percentage of males in farming, fishing, and forestry occupations:
Here: 3.3% city: 0.4%
- Percentage of males in construction, extraction, and maintenance occupations:
Here: 6.5% city: 11.0%
- Percentage of males in production occupations:
Here: 2.8% city: 6.3%
- Percentage of males in transportation occupations:
Here: 14.3% city: 5.4%
- Percentage of males in material moving occupations:
Here: 3.1% city: 5.6%
Occupations of females:
- Percentage of females in management occupations (except farmers):
Here: 4.3% city: 8.7%
- Percentage of females in business and financial operations occupations:
Here: 6.1% city: 7.6%
- Percentage of females in computer and mathematical occupations:
Here: 3.2% city: 1.9%
- Percentage of females in architecture and engineering occupations:
Here: 1.3% city: 0.8%
- Percentage of females in community and social services occupations:
Here: 4.7% city: 2.0%
- Percentage of females in legal occupations:
Here: 6.3% city: 1.6%
- Percentage of females in education, training, and library occupations:
Here: 6.6% city: 8.0%
- Percentage of females in healthcare practitioners and technical occupations:
Here: 9.0% city: 10.3%
- Percentage of females in service occupations:
Here: 24.4% city: 21.4%
- Percentage of females in sales and office occupations:
Here: 38.5% city: 27.6%
Percentage of people 16-64 in Armed Forces:
| Northwest 39 Street Enclave: | 0.3% |
| Oklahoma City: | 1.2% |
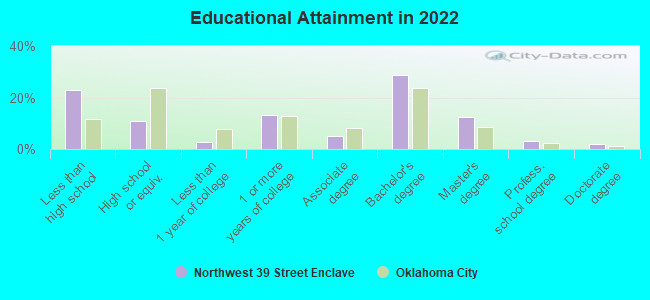
Education in this neighborhood (subdivision or community):
- Percentage of people 3 years and older in K-12 schools:
Northwest 39 Street Enclave: 34.7% Oklahoma City: 18.8%
- Percentage of people 3 years and older in undergraduate colleges:
Northwest 39 Street Enclave: 5.5% Oklahoma City: 5.0%
- Percentage of people 3 years and older in grad. or professional schools:
Northwest 39 Street Enclave: 2.4% Oklahoma City: 1.4%
- Percentage of students K-12 enrolled in private schools:
Northwest 39 Street Enclave: 27.4% Oklahoma City: 14.4%
Percentage of population below poverty level:
| Northwest 39 Street Enclave: | 26.1% |
| Oklahoma City: | 15.5% |
Percentage of married-couple families with both working:
| Northwest 39 Street Enclave: | 79.7% |
| Oklahoma City: | 64.6% |
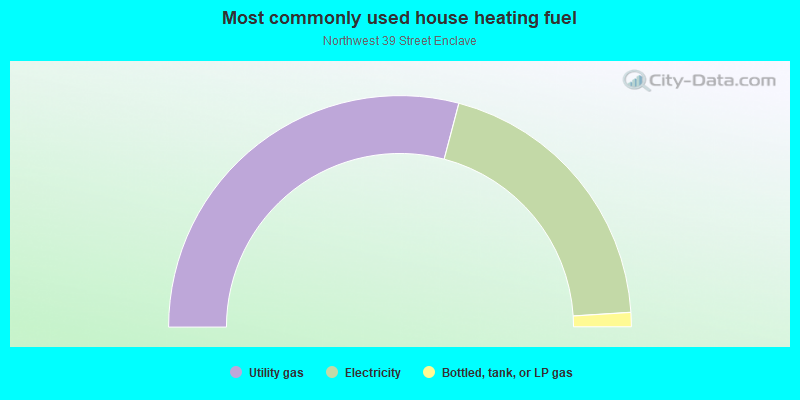
- 58.2%Utility gas
- 39.8%Electricity
- 2.0%Bottled, tank, or LP gas
Limited-access highways (interstate or state) in this neighborhood:
I- 44 (W I- 44 Svc Rd, State Hwy 66)
Length: 0.74 miles
Direction: E-W
Address range: 2340 to 2799
Direction: E-W
Address range: 2340 to 2799
Roads and streets:
NW 39th St
Length: 1.76 miles
Directions: E-W, N-S, SW-NE
Address range: 2200 to 2798
Directions: E-W, N-S, SW-NE
Address range: 2200 to 2798
W I-44 Hwy
Length: 0.48 miles
Direction: E-W
Direction: E-W
NW 39th Ter
Length: 0.22 miles
Direction: E-W
Address range: 2400 to 2599
Direction: E-W
Address range: 2400 to 2599
N Linn Ave
Length: 0.06 miles
Direction: N-S
Address range: 4001 to 4050
Direction: N-S
Address range: 4001 to 4050
Westlawn
Length: 0.05 miles
Direction: E-W
Direction: E-W
N Youngs Blvd
Length: 0.04 miles
Direction: N-S
Address range: 4000 to 4099
Direction: N-S
Address range: 4000 to 4099
N Chicago St
Length: 0.03 miles
Direction: N-S
Address range: 4000 to 4051
Direction: N-S
Address range: 4000 to 4051
N Barnes Ave
Length: 0.03 miles
Direction: N-S
Address range: 3916 to 3999
Direction: N-S
Address range: 3916 to 3999
Other features:
Deep Fork Riv
Length: 0.05 miles
Directions: N-S, SW-NE
Directions: N-S, SW-NE