Quail Springs neighborhood in Oklahoma City, Oklahoma (OK), 73120, 73134, 73142 detailed profile
Settings
X

Business Search - 14 Million verified businesses
Area: 1.062 square miles
Population: 2,945
Population density:
| Quail Springs: | 2,774 people per square mile |
| Oklahoma City: | 1,145 people per square mile |

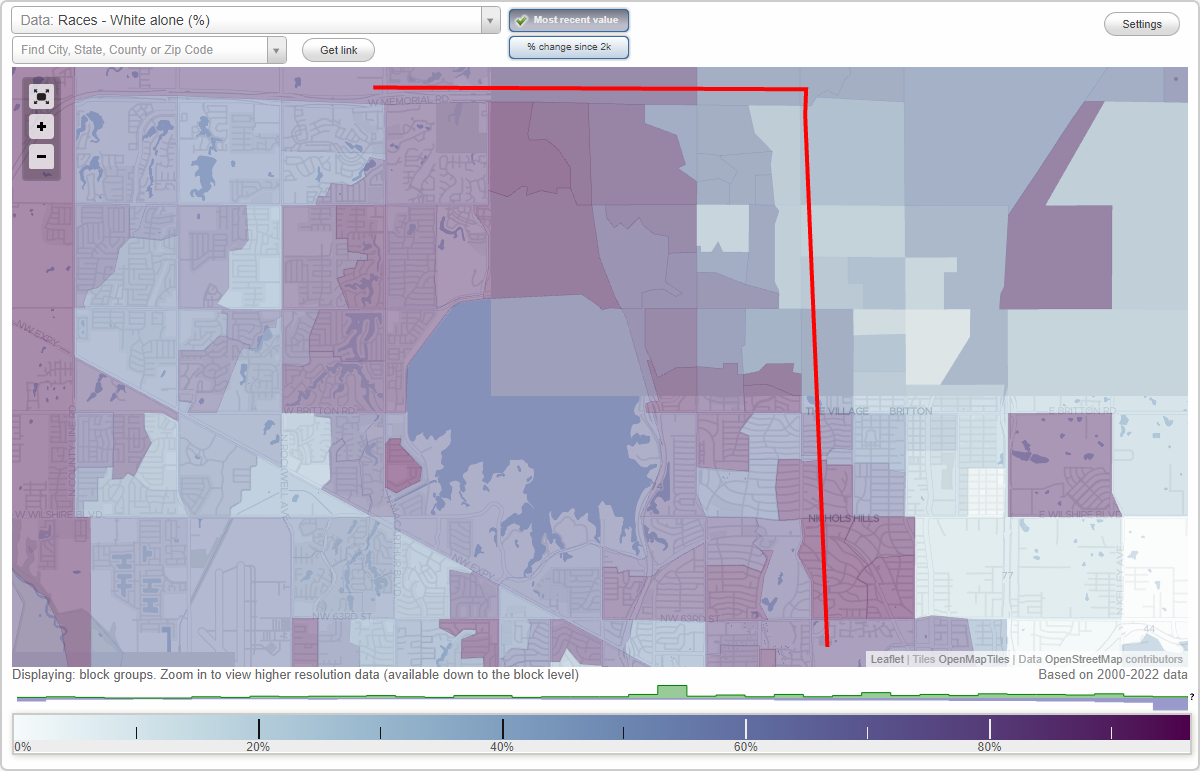
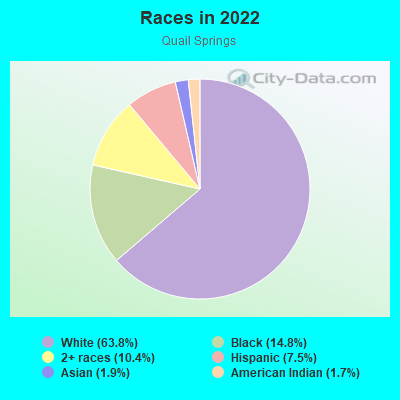
- 1,89263.8%White
- 43914.8%Black
- 30710.4%Two or more races
- 2227.5%Hispanic or Latino
- 561.9%Asian
- 501.7%American Indian
Median household income in 2022:
| Quail Springs: | $156,576 |
| Oklahoma City: | $63,713 |
Distribution of median household income
![Distribution of median household income]()
- 63Less than $10,000
- 67$10,000 to $19,999
- 71$20,000 to $29,999
- 228$30,000 to $39,999
- 59$40,000 to $49,999
- 268$50,000 to $59,999
- 106$60,000 to $74,999
- 160$75,000 to $99,999
- 26$100,000 to $124,999
- 123$125,000 to $149,999
- 148$150,000 to $199,999
- 362$200,000 or more

Distribution of owner-occupied house/condo value
![Distribution of owner-occupied house/condo value]()
- 6$150,000 to $199,999
- 31$200,000 to $249,999
- 109$250,000 to $299,999
- 183$300,000 to $399,999
- 187$400,000 to $499,999
- 178$500,000 to $749,999
- 125$750,000 to $999,999
- 86$1,000,000 or more

Distribution of rent paid by renters
![Distribution of rent paid by renters]()
- 40$200 to $299
- 137$500 to $599
- 394$600 to $699
- 382$700 to $799
- 35$1,000 to $1,249
- 110$1,250 to $1,499
- 29$1,500 to $1,999

Median rent in 2022:
| Quail Springs: | $840 |
| Oklahoma City: | $833 |
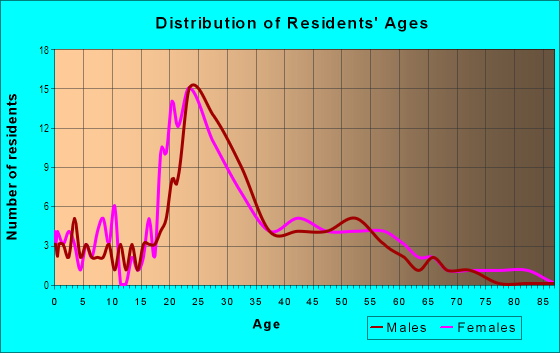
| Males: | 1,414 |
| Females: | 1,530 |
Males:
| This neighborhood: | 42.5 years |
| Whole city: | 33.6 years |
| This neighborhood: | 43.5 years |
| Whole city: | 35.8 years |
Average household size:
| Quail Springs: | 2.3 people |
| Oklahoma City: | 2.5 people |
Percentage of family households:
| Quail Springs: | 34.8% |
| Oklahoma City: | 47.3% |
| Here: | 43.3% |
| Oklahoma City: | 43.0% |
Percentage of married-couple families with children (among all households):
| Quail Springs: | 37.4% |
| Oklahoma City: | 24.7% |
Percentage of single-mother households (among all households):
| Quail Springs: | 10.4% |
| Oklahoma City: | 11.9% |
Percentage of never married males 15 years old and over:
Percentage of never married females 15 years old and over:
| Quail Springs: | 17.4% |
| Oklahoma City: | 17.7% |
Percentage of never married females 15 years old and over:
| Quail Springs: | 15.0% |
| city: | 16.7% |
Percentage of people that speak English not well or not at all:
| Quail Springs: | 0.0% |
| Oklahoma City: | 4.2% |
Percentage of people born in this state:
Percentage of people born in another U.S. state:
Percentage of native residents but born outside the U.S.:
Percentage of foreign born residents:
| Here: | 55.4% |
| Oklahoma City: | 56.0% |
Percentage of people born in another U.S. state:
| Quail Springs: | 41.0% |
| Oklahoma City: | 30.7% |
Percentage of native residents but born outside the U.S.:
| Here: | 0.3% |
| city: | 1.6% |
Percentage of foreign born residents:
| Here: | 3.3% |
| Oklahoma City: | 11.6% |
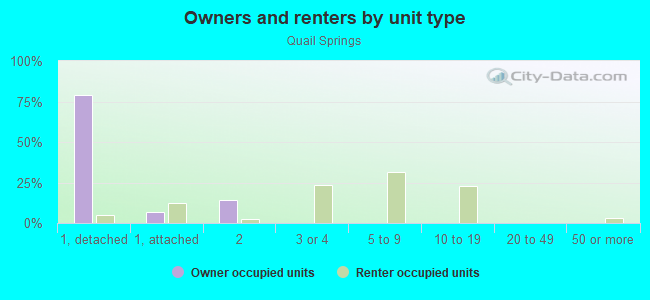
Owner-occupied
Renter-occupied

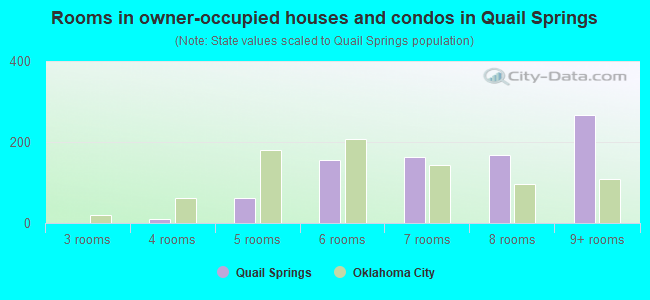
- Rooms in owner-occupied houses and condos in Quail Springs
- 01 room
- 02 rooms
- 03 rooms
- 94 rooms
- 625 rooms
- 1566 rooms
- 1637 rooms
- 1688 rooms
- 2679+ rooms
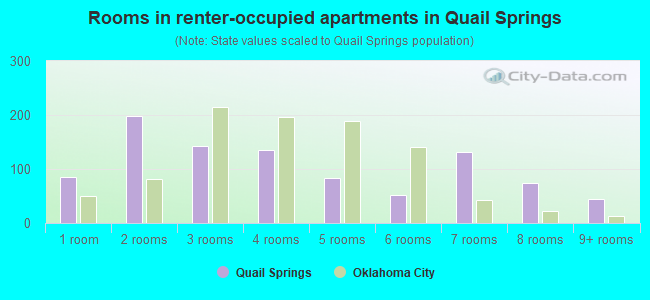
- Rooms in renter-occupied apartments in Quail Springs
- 851 room
- 1992 rooms
- 1423 rooms
- 1354 rooms
- 845 rooms
- 526 rooms
- 1317 rooms
- 748 rooms
- 459+ rooms
Owner-occupied
Renter-occupied
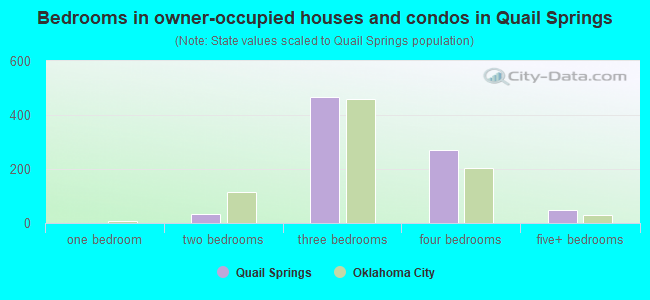
- Bedrooms in owner-occupied houses and condos in Quail Springs
- 0no bedroom
- 01 bedroom
- 352 bedrooms
- 4653 bedrooms
- 2724 bedrooms
- 505+ bedrooms
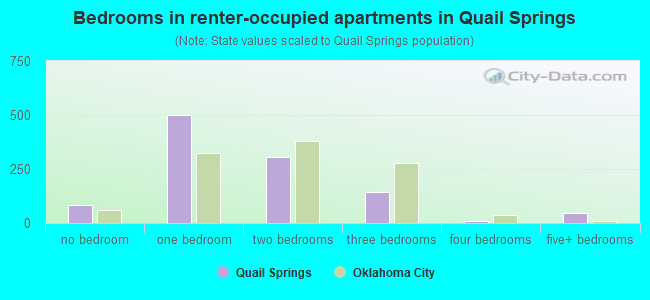
- Bedrooms in renter-occupied apartments in Quail Springs
- 85no bedroom
- 5011 bedroom
- 3072 bedrooms
- 1453 bedrooms
- 94 bedrooms
- 455+ bedrooms
Average number of cars or other vehicles available in houses/condos:
Average number of cars or other vehicles available in apartments:
| This neighborhood: | 2.0 |
| Oklahoma City: | 2.1 |
Average number of cars or other vehicles available in apartments:
| Here: | 1.5 |
| city: | 1.3 |
Percentage of units with a mortgage:
| Quail Springs: | 43.7% |
| Oklahoma City: | 60.2% |
Average estimated value of detached houses in 2022 (54.9% of all units):
| Quail Springs: | $691,952 |
| Oklahoma City: | $260,364 |
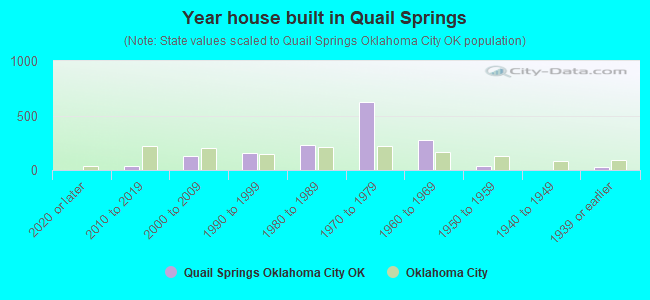
- Year house built in Quail Springs
- 02020 or later
- 412010 to 2019
- 1322000 to 2009
- 1561990 to 1999
- 2301980 to 1989
- 6221970 to 1979
- 2731960 to 1969
- 381950 to 1959
- 01940 to 1949
- 281939 or earlier
City-data.com crime index for city in 2020 (higher means more crime):
| City: | 430.2 |
| U.S. average: | 219.5 |
Travel time to work (commute)
![Travel time to work (commute)]()
- 14Less than 5 minutes
- 1265 to 9 minutes
- 14710 to 14 minutes
- 31715 to 19 minutes
- 27920 to 24 minutes
- 5325 to 29 minutes
- 8930 to 34 minutes
- 3235 to 39 minutes
- 960 to 89 minutes

Means of transportation to work
![Means of transportation to work]()
- 70.2%1,269Drove a car alone
- 2.8%51Carpooled
- 16.4%296Taxi
- 0.9%16Motorcycle
- 0.4%7Walked
- 1.2%22Other means
- 17.5%317Worked at home

Time leaving home to go to work
![Time leaving home to go to work]()
- 912:00 a.m. to 4:59 a.m.
- 855:00 a.m. to 5:29 a.m.
- 65:30 a.m. to 5:59 a.m.
- 716:00 a.m. to 6:29 a.m.
- 716:30 a.m. to 6:59 a.m.
- 587:00 a.m. to 7:29 a.m.
- 1987:30 a.m. to 7:59 a.m.
- 1538:00 a.m. to 8:29 a.m.
- 718:30 a.m. to 8:59 a.m.
- 1409:00 a.m. to 9:59 a.m.
- 10110:00 a.m. to 10:59 a.m.
- 511:00 a.m. to 11:59 a.m.
- 5612:00 p.m. to 3:59 p.m.
- 394:00 p.m. to 11:59 p.m.

Occupations of males:
- Percentage of males in management occupations (except farmers):
Here: 14.6% city: 10.4%
- Percentage of males in business and financial operations occupations:
Here: 9.6% city: 4.8%
- Percentage of males in computer and mathematical occupations:
Here: 7.4% city: 4.9%
- Percentage of males in architecture and engineering occupations:
Here: 8.5% city: 3.6%
- Percentage of males in life, physical, and social science occupations:
Here: 2.1% city: 1.0%
- Percentage of males in legal occupations:
Here: 3.7% city: 1.5%
- Percentage of males in education, training, and library occupations:
Here: 3.2% city: 2.7%
- Percentage of males in healthcare practitioners and technical occupations:
Here: 3.5% city: 3.9%
- Percentage of males in service occupations:
Here: 9.7% city: 13.2%
- Percentage of males in sales and office occupations:
Here: 23.2% city: 15.7%
- Percentage of males in production occupations:
Here: 3.7% city: 6.3%
- Percentage of males in transportation occupations:
Here: 10.3% city: 5.4%
Occupations of females:
- Percentage of females in management occupations (except farmers):
Here: 17.8% city: 8.7%
- Percentage of females in business and financial operations occupations:
Here: 7.8% city: 7.6%
- Percentage of females in computer and mathematical occupations:
Here: 3.3% city: 1.9%
- Percentage of females in education, training, and library occupations:
Here: 3.2% city: 8.0%
- Percentage of females in arts, design, entertainment, sports, and media occupations:
Here: 4.8% city: 1.6%
- Percentage of females in healthcare practitioners and technical occupations:
Here: 5.1% city: 10.3%
- Percentage of females in service occupations:
Here: 20.8% city: 21.4%
- Percentage of females in sales and office occupations:
Here: 26.0% city: 27.6%
- Percentage of females in production occupations:
Here: 8.1% city: 3.1%
- Percentage of females in material moving occupations:
Here: 2.6% city: 2.7%
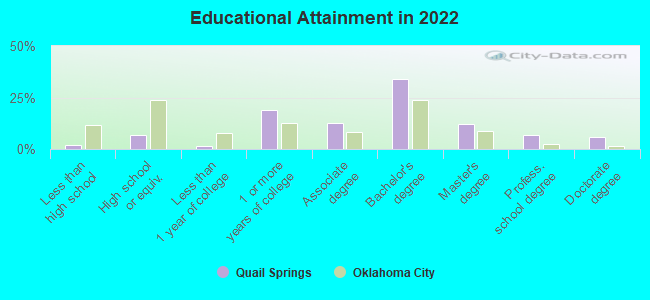
Education in this neighborhood (subdivision or community):
- Percentage of people 3 years and older in K-12 schools:
Quail Springs: 16.6% Oklahoma City: 18.8%
- Percentage of people 3 years and older in undergraduate colleges:
Quail Springs: 9.4% Oklahoma City: 5.0%
- Percentage of people 3 years and older in grad. or professional schools:
Quail Springs: 1.8% Oklahoma City: 1.4%
- Percentage of students K-12 enrolled in private schools:
Quail Springs: 51.9% Oklahoma City: 14.4%
Percentage of population below poverty level:
| Quail Springs: | 4.8% |
| Oklahoma City: | 15.5% |
Median year owner moved in (as recorded in 2022):
Median year renter moved in (as recorded in 2022):
| Quail Springs: | 2006 |
| Oklahoma City: | 2013 |
Median year renter moved in (as recorded in 2022):
| Quail Springs: | 2018 |
| Oklahoma City: | 2020 |
Percentage of married-couple families with both working:
| Quail Springs: | 79.6% |
| Oklahoma City: | 64.6% |
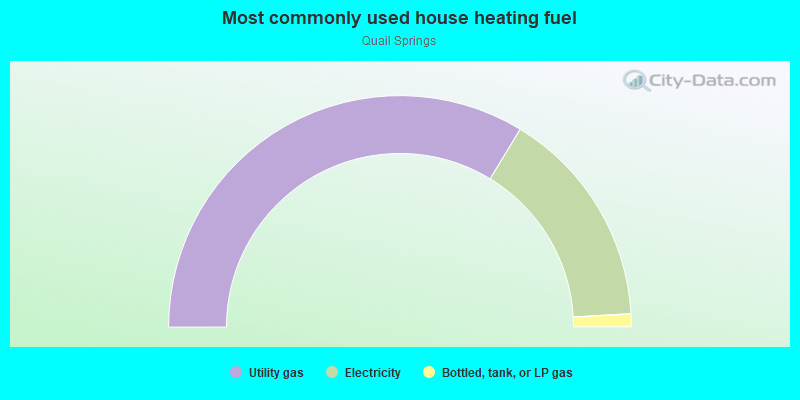
- 67.4%Utility gas
- 30.8%Electricity
- 1.8%Bottled, tank, or LP gas
Highways in this neighborhood:
State Hwy 74 (N Portland Ave, Lake Hefner Pkwy)
Length: 0.27 miles
Direction: N-S
Address range: 13301 to 13705
Direction: N-S
Address range: 13301 to 13705
Roads and streets:
W Memorial Rd
Length: 10.53 miles
Directions: E-W, N-S
Address range: 2100 to 5898
Directions: E-W, N-S
Address range: 2100 to 5898
W John Kilpatrick Tpke
Length: 8.17 miles
Direction: E-W
Address range: 2500 to 3299
Direction: E-W
Address range: 2500 to 3299
N Meridian Ave
Length: 0.18 miles
Direction: N-S
Address range: 13456 to 13699
Direction: N-S
Address range: 13456 to 13699
Lake Hefner Pkwy
Length: 0.17 miles
Direction: N-S
Direction: N-S
Clearbrook Rd
Length: 0.16 miles
Direction: N-S
Address range: 13528 to 13699
Direction: N-S
Address range: 13528 to 13699
Robert E Lee
Length: 0.12 miles
Direction: N-S
Address range: 13600 to 13699
Direction: N-S
Address range: 13600 to 13699
Highland Park Blvd
Length: 0.10 miles
Direction: N-S
Address range: 13650 to 13676
Direction: N-S
Address range: 13650 to 13676
N Macarthur Blvd
Length: 0.09 miles
Direction: N-S
Address range: 13700 to 13767
Direction: N-S
Address range: 13700 to 13767
N Pennsylvania Ave
Length: 0.09 miles
Direction: N-S
Address range: 13341 to 13599
Direction: N-S
Address range: 13341 to 13599
N May Ave
Length: 0.08 miles
Direction: N-S
Direction: N-S
Quail Springs Pkwy
Length: 0.07 miles
Direction: N-S
Address range: 13700 to 13899
Direction: N-S
Address range: 13700 to 13899
Green Valley Dr
Length: 0.04 miles
Direction: N-S
Address range: 13507 to 13699
Direction: N-S
Address range: 13507 to 13699
Other features:
Dry Crk
Length: 0.30 miles
Directions: E-W, N-S, SE-NW
Directions: E-W, N-S, SE-NW
Bluff Crk
Length: 0.08 miles
Directions: N-S, SW-NE
Directions: N-S, SW-NE