Sylvania Courts neighborhood in Bellaire, Texas (TX), 77401 detailed profile
Settings
X


Business Search - 14 Million verified businesses
Area: 0.186 square miles
Population: 807
Population density:
| Sylvania Courts: | 4,348 people per square mile |
| Bellaire: | 4,739 people per square mile |

- 43053.4%White
- 16620.6%Asian
- 12415.4%Hispanic or Latino
- 708.7%Two or more races
- 151.9%Black

Median household income in 2022:
| Sylvania Courts: | $218,283 |
| Bellaire: | $215,636 |
Distribution of median household income
![Distribution of median household income]()
- 17Less than $10,000
- 15$10,000 to $19,999
- 23$20,000 to $29,999
- 14$30,000 to $39,999
- 24$40,000 to $49,999
- 24$50,000 to $59,999
- 5$60,000 to $74,999
- 6$75,000 to $99,999
- 13$100,000 to $124,999
- 17$125,000 to $149,999
- 28$150,000 to $199,999
- 148$200,000 or more

Distribution of owner-occupied house/condo value
![Distribution of owner-occupied house/condo value]()
- 4Less than $50,000
- 3$50,000 to $99,999
- 4$100,000 to $149,999
- 16$150,000 to $199,999
- 5$200,000 to $249,999
- 10$250,000 to $299,999
- 31$300,000 to $399,999
- 19$400,000 to $499,999
- 39$500,000 to $749,999
- 63$750,000 to $999,999
- 100$1,000,000 or more

Distribution of rent paid by renters
![Distribution of rent paid by renters]()
- 5$500 to $599
- 9$900 to $999
- 5$1,000 to $1,249
- 37$1,250 to $1,499
- 20$1,500 to $1,999
- 34$2,000 or more

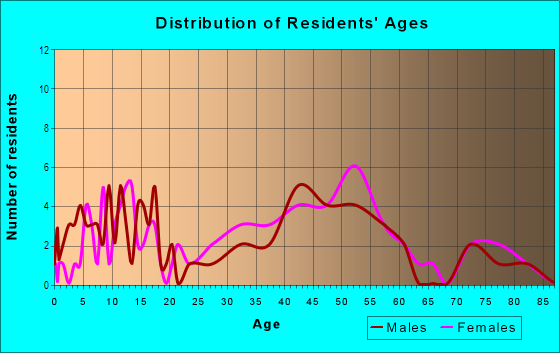
| Males: | 391 |
| Females: | 415 |
Males:
| This neighborhood: | 45.7 years |
| Whole city: | 43.8 years |
| This neighborhood: | 44.3 years |
| Whole city: | 44.9 years |
Average household size:
| Sylvania Courts: | 2.6 people |
| Bellaire: | 2.8 people |
Percentage of family households:
| Sylvania Courts: | 50.3% |
| Bellaire: | 58.0% |
| Here: | 60.1% |
| Bellaire: | 74.9% |
Percentage of married-couple families with children (among all households):
| Sylvania Courts: | 38.1% |
| Bellaire: | 34.0% |
Percentage of single-mother households (among all households):
| Sylvania Courts: | 2.1% |
| Bellaire: | 1.1% |
Percentage of never married males 15 years old and over:
Percentage of never married females 15 years old and over:
| Sylvania Courts: | 12.7% |
| Bellaire: | 11.3% |
Percentage of never married females 15 years old and over:
| Sylvania Courts: | 8.4% |
| city: | 11.6% |
Percentage of people that speak English not well or not at all:
| Sylvania Courts: | 1.3% |
| Bellaire: | 2.4% |
Percentage of people born in this state:
Percentage of people born in another U.S. state:
Percentage of native residents but born outside the U.S.:
Percentage of foreign born residents:
| Here: | 45.3% |
| Bellaire: | 49.6% |
Percentage of people born in another U.S. state:
| Sylvania Courts: | 26.2% |
| Bellaire: | 25.6% |
Percentage of native residents but born outside the U.S.:
| Here: | 1.6% |
| city: | 2.0% |
Percentage of foreign born residents:
| Here: | 27.0% |
| Bellaire: | 22.8% |

Owner-occupied
Renter-occupied


- Rooms in owner-occupied houses and condos in Sylvania Courts
- 21 room
- 02 rooms
- 03 rooms
- 54 rooms
- 145 rooms
- 326 rooms
- 417 rooms
- 418 rooms
- 1149+ rooms

- Rooms in renter-occupied apartments in Sylvania Courts
- 91 room
- 62 rooms
- 153 rooms
- 264 rooms
- 105 rooms
- 106 rooms
- 37 rooms
- 48 rooms
- 39+ rooms
Owner-occupied
Renter-occupied

- Bedrooms in owner-occupied houses and condos in Sylvania Courts
- 2no bedroom
- 31 bedroom
- 272 bedrooms
- 523 bedrooms
- 984 bedrooms
- 675+ bedrooms

- Bedrooms in renter-occupied apartments in Sylvania Courts
- 9no bedroom
- 221 bedroom
- 342 bedrooms
- 83 bedrooms
- 44 bedrooms
- 05+ bedrooms
Average number of cars or other vehicles available in houses/condos:
Average number of cars or other vehicles available in apartments:
| This neighborhood: | 2.0 |
| Bellaire: | 2.2 |
Average number of cars or other vehicles available in apartments:
| Here: | |
| city: |
Percentage of units with a mortgage:
| Sylvania Courts: | 48.5% |
| Bellaire: | 53.4% |
Average estimated value of detached houses in 2022 (64.4% of all units):
| Sylvania Courts: | $957,973 |
| Texas: | $369,058 |

- Year house built in Sylvania Courts
- 52020 or later
- 312010 to 2019
- 562000 to 2009
- 991990 to 1999
- 401980 to 1989
- 631970 to 1979
- 281960 to 1969
- 291950 to 1959
- 81940 to 1949
- 111939 or earlier

City-data.com crime index for city in 2020 (higher means more crime):
| City: | 83.0 |
| U.S. average: | 219.5 |
Travel time to work (commute)
![Travel time to work (commute)]()
- 19Less than 5 minutes
- 145 to 9 minutes
- 3010 to 14 minutes
- 7115 to 19 minutes
- 9220 to 24 minutes
- 1825 to 29 minutes
- 5030 to 34 minutes
- 1335 to 39 minutes
- 1640 to 44 minutes
- 1145 to 59 minutes
- 260 to 89 minutes
- 690 or more minutes

Means of transportation to work
![Means of transportation to work]()
- 69.0%264Drove a car alone
- 1.3%5Carpooled
- 5.0%19Taxi
- 3.1%12Bicycle
- 3.9%15Walked
- 1.0%4Other means
- 24.3%93Worked at home

Time leaving home to go to work
![Time leaving home to go to work]()
- 3812:00 a.m. to 4:59 a.m.
- 25:00 a.m. to 5:29 a.m.
- 55:30 a.m. to 5:59 a.m.
- 206:00 a.m. to 6:29 a.m.
- 236:30 a.m. to 6:59 a.m.
- 477:00 a.m. to 7:29 a.m.
- 487:30 a.m. to 7:59 a.m.
- 638:00 a.m. to 8:29 a.m.
- 488:30 a.m. to 8:59 a.m.
- 359:00 a.m. to 9:59 a.m.
- 2010:00 a.m. to 10:59 a.m.
- 612:00 p.m. to 3:59 p.m.
- 54:00 p.m. to 11:59 p.m.

Occupations of males:
- Percentage of males in management occupations (except farmers):
Here: 17.1% city: 22.3%
- Percentage of males in computer and mathematical occupations:
Here: 12.6% city: 7.8%
- Percentage of males in architecture and engineering occupations:
Here: 4.2% city: 8.1%
- Percentage of males in life, physical, and social science occupations:
Here: 6.2% city: 3.4%
- Percentage of males in legal occupations:
Here: 2.4% city: 7.7%
- Percentage of males in education, training, and library occupations:
Here: 13.7% city: 3.6%
- Percentage of males in arts, design, entertainment, sports, and media occupations:
Here: 1.3% city: 1.8%
- Percentage of males in healthcare practitioners and technical occupations:
Here: 19.6% city: 18.7%
- Percentage of males in sales and office occupations:
Here: 17.2% city: 12.1%
- Percentage of males in production occupations:
Here: 1.5% city: 1.5%
- Percentage of males in transportation occupations:
Here: 1.7% city: 0.9%
Occupations of females:
- Percentage of females in management occupations (except farmers):
Here: 12.5% city: 12.4%
- Percentage of females in business and financial operations occupations:
Here: 8.2% city: 9.5%
- Percentage of females in computer and mathematical occupations:
Here: 1.2% city: 3.7%
- Percentage of females in life, physical, and social science occupations:
Here: 1.8% city: 5.2%
- Percentage of females in legal occupations:
Here: 4.0% city: 2.9%
- Percentage of females in education, training, and library occupations:
Here: 27.1% city: 15.8%
- Percentage of females in arts, design, entertainment, sports, and media occupations:
Here: 4.5% city: 1.4%
- Percentage of females in healthcare practitioners and technical occupations:
Here: 19.5% city: 15.2%
- Percentage of females in service occupations:
Here: 5.5% city: 8.2%
- Percentage of females in sales and office occupations:
Here: 15.2% city: 16.0%
Education in this neighborhood (subdivision or community):
- Percentage of people 3 years and older in K-12 schools:
Sylvania Courts: 22.5% Bellaire: 22.0%
- Percentage of people 3 years and older in undergraduate colleges:
Sylvania Courts: 2.4% Bellaire: 2.8%
- Percentage of people 3 years and older in grad. or professional schools:
Sylvania Courts: 1.9% Bellaire: 1.6%
- Percentage of students K-12 enrolled in private schools:
Sylvania Courts: 50.8% Bellaire: 40.1%
Percentage of population below poverty level:
| Sylvania Courts: | 3.8% |
| Bellaire: | 2.2% |
Median year owner moved in (as recorded in 2022):
| Sylvania Courts: | 2009 |
| Bellaire: | 2008 |
Percentage of married-couple families with both working:
| Sylvania Courts: | 77.3% |
| Bellaire: | 71.4% |

- 62.8%Utility gas
- 27.2%Electricity
- 6.0%Bottled, tank, or LP gas
- 4.1%Other fuel
Roads and streets:
Mulberry Ln
Length: 0.73 miles
Direction: N-S
Address range: 100 to 957
Direction: N-S
Address range: 100 to 957
Basswood Ln
Length: 0.15 miles
Directions: E-W, SW-NE
Address range: 4401 to 4499
Directions: E-W, SW-NE
Address range: 4401 to 4499
Bellaire Blvd
Length: 0.14 miles
Direction: E-W
Address range: 4300 to 4399
Direction: E-W
Address range: 4300 to 4399
Serenity Ln
Length: 0.13 miles
Directions: E-W, N-S, SW-NE
Address range: 4400 to 4499
Directions: E-W, N-S, SW-NE
Address range: 4400 to 4499
Newcastle St
Length: 0.11 miles
Direction: N-S
Address range: 5747 to 5999
Direction: N-S
Address range: 5747 to 5999
Lampton Cir
Length: 0.09 miles
Direction: E-W
Address range: 4300 to 4399
Direction: E-W
Address range: 4300 to 4399
Compton Cir
Length: 0.09 miles
Direction: E-W
Address range: 4300 to 4399
Direction: E-W
Address range: 4300 to 4399
Lamont Cir
Length: 0.09 miles
Direction: E-W
Address range: 4300 to 4399
Direction: E-W
Address range: 4300 to 4399
Bissonnet St
Length: 0.08 miles
Direction: SW-NE
Address range: 4419 to 4499
Direction: SW-NE
Address range: 4419 to 4499
Olene
Length: 0.04 miles
Direction: SE-NW
Address range: 900 to 999
Direction: SE-NW
Address range: 900 to 999
Railroad features:
Southern Pacific RR
Length: 0.68 miles
Direction: N-S
Direction: N-S