UC Berkeley (Campus) neighborhood in Berkeley, California (CA), 94720 detailed profile
Settings
X


Business Search - 14 Million verified businesses
Area: 0.583 square miles
Population: 5,295
Population density:
| UC Berkeley (Campus): | 9,081 people per square mile |
| Berkeley: | 11,372 people per square mile |

- 2,06638.8%White
- 1,82334.3%Asian
- 84916.0%Hispanic or Latino
- 3646.8%Two or more races
- 1893.6%Black
- 240.5%American Indian
- 40.08%Some other race

Distribution of median household income
![Distribution of median household income]()
- 234Less than $10,000
- 208$10,000 to $19,999
- 180$20,000 to $29,999
- 24$30,000 to $39,999
- 591$40,000 to $49,999
- 78$50,000 to $59,999
- 155$60,000 to $74,999
- 495$75,000 to $99,999
- 139$100,000 to $124,999
- 47$125,000 to $149,999
- 62$150,000 to $199,999
- 309$200,000 or more

Distribution of owner-occupied house/condo value
![Distribution of owner-occupied house/condo value]()
- 4$100,000 to $149,999
- 4$150,000 to $199,999
- 74$200,000 to $249,999
- 40$400,000 to $499,999
- 126$500,000 to $749,999
- 108$750,000 to $999,999
- 372$1,000,000 or more

Distribution of rent paid by renters
![Distribution of rent paid by renters]()
- 180$200 to $299
- 66$500 to $599
- 57$600 to $699
- 41$700 to $799
- 300$800 to $899
- 131$900 to $999
- 13$1,000 to $1,249
- 353$1,250 to $1,499
- 346$1,500 to $1,999
- 845$2,000 or more

Median rent in 2022:
| UC Berkeley (Campus): | $2,364 |
| Berkeley: | $1,876 |
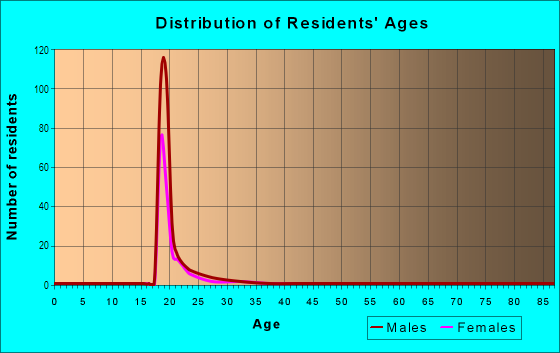
| Males: | 3,098 |
| Females: | 2,197 |
Males:
| This neighborhood: | 30.8 years |
| Whole city: | 31.4 years |
| This neighborhood: | 31.2 years |
| Whole city: | 31.7 years |
Average household size:
| UC Berkeley (Campus): | 2.2 people |
| Berkeley: | 2.3 people |
Percentage of family households:
| UC Berkeley (Campus): | 31.3% |
| Berkeley: | 31.4% |
| Here: | 29.4% |
| Berkeley: | 34.9% |
Percentage of married-couple families with children (among all households):
| UC Berkeley (Campus): | 17.9% |
| Berkeley: | 30.5% |
Percentage of single-mother households (among all households):
| UC Berkeley (Campus): | 8.4% |
| Berkeley: | 7.7% |
Percentage of never married males 15 years old and over:
Percentage of never married females 15 years old and over:
| UC Berkeley (Campus): | 46.6% |
| Berkeley: | 26.2% |
Percentage of never married females 15 years old and over:
| UC Berkeley (Campus): | 31.2% |
| city: | 29.6% |
Percentage of people that speak English not well or not at all:
| UC Berkeley (Campus): | 2.1% |
| Berkeley: | 1.9% |
Percentage of people born in this state:
Percentage of people born in another U.S. state:
Percentage of native residents but born outside the U.S.:
Percentage of foreign born residents:
| Here: | 39.4% |
| Berkeley: | 46.8% |
Percentage of people born in another U.S. state:
| UC Berkeley (Campus): | 25.2% |
| Berkeley: | 29.9% |
Percentage of native residents but born outside the U.S.:
| Here: | 1.9% |
| city: | 2.5% |
Percentage of foreign born residents:
| Here: | 33.5% |
| Berkeley: | 20.8% |

Owner-occupied
Renter-occupied


- Rooms in owner-occupied houses and condos in UC Berkeley <
> - 771 room
- 492 rooms
- 1773 rooms
- 884 rooms
- 55 rooms
- 486 rooms
- 297 rooms
- 888 rooms
- 699+ rooms

- Rooms in renter-occupied apartments in UC Berkeley <
> - 3471 room
- 1202 rooms
- 1793 rooms
- 2574 rooms
- 125 rooms
- 1226 rooms
- 1237 rooms
- 28 rooms
- 219+ rooms
Owner-occupied
Renter-occupied

- Bedrooms in owner-occupied houses and condos in UC Berkeley <
> - 77no bedroom
- 1821 bedroom
- 902 bedrooms
- 1493 bedrooms
- 594 bedrooms
- 155+ bedrooms

- Bedrooms in renter-occupied apartments in UC Berkeley <
> - 468no bedroom
- 2531 bedroom
- 1902 bedrooms
- 2263 bedrooms
- 144 bedrooms
- 645+ bedrooms
Average number of cars or other vehicles available in houses/condos:
Average number of cars or other vehicles available in apartments:
| This neighborhood: | |
| Berkeley: |
Average number of cars or other vehicles available in apartments:
| Here: | 1.3 |
| city: | 0.9 |
Percentage of units with a mortgage:
| UC Berkeley (Campus): | 44.2% |
| Berkeley: | 67.6% |

- Year house built in UC Berkeley <
> - 162020 or later
- 112010 to 2019
- 262000 to 2009
- 1381990 to 1999
- 1751980 to 1989
- 1421970 to 1979
- 4731960 to 1969
- 1301950 to 1959
- 881940 to 1949
- 4311939 or earlier

City-data.com crime index for city in 2020 (higher means more crime):
| City: | 368.9 |
| U.S. average: | 219.5 |
Travel time to work (commute)
![Travel time to work (commute)]()
- 26Less than 5 minutes
- 2755 to 9 minutes
- 44310 to 14 minutes
- 60415 to 19 minutes
- 26220 to 24 minutes
- 11225 to 29 minutes
- 16930 to 34 minutes
- 5535 to 39 minutes
- 6940 to 44 minutes
- 9545 to 59 minutes
- 13160 to 89 minutes
- 7090 or more minutes

Means of transportation to work
![Means of transportation to work]()
- 19.1%491Drove a car alone
- 5.6%145Carpooled
- 5.5%142Bus
- 10.3%264Subway or elevated rail
- 7.2%186Long-distance train or commuter rail
- 1.2%32Taxi
- 1.6%40Bicycle
- 32.5%836Walked
- 16.4%423Other means
- 26.2%675Worked at home

Time leaving home to go to work
![Time leaving home to go to work]()
- 3912:00 a.m. to 4:59 a.m.
- 25:00 a.m. to 5:29 a.m.
- 745:30 a.m. to 5:59 a.m.
- 526:00 a.m. to 6:29 a.m.
- 246:30 a.m. to 6:59 a.m.
- 1567:00 a.m. to 7:29 a.m.
- 2637:30 a.m. to 7:59 a.m.
- 2608:00 a.m. to 8:29 a.m.
- 2518:30 a.m. to 8:59 a.m.
- 7359:00 a.m. to 9:59 a.m.
- 27810:00 a.m. to 10:59 a.m.
- 7111:00 a.m. to 11:59 a.m.
- 15512:00 p.m. to 3:59 p.m.
- 2374:00 p.m. to 11:59 p.m.

Occupations of males:
- Percentage of males in management occupations (except farmers):
Here: 10.6% city: 12.9%
- Percentage of males in business and financial operations occupations:
Here: 1.7% city: 5.0%
- Percentage of males in computer and mathematical occupations:
Here: 3.0% city: 12.2%
- Percentage of males in architecture and engineering occupations:
Here: 7.3% city: 6.4%
- Percentage of males in life, physical, and social science occupations:
Here: 6.0% city: 6.6%
- Percentage of males in education, training, and library occupations:
Here: 27.7% city: 11.4%
- Percentage of males in arts, design, entertainment, sports, and media occupations:
Here: 6.1% city: 6.4%
- Percentage of males in service occupations:
Here: 10.5% city: 9.3%
- Percentage of males in sales and office occupations:
Here: 12.9% city: 11.2%
- Percentage of males in production occupations:
Here: 4.1% city: 1.4%
- Percentage of males in transportation occupations:
Here: 6.6% city: 2.1%
- Percentage of males in material moving occupations:
Here: 1.5% city: 1.8%
Occupations of females:
- Percentage of females in management occupations (except farmers):
Here: 8.1% city: 14.2%
- Percentage of females in business and financial operations occupations:
Here: 6.2% city: 7.4%
- Percentage of females in computer and mathematical occupations:
Here: 3.1% city: 3.9%
- Percentage of females in architecture and engineering occupations:
Here: 3.3% city: 2.4%
- Percentage of females in life, physical, and social science occupations:
Here: 2.3% city: 5.5%
- Percentage of females in community and social services occupations:
Here: 6.4% city: 3.2%
- Percentage of females in education, training, and library occupations:
Here: 11.8% city: 14.4%
- Percentage of females in arts, design, entertainment, sports, and media occupations:
Here: 6.6% city: 7.0%
- Percentage of females in service occupations:
Here: 16.1% city: 12.4%
- Percentage of females in sales and office occupations:
Here: 26.0% city: 18.1%
- Percentage of females in material moving occupations:
Here: 8.7% city: 1.0%
Education in this neighborhood (subdivision or community):
- Percentage of people 3 years and older in K-12 schools:
UC Berkeley (Campus): 2.6% Berkeley: 9.8%
- Percentage of people 3 years and older in undergraduate colleges:
UC Berkeley (Campus): 56.3% Berkeley: 22.4%
- Percentage of people 3 years and older in grad. or professional schools:
UC Berkeley (Campus): 11.8% Berkeley: 6.8%
- Percentage of students K-12 enrolled in private schools:
UC Berkeley (Campus): 37.2% Berkeley: 25.0%
Percentage of population below poverty level:
| UC Berkeley (Campus): | 22.4% |
| Berkeley: | 19.0% |
Median year renter moved in (as recorded in 2022):
| UC Berkeley (Campus): | 2017 |
| Berkeley: | 2021 |
Percentage of married-couple families with both working:
| UC Berkeley (Campus): | 57.4% |
| Berkeley: | 78.8% |

- 65.4%Utility gas
- 21.0%Electricity
- 6.8%No fuel used
- 2.2%Fuel oil, kerosene, etc.
- 1.8%Other fuel
- 1.5%Bottled, tank, or LP gas
- 1.3%Solar energy
Roads and streets:
Cyclotron Rd
Length: 1.85 miles
Directions: E-W, N-S, SE-NW, SW-NE
Directions: E-W, N-S, SE-NW, SW-NE
Hearst Ave
Length: 0.69 miles
Direction: E-W
Direction: E-W
Oxford St
Length: 0.64 miles
Directions: N-S, SW-NE
Address range: 1950 to 2299
Directions: N-S, SW-NE
Address range: 1950 to 2299
University Dr
Length: 0.60 miles
Directions: E-W, SE-NW, SW-NE
Directions: E-W, SE-NW, SW-NE
Gayley Rd
Length: 0.30 miles
Direction: SE-NW
Direction: SE-NW
Campanile Way
Length: 0.24 miles
Direction: E-W
Direction: E-W
Wickson Rd
Length: 0.23 miles
Directions: E-W, N-S, SE-NW, SW-NE
Directions: E-W, N-S, SE-NW, SW-NE
W Entrance
Length: 0.22 miles
Directions: E-W, N-S, SE-NW, SW-NE
Directions: E-W, N-S, SE-NW, SW-NE
Sather Rd
Length: 0.18 miles
Directions: N-S, SE-NW
Directions: N-S, SE-NW
Haviland Rd
Length: 0.15 miles
Directions: E-W, N-S, SW-NE
Directions: E-W, N-S, SW-NE
S Hall Rd
Length: 0.11 miles
Directions: N-S, SE-NW
Directions: N-S, SE-NW
Fulton St
Length: 0.07 miles
Directions: N-S, SW-NE
Address range: 2200 to 2229
Directions: N-S, SW-NE
Address range: 2200 to 2229
Centennial Dr
Length: 0.07 miles
Directions: E-W, SE-NW
Directions: E-W, SE-NW
Harmon Way
Length: 0.06 miles
Directions: N-S, SE-NW
Directions: N-S, SE-NW
Eshleman Rd
Length: 0.06 miles
Direction: E-W
Direction: E-W
Piedmont Ave
Length: 0.05 miles
Direction: N-S
Address range: 2200 to 2203
Direction: N-S
Address range: 2200 to 2203
Allston Way
Length: 0.01 miles
Direction: E-W
Direction: E-W