Races in Affton, Missouri (MO) Detailed Stats
Data:
Races - White alone (%)
Races - White alone (% change since 2000)
Races - Black alone (%)
Races - Black alone (% change since 2000)
Races - American Indian alone (%)
Races - American Indian alone (% change since 2000)
Races - Asian alone (%)
Races - Asian alone (% change since 2000)
Races - Hispanic (%)
Races - Hispanic (% change since 2000)
Races - Native Hawaiian and Other Pacific Islander alone (%)
Races - Native Hawaiian and Other Pacific Islander alone (% change since 2000)
Races - Two or more races(%)
Races - Two or more races(% change since 2000)
Races - Other race alone (%)
Races - Other race alone (% change since 2000)
Racial diversity
Place of birth - Born in state of residence (%)
Place of birth - Born in state of residence (%) - White
Place of birth - Born in state of residence (%) - Black or African American
Place of birth - Born in state of residence (%) - Asian
Place of birth - Born in state of residence (%) - Hispanic or Latino
Place of birth - Born in state of residence (%) - American Indian and Alaska Native
Place of birth - Born in state of residence (%) - Multirace
Place of birth - Born in state of residence (%) - Other Race
Place of birth - Born in other state (%)
Place of birth - Born in other state (%) - White
Place of birth - Born in other state (%) - Black or African American
Place of birth - Born in other state (%) - Asian
Place of birth - Born in other state (%) - Hispanic or Latino
Place of birth - Born in other state (%) - American Indian and Alaska Native
Place of birth - Born in other state (%) - Multirace
Place of birth - Born in other state (%) - Other Race
Place of birth - Native, outside of US (%)
Place of birth - Native, outside of US (%) - White
Place of birth - Native, outside of US (%) - Black or African American
Place of birth - Native, outside of US (%) - Asian
Place of birth - Native, outside of US (%) - Hispanic or Latino
Place of birth - Native, outside of US (%) - American Indian and Alaska Native
Place of birth - Native, outside of US (%) - Multirace
Place of birth - Native, outside of US (%) - Other Race
Place of birth - Foreign born (%)
Place of birth - Foreign born (%) - White
Place of birth - Foreign born (%) - Black or African American
Place of birth - Foreign born (%) - Asian
Place of birth - Foreign born (%) - Hispanic or Latino
Place of birth - Foreign born (%) - American Indian and Alaska Native
Place of birth - Foreign born (%) - Multirace
Place of birth - Foreign born (%) - Other Race
Residents speaking English at home (%)
Residents speaking English at home - Born in the United States (%)
Residents speaking English at home - Native, born elsewhere (%)
Residents speaking English at home - Foreign born (%)
Residents speaking Spanish at home (%)
Residents speaking Spanish at home - Born in the United States (%)
Residents speaking Spanish at home - Native, born elsewhere (%)
Residents speaking Spanish at home - Foreign born (%)
Residents speaking other language at home (%)
Residents speaking other language at home - Born in the United States (%)
Residents speaking other language at home - Native, born elsewhere (%)
Residents speaking other language at home - Foreign born (%)
Marital status - Never married (%)
Marital status - Now married (%)
Marital status - Separated (%)
Marital status - Widowed (%)
Marital status - Divorced (%)
Ancestries Reported - Arab (%)
Ancestries Reported - Czech (%)
Ancestries Reported - Danish (%)
Ancestries Reported - Dutch (%)
Ancestries Reported - English (%)
Ancestries Reported - French (%)
Ancestries Reported - French Canadian (%)
Ancestries Reported - German (%)
Ancestries Reported - Greek (%)
Ancestries Reported - Hungarian (%)
Ancestries Reported - Irish (%)
Ancestries Reported - Italian (%)
Ancestries Reported - Lithuanian (%)
Ancestries Reported - Norwegian (%)
Ancestries Reported - Polish (%)
Ancestries Reported - Portuguese (%)
Ancestries Reported - Russian (%)
Ancestries Reported - Scotch-Irish (%)
Ancestries Reported - Scottish (%)
Ancestries Reported - Slovak (%)
Ancestries Reported - Subsaharan African (%)
Ancestries Reported - Swedish (%)
Ancestries Reported - Swiss (%)
Ancestries Reported - Ukrainian (%)
Ancestries Reported - United States (%)
Ancestries Reported - Welsh (%)
Ancestries Reported - West Indian (%)
Ancestries Reported - Other (%)
Geographical mobility - Same house 1 year ago (%)
Geographical mobility - Same house 1 year ago (%) - White
Geographical mobility - Same house 1 year ago (%) - Black or African American
Geographical mobility - Same house 1 year ago (%) - Asian
Geographical mobility - Same house 1 year ago (%) - Hispanic or Latino
Geographical mobility - Same house 1 year ago (%) - American Indian and Alaska Native
Geographical mobility - Same house 1 year ago (%) - Multirace
Geographical mobility - Same house 1 year ago (%) - Other Race
Geographical mobility - Moved within same county (%)
Geographical mobility - Moved within same county (%) - White
Geographical mobility - Moved within same county (%) - Black or African American
Geographical mobility - Moved within same county (%) - Asian
Geographical mobility - Moved within same county (%) - Hispanic or Latino
Geographical mobility - Moved within same county (%) - American Indian and Alaska Native
Geographical mobility - Moved within same county (%) - Multirace
Geographical mobility - Moved within same county (%) - Other Race
Geographical mobility - Moved from different county within same state (%)
Geographical mobility - Moved from different county within same state (%) - White
Geographical mobility - Moved from different county within same state (%) - Black or African American
Geographical mobility - Moved from different county within same state (%) - Asian
Geographical mobility - Moved from different county within same state (%) - Hispanic or Latino
Geographical mobility - Moved from different county within same state (%) - American Indian and Alaska Native
Geographical mobility - Moved from different county within same state (%) - Multirace
Geographical mobility - Moved from different county within same state (%) - Other Race
Geographical mobility - Moved from different state (%)
Geographical mobility - Moved from different state (%) - White
Geographical mobility - Moved from different state (%) - Black or African American
Geographical mobility - Moved from different state (%) - Asian
Geographical mobility - Moved from different state (%) - Hispanic or Latino
Geographical mobility - Moved from different state (%) - American Indian and Alaska Native
Geographical mobility - Moved from different state (%) - Multirace
Geographical mobility - Moved from different state (%) - Other Race
Geographical mobility - Moved from abroad (%)
Geographical mobility - Moved from abroad (%) - White
Geographical mobility - Moved from abroad (%) - Black or African American
Geographical mobility - Moved from abroad (%) - Asian
Geographical mobility - Moved from abroad (%) - Hispanic or Latino
Geographical mobility - Moved from abroad (%) - American Indian and Alaska Native
Geographical mobility - Moved from abroad (%) - Multirace
Geographical mobility - Moved from abroad (%) - Other Race
Place of birth for the foreign-born population - Ireland (%)
Place of birth for the foreign-born population - Denmark (%)
Place of birth for the foreign-born population - Norway (%)
Place of birth for the foreign-born population - Sweden (%)
Place of birth for the foreign-born population - United Kingdom (%)
Place of birth for the foreign-born population - England (%)
Place of birth for the foreign-born population - Scotland (%)
Place of birth for the foreign-born population - Other Northern Europe (%)
Place of birth for the foreign-born population - Austria (%)
Place of birth for the foreign-born population - Belgium (%)
Place of birth for the foreign-born population - France (%)
Place of birth for the foreign-born population - Germany (%)
Place of birth for the foreign-born population - Netherlands (%)
Place of birth for the foreign-born population - Switzerland (%)
Place of birth for the foreign-born population - Other Western Europe (%)
Place of birth for the foreign-born population - Greece (%)
Place of birth for the foreign-born population - Italy (%)
Place of birth for the foreign-born population - Portugal (%)
Place of birth for the foreign-born population - Spain (%)
Place of birth for the foreign-born population - Other Southern Europe (%)
Place of birth for the foreign-born population - Albania (%)
Place of birth for the foreign-born population - Belarus (%)
Place of birth for the foreign-born population - Bosnia and Herzegovina (%)
Place of birth for the foreign-born population - Bulgaria (%)
Place of birth for the foreign-born population - Croatia (%)
Place of birth for the foreign-born population - Czechoslovakia (%)
Place of birth for the foreign-born population - Hungary (%)
Place of birth for the foreign-born population - Latvia (%)
Place of birth for the foreign-born population - Lithuania (%)
Place of birth for the foreign-born population - North Macedonia (Macedonia) (%)
Place of birth for the foreign-born population - Moldova (%)
Place of birth for the foreign-born population - Poland (%)
Place of birth for the foreign-born population - Romania (%)
Place of birth for the foreign-born population - Russia (%)
Place of birth for the foreign-born population - Serbia (%)
Place of birth for the foreign-born population - Ukraine (%)
Place of birth for the foreign-born population - Other Eastern Europe (%)
Place of birth for the foreign-born population - China (%)
Place of birth for the foreign-born population - Hong Kong (%)
Place of birth for the foreign-born population - Taiwan (%)
Place of birth for the foreign-born population - Japan (%)
Place of birth for the foreign-born population - Korea (%)
Place of birth for the foreign-born population - Other Eastern Asia (%)
Place of birth for the foreign-born population - Afghanistan (%)
Place of birth for the foreign-born population - Bangladesh (%)
Place of birth for the foreign-born population - India (%)
Place of birth for the foreign-born population - Iran (%)
Place of birth for the foreign-born population - Kazakhstan (%)
Place of birth for the foreign-born population - Nepal (%)
Place of birth for the foreign-born population - Pakistan (%)
Place of birth for the foreign-born population - Sri Lanka (%)
Place of birth for the foreign-born population - Uzbekistan (%)
Place of birth for the foreign-born population - Other South Central Asia (%)
Place of birth for the foreign-born population - Burma (%)
Place of birth for the foreign-born population - Cambodia (%)
Place of birth for the foreign-born population - Indonesia (%)
Place of birth for the foreign-born population - Laos (%)
Place of birth for the foreign-born population - Malaysia (%)
Place of birth for the foreign-born population - Philippines (%)
Place of birth for the foreign-born population - Singapore (%)
Place of birth for the foreign-born population - Thailand (%)
Place of birth for the foreign-born population - Vietnam (%)
Place of birth for the foreign-born population - Other South Eastern Asia (%)
Place of birth for the foreign-born population - Armenia (%)
Place of birth for the foreign-born population - Iraq (%)
Place of birth for the foreign-born population - Israel (%)
Place of birth for the foreign-born population - Jordan (%)
Place of birth for the foreign-born population - Kuwait (%)
Place of birth for the foreign-born population - Lebanon (%)
Place of birth for the foreign-born population - Saudi Arabia (%)
Place of birth for the foreign-born population - Syria (%)
Place of birth for the foreign-born population - Turkey (%)
Place of birth for the foreign-born population - Yemen (%)
Place of birth for the foreign-born population - Other Western Asia (%)
Place of birth for the foreign-born population - Eritrea (%)
Place of birth for the foreign-born population - Ethiopia (%)
Place of birth for the foreign-born population - Kenya (%)
Place of birth for the foreign-born population - Somalia (%)
Place of birth for the foreign-born population - Uganda (%)
Place of birth for the foreign-born population - Zimbabwe (%)
Place of birth for the foreign-born population - Other Eastern Africa (%)
Place of birth for the foreign-born population - Cameroon (%)
Place of birth for the foreign-born population - Congo (%)
Place of birth for the foreign-born population - Democratic Republic of Congo (Zaire) (%)
Place of birth for the foreign-born population - Other Middle Africa (%)
Place of birth for the foreign-born population - Egypt (%)
Place of birth for the foreign-born population - Morocco (%)
Place of birth for the foreign-born population - Sudan (%)
Place of birth for the foreign-born population - Other Northern Africa (%)
Place of birth for the foreign-born population - South Africa (%)
Place of birth for the foreign-born population - Other Southern Africa (%)
Place of birth for the foreign-born population - Cabo Verde (%)
Place of birth for the foreign-born population - Ghana (%)
Place of birth for the foreign-born population - Liberia (%)
Place of birth for the foreign-born population - Nigeria (%)
Place of birth for the foreign-born population - Senegal (%)
Place of birth for the foreign-born population - Sierra Leone (%)
Place of birth for the foreign-born population - Other Western Africa (%)
Place of birth for the foreign-born population - Australia (%)
Place of birth for the foreign-born population - New Zealand (%)
Place of birth for the foreign-born population - Fiji (%)
Place of birth for the foreign-born population - Micronesia (%)
Place of birth for the foreign-born population - Bahamas (%)
Place of birth for the foreign-born population - Barbados (%)
Place of birth for the foreign-born population - Cuba (%)
Place of birth for the foreign-born population - Dominica (%)
Place of birth for the foreign-born population - Dominican Republic (%)
Place of birth for the foreign-born population - Grenada (%)
Place of birth for the foreign-born population - Haiti (%)
Place of birth for the foreign-born population - Jamaica (%)
Place of birth for the foreign-born population - St. Vincent and the Grenadines (%)
Place of birth for the foreign-born population - Trinidad and Tobago (%)
Place of birth for the foreign-born population - West Indies (%)
Place of birth for the foreign-born population - Other Caribbean (%)
Place of birth for the foreign-born population - Belize (%)
Place of birth for the foreign-born population - Costa Rica (%)
Place of birth for the foreign-born population - El Salvador (%)
Place of birth for the foreign-born population - Guatemala (%)
Place of birth for the foreign-born population - Honduras (%)
Place of birth for the foreign-born population - Mexico (%)
Place of birth for the foreign-born population - Nicaragua (%)
Place of birth for the foreign-born population - Panama (%)
Place of birth for the foreign-born population - Other Central America (%)
Place of birth for the foreign-born population - Argentina (%)
Place of birth for the foreign-born population - Bolivia (%)
Place of birth for the foreign-born population - Brazil (%)
Place of birth for the foreign-born population - Chile (%)
Place of birth for the foreign-born population - Colombia (%)
Place of birth for the foreign-born population - Ecuador (%)
Place of birth for the foreign-born population - Guyana (%)
Place of birth for the foreign-born population - Peru (%)
Place of birth for the foreign-born population - Uruguay (%)
Place of birth for the foreign-born population - Venezuela (%)
Place of birth for the foreign-born population - Other South America (%)
Place of birth for the foreign-born population - Canada (%)
Place of birth for the foreign-born population - Other Northern America (%)
Place of birth for the foreign-born population - Other (%)
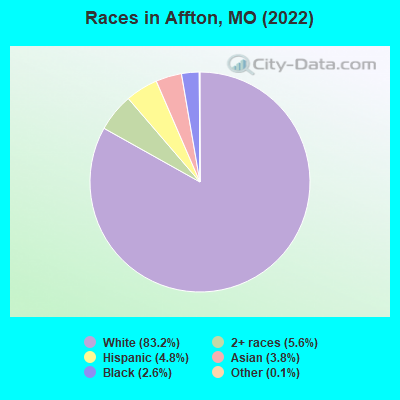
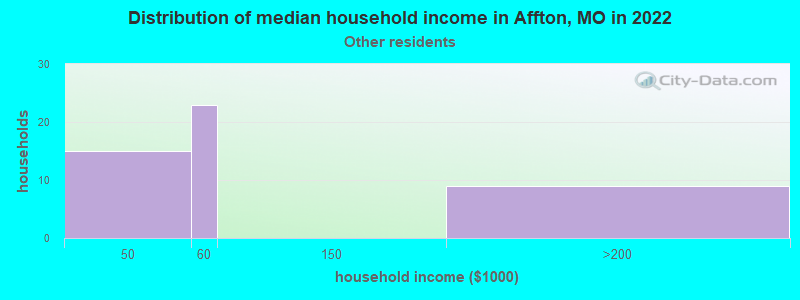
According to 2022 data, the most numerous races in Affton, MO are White alone (16,422 residents), Black alone (507 residents), and Two or more races (1,113 residents). 84.8% of Affton residents speak English at home. 11.7% of Affton, MO residents are foreign-born (5.8% born in Europe, 4.2% born in Asia, 1.7% born in Latin America), which is 65.9% greater than the foreign-born rate of 4.0% across the entire state of Missouri.
Race distribution in Affton
2000 2022
4,686,474 83.8% White alone 625,667 11.2% Black alone 118,592 2.1% Hispanic 71,905 1.3% Two or more races 61,041 1.1% Asian alone 23,302 0.4% American Indian alone 5,291 0.09% Other race alone 2,939 0.05% Native Hawaiian and Other
4,733,411 76.6% White alone 656,739 10.6% Black alone 316,300 5.1% Two or more races 291,763 4.7% Hispanic 132,436 2.1% Asian alone 27,467 0.4% Other race alone 12,313 0.2% American Indian alone 7,528 0.1% Native Hawaiian and Other
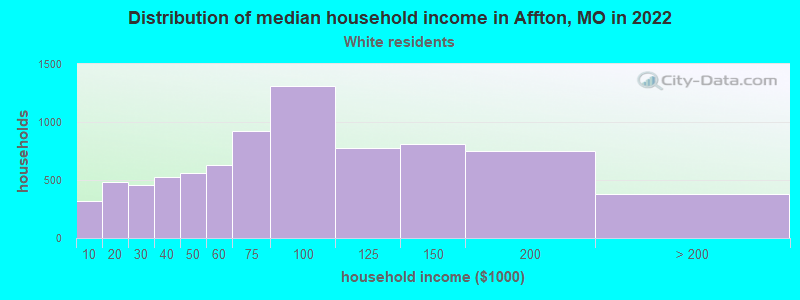
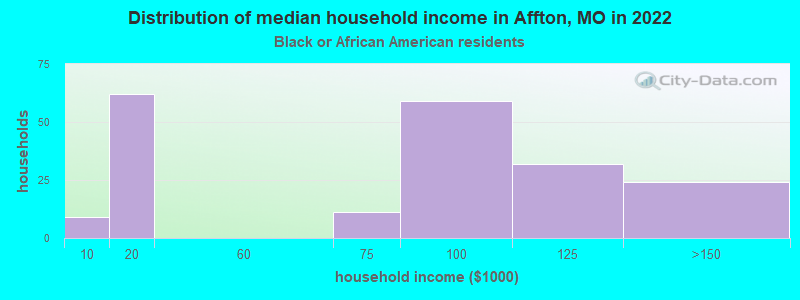
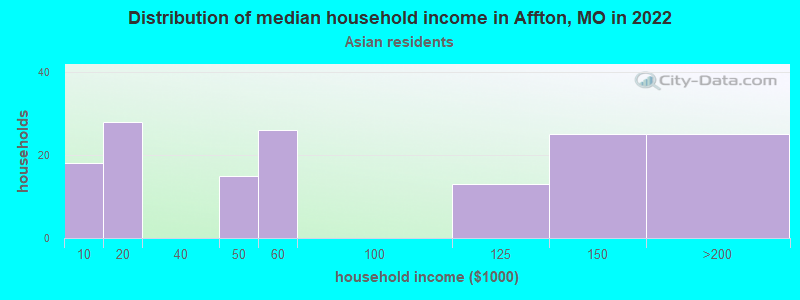
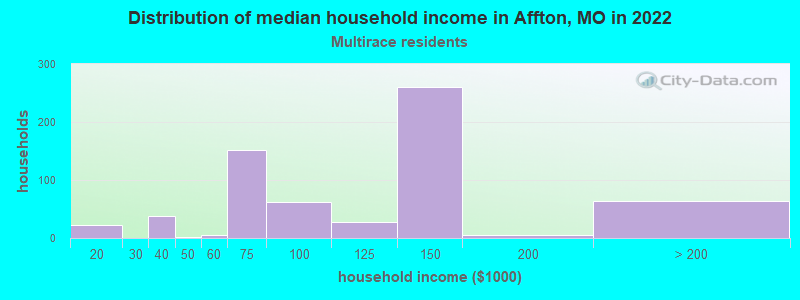
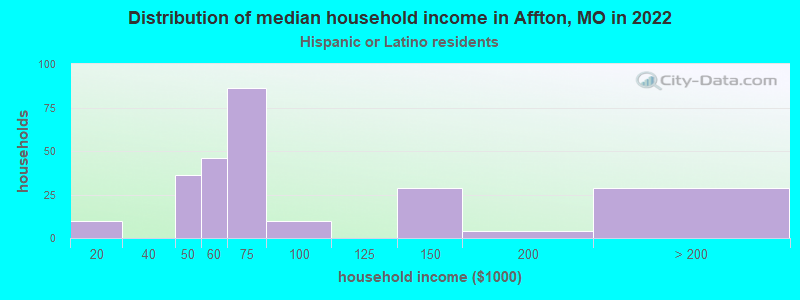
Income and house value in Affton Median household income in 2022 $76,080 White non-Hispanic householders$94,689 Black householders$58,373 Some other race householders$126,319 Two or more races householders$61,433 Hispanic or Latino race householdersMedian 2022 house value $196,476 White Non-Hispanic householders$172,170 Black or African American householders$455,744 American Indian or Alaska Native householders $222,605 Asian householders$116,467 Two or more races householders$179,867 Hispanic or Latino householders
Median age by race in Affton
44.4 Median age for White residents43.0 46.0 38.3 Median age for Black or African American residents36.5 40.4 -520,187,792.9 Median age for American Indian / Alaska Native residents-644,003,776.5 -505,494,505.0 25.7 Median age for Asian residents23.2 30.6 -710,303,029.6 Median age for Native Hawaiian / Pacific Islander residents-1,449,781,657.9 -752,136,751.4 39.8 Median age for Other race residents39.6 34.0 33.2 Median age for Two or more races residents44.6 16.1 44.4 Median age for White alone residents43.0 47.3 24.9 Median age for Hispanic or Latino residents21.6 32.8
Owner/renter occupied households by race in Affton
House owners and renters - White residents 6,236 79.1% Owner occupied1,645 20.9% Renter occupiedHouse owners and renters - Black or African American residents 66 34.8% Owner occupied124 65.2% Renter occupiedHouse owners and renters - Asian residents 114 70.0% Owner occupied49 30.0% Renter occupiedHouse owners and renters - Other race residents 35 70.7% Owner occupied15 29.3% Renter occupiedHouse owners and renters - Two or more races residents 401 67.0% Owner occupied198 33.0% Renter occupiedHouse owners and renters - White alone residents 6,188 79.0% Owner occupied1,645 21.0% Renter occupiedHouse owners and renters - Hispanic or Latino residents 148 63.4% Owner occupied86 36.6% Renter occupied
Language usage in Affton
English speakers - Total 84.8% of residents of Affton speak English at home.
3.8% of residents speak Spanish at home 545 77.0% Speak English very well163 23.0% Speak English less than very well11.4% of residents speak other language at home 998 46.6% Speak English very well1,145 53.4% Speak English less than very well
English speakers - Born in the United States 98.0% of residents of Affton speak English at home.
0.7% of residents speak Spanish at home 22 100.0% Speak English very well1.2% of residents speak other language at home 36 100.0% Speak English very well
English speakers - Native, born elsewhere 27.6% of residents of Affton speak English at home.
23.6% of residents speak Spanish at home 100 85.5% Speak English very well17 14.5% Speak English less than very well64.5% of residents speak other language at home 182 56.9% Speak English very well138 43.1% Speak English less than very well
English speakers - Foreign-born 20.2% of residents of Affton speak English at home.
16.0% of residents speak Spanish at home 206 56.3% Speak English very well160 43.7% Speak English less than very well64.3% of residents speak other language at home 490 33.4% Speak English very well979 66.6% Speak English less than very well
White (Caucasian) - Speak only English Native:
94.8% (13,828)Foreign-born:
15.9% (209)
White (Caucasian) - Speak another language Native:
5.1% (746)Foreign-born:
85.4% (1,117)
Black or African American - Speak another language Native:
7.3% (39)Foreign-born:
91.6% (11)
Asian - Speak only English Native:
75.2% (45)Foreign-born:
34.6% (206)
Asian - Speak another language Native:
29.8% (18)Foreign-born:
70.5% (420)
Other race - Speak another language Native:
48.1% (85)Foreign-born:
90.6% (81)
Two or more races - Speak only English Native:
96.5% (1,050)Foreign-born:
3.5% (6)
Two or more races - Speak another language Native:
2.6% (29)Foreign-born:
100.0% (183)
White alone - Speak only English Native:
95.3% (13,735)Foreign-born:
17.3% (214)
White alone - Speak another language Native:
4.7% (677)Foreign-born:
84.0% (1,037)
Hispanic or Latino - Speak only English Native:
55.6% (310)Foreign-born:
1.8% (7)
Hispanic or Latino - Speak another language Native:
41.3% (231)Foreign-born:
99.3% (362)
Foreign-born residents in Affton 2,317 residents are foreign born (5.8% Europe , 4.2% Asia , 1.7% Latin America ).
This city:
11.7%Missouri:
4.2%
Marital status for residents in Affton Marital status - White (Caucasian) population 15 years and over
Males 34.1% Never married48.4% Now married0.5% Separated4.8% Widowed12.2% DivorcedFemales 28.2% Never married45.5% Now married1.0% Separated9.5% Widowed15.8% DivorcedWomen who gave birth in the past 12 months Now married:
91.3% (131)Unmarried:
8.7% (12)
Women who did not give birth in the past 12 months Now married:
44.0% (1,490)Unmarried:
56.0% (1,897)
Marital status - Black or African American population 15 years and over
Males 45.6% Never married29.2% Now married0.0% Separated4.9% Widowed20.4% DivorcedFemales 49.7% Never married17.4% Now married0.0% Separated12.8% Widowed20.1% DivorcedWomen who did not give birth in the past 12 months Now married:
10.6% (9)Unmarried:
89.4% (79)
Marital status - Asian population 15 years and over
Males 29.3% Never married70.7% Now married0.0% Separated0.0% Widowed0.0% DivorcedFemales 35.3% Never married58.5% Now married3.5% Separated0.0% Widowed2.6% DivorcedWomen who gave birth in the past 12 months Now married:
100.0% (52)Unmarried:
0.0% (0)
Women who did not give birth in the past 12 months Now married:
51.9% (147)Unmarried:
48.1% (137)
Marital status - Other race population 15 years and over
Males 21.8% Never married46.8% Now married0.0% Separated0.0% Widowed31.5% DivorcedFemales 39.4% Never married60.6% Now married0.0% Separated0.0% Widowed0.0% DivorcedWomen who did not give birth in the past 12 months Now married:
50.9% (29)Unmarried:
49.1% (28)
Marital status - Two or more races population 15 years and over
Males 21.1% Never married69.5% Now married0.0% Separated0.0% Widowed9.4% DivorcedFemales 35.4% Never married55.4% Now married0.0% Separated7.1% Widowed2.2% DivorcedWomen who gave birth in the past 12 months Now married:
67.3% (43)Unmarried:
32.7% (21)
Women who did not give birth in the past 12 months Now married:
48.4% (122)Unmarried:
51.6% (130)
Marital status - White alone, not Hispanic / Latino population 15 years and over
Males 34.4% Never married48.1% Now married0.5% Separated4.9% Widowed12.2% DivorcedFemales 28.3% Never married45.0% Now married1.0% Separated9.7% Widowed16.1% DivorcedWomen who gave birth in the past 12 months Now married:
91.3% (132)Unmarried:
8.7% (13)
Women who did not give birth in the past 12 months Now married:
43.0% (1,416)Unmarried:
57.0% (1,876)
Marital status - Hispanic or Latino population 15 years and over
Males 21.6% Never married59.9% Now married0.0% Separated0.0% Widowed18.5% DivorcedFemales 21.3% Never married72.3% Now married0.0% Separated4.4% Widowed2.0% DivorcedWomen who gave birth in the past 12 months Now married:
100.0% (30)Unmarried:
0.0% (0)
Women who did not give birth in the past 12 months Now married:
71.4% (169)Unmarried:
28.6% (68)
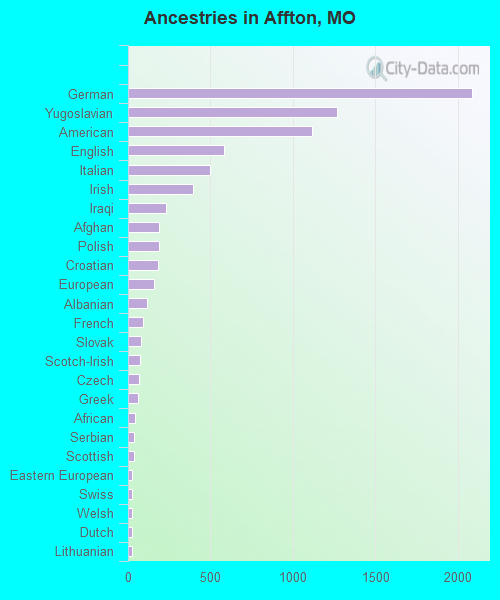
Ancestries in Affton
2,084 21.8% German1,267 13.2% Yugoslavian1,116 11.7% American584 6.1% English496 5.2% Italian392 4.1% Irish228 2.4% Iraqi190 2.0% Afghan188 2.0% Polish179 1.9% Croatian157 1.6% European116 1.2% Albanian88 0.9% French81 0.8% Slovak74 0.8% Scotch-Irish68 0.7% Czech63 0.7% Greek41 0.4% African38 0.4% Serbian34 0.4% Scottish25 0.3% Eastern European24 0.3% Swiss24 0.3% Welsh23 0.2% Dutch22 0.2% Lithuanian18 0.2% Austrian18 0.2% Norwegian16 0.2% Canadian15 0.2% Czechoslovakian12 0.1% French Canadian12 0.1% Russian11 0.1% Ukrainian10 0.1% Slavic8 0.08% Northern European6 0.06% British
Children Nativity (place of birth) in Affton
Children under 6 years - Living with two parents Both parents native 530 100.0% NativeBoth parents foreign-born 91 90.6% Native9 9.4% Foreign-bornOne native, one foreign-born parent 185 75.7% Native59 24.3% Foreign-bornChildren under 6 years - Living with one parent Native parent 165 100.0% NativeForeign-born parent 62 100.0% NativeChildren 6 to 17 years - Living with two parents Both parents native 929 100.0% NativeBoth parents foreign-born 176 54.9% Native145 45.1% Foreign-bornOne native, one foreign-born parent 228 58.5% Native162 41.5% Foreign-bornChildren 6 to 17 years - Living with one parent Native parent 630 100.0% NativeForeign-born parent 93 51.4% Native88 48.6% Foreign-born
Grandparents responsible for own grandchildren in Affton
Grandparents (30 to 59 years) White / Caucasian 61 100.0% Not responsible for grandchildrenWhite alone, not Hispanic / Latino 61 100.0% Not responsible for grandchildrenGrandparents (60 years and over) White / Caucasian 106 29.2% Responsible for grandchildren256 70.8% Not responsible for grandchildrenWhite alone, not Hispanic / Latino 106 33.5% Responsible for grandchildren210 66.5% Not responsible for grandchildren