Races in Baldwin, New York (NY) Detailed Stats
Data:
Races - White alone (%)
Races - White alone (% change since 2000)
Races - Black alone (%)
Races - Black alone (% change since 2000)
Races - American Indian alone (%)
Races - American Indian alone (% change since 2000)
Races - Asian alone (%)
Races - Asian alone (% change since 2000)
Races - Hispanic (%)
Races - Hispanic (% change since 2000)
Races - Native Hawaiian and Other Pacific Islander alone (%)
Races - Native Hawaiian and Other Pacific Islander alone (% change since 2000)
Races - Two or more races(%)
Races - Two or more races(% change since 2000)
Races - Other race alone (%)
Races - Other race alone (% change since 2000)
Racial diversity
Place of birth - Born in state of residence (%)
Place of birth - Born in state of residence (%) - White
Place of birth - Born in state of residence (%) - Black or African American
Place of birth - Born in state of residence (%) - Asian
Place of birth - Born in state of residence (%) - Hispanic or Latino
Place of birth - Born in state of residence (%) - American Indian and Alaska Native
Place of birth - Born in state of residence (%) - Multirace
Place of birth - Born in state of residence (%) - Other Race
Place of birth - Born in other state (%)
Place of birth - Born in other state (%) - White
Place of birth - Born in other state (%) - Black or African American
Place of birth - Born in other state (%) - Asian
Place of birth - Born in other state (%) - Hispanic or Latino
Place of birth - Born in other state (%) - American Indian and Alaska Native
Place of birth - Born in other state (%) - Multirace
Place of birth - Born in other state (%) - Other Race
Place of birth - Native, outside of US (%)
Place of birth - Native, outside of US (%) - White
Place of birth - Native, outside of US (%) - Black or African American
Place of birth - Native, outside of US (%) - Asian
Place of birth - Native, outside of US (%) - Hispanic or Latino
Place of birth - Native, outside of US (%) - American Indian and Alaska Native
Place of birth - Native, outside of US (%) - Multirace
Place of birth - Native, outside of US (%) - Other Race
Place of birth - Foreign born (%)
Place of birth - Foreign born (%) - White
Place of birth - Foreign born (%) - Black or African American
Place of birth - Foreign born (%) - Asian
Place of birth - Foreign born (%) - Hispanic or Latino
Place of birth - Foreign born (%) - American Indian and Alaska Native
Place of birth - Foreign born (%) - Multirace
Place of birth - Foreign born (%) - Other Race
Residents speaking English at home (%)
Residents speaking English at home - Born in the United States (%)
Residents speaking English at home - Native, born elsewhere (%)
Residents speaking English at home - Foreign born (%)
Residents speaking Spanish at home (%)
Residents speaking Spanish at home - Born in the United States (%)
Residents speaking Spanish at home - Native, born elsewhere (%)
Residents speaking Spanish at home - Foreign born (%)
Residents speaking other language at home (%)
Residents speaking other language at home - Born in the United States (%)
Residents speaking other language at home - Native, born elsewhere (%)
Residents speaking other language at home - Foreign born (%)
Marital status - Never married (%)
Marital status - Now married (%)
Marital status - Separated (%)
Marital status - Widowed (%)
Marital status - Divorced (%)
Ancestries Reported - Arab (%)
Ancestries Reported - Czech (%)
Ancestries Reported - Danish (%)
Ancestries Reported - Dutch (%)
Ancestries Reported - English (%)
Ancestries Reported - French (%)
Ancestries Reported - French Canadian (%)
Ancestries Reported - German (%)
Ancestries Reported - Greek (%)
Ancestries Reported - Hungarian (%)
Ancestries Reported - Irish (%)
Ancestries Reported - Italian (%)
Ancestries Reported - Lithuanian (%)
Ancestries Reported - Norwegian (%)
Ancestries Reported - Polish (%)
Ancestries Reported - Portuguese (%)
Ancestries Reported - Russian (%)
Ancestries Reported - Scotch-Irish (%)
Ancestries Reported - Scottish (%)
Ancestries Reported - Slovak (%)
Ancestries Reported - Subsaharan African (%)
Ancestries Reported - Swedish (%)
Ancestries Reported - Swiss (%)
Ancestries Reported - Ukrainian (%)
Ancestries Reported - United States (%)
Ancestries Reported - Welsh (%)
Ancestries Reported - West Indian (%)
Ancestries Reported - Other (%)
Geographical mobility - Same house 1 year ago (%)
Geographical mobility - Same house 1 year ago (%) - White
Geographical mobility - Same house 1 year ago (%) - Black or African American
Geographical mobility - Same house 1 year ago (%) - Asian
Geographical mobility - Same house 1 year ago (%) - Hispanic or Latino
Geographical mobility - Same house 1 year ago (%) - American Indian and Alaska Native
Geographical mobility - Same house 1 year ago (%) - Multirace
Geographical mobility - Same house 1 year ago (%) - Other Race
Geographical mobility - Moved within same county (%)
Geographical mobility - Moved within same county (%) - White
Geographical mobility - Moved within same county (%) - Black or African American
Geographical mobility - Moved within same county (%) - Asian
Geographical mobility - Moved within same county (%) - Hispanic or Latino
Geographical mobility - Moved within same county (%) - American Indian and Alaska Native
Geographical mobility - Moved within same county (%) - Multirace
Geographical mobility - Moved within same county (%) - Other Race
Geographical mobility - Moved from different county within same state (%)
Geographical mobility - Moved from different county within same state (%) - White
Geographical mobility - Moved from different county within same state (%) - Black or African American
Geographical mobility - Moved from different county within same state (%) - Asian
Geographical mobility - Moved from different county within same state (%) - Hispanic or Latino
Geographical mobility - Moved from different county within same state (%) - American Indian and Alaska Native
Geographical mobility - Moved from different county within same state (%) - Multirace
Geographical mobility - Moved from different county within same state (%) - Other Race
Geographical mobility - Moved from different state (%)
Geographical mobility - Moved from different state (%) - White
Geographical mobility - Moved from different state (%) - Black or African American
Geographical mobility - Moved from different state (%) - Asian
Geographical mobility - Moved from different state (%) - Hispanic or Latino
Geographical mobility - Moved from different state (%) - American Indian and Alaska Native
Geographical mobility - Moved from different state (%) - Multirace
Geographical mobility - Moved from different state (%) - Other Race
Geographical mobility - Moved from abroad (%)
Geographical mobility - Moved from abroad (%) - White
Geographical mobility - Moved from abroad (%) - Black or African American
Geographical mobility - Moved from abroad (%) - Asian
Geographical mobility - Moved from abroad (%) - Hispanic or Latino
Geographical mobility - Moved from abroad (%) - American Indian and Alaska Native
Geographical mobility - Moved from abroad (%) - Multirace
Geographical mobility - Moved from abroad (%) - Other Race
Place of birth for the foreign-born population - Ireland (%)
Place of birth for the foreign-born population - Denmark (%)
Place of birth for the foreign-born population - Norway (%)
Place of birth for the foreign-born population - Sweden (%)
Place of birth for the foreign-born population - United Kingdom (%)
Place of birth for the foreign-born population - England (%)
Place of birth for the foreign-born population - Scotland (%)
Place of birth for the foreign-born population - Other Northern Europe (%)
Place of birth for the foreign-born population - Austria (%)
Place of birth for the foreign-born population - Belgium (%)
Place of birth for the foreign-born population - France (%)
Place of birth for the foreign-born population - Germany (%)
Place of birth for the foreign-born population - Netherlands (%)
Place of birth for the foreign-born population - Switzerland (%)
Place of birth for the foreign-born population - Other Western Europe (%)
Place of birth for the foreign-born population - Greece (%)
Place of birth for the foreign-born population - Italy (%)
Place of birth for the foreign-born population - Portugal (%)
Place of birth for the foreign-born population - Spain (%)
Place of birth for the foreign-born population - Other Southern Europe (%)
Place of birth for the foreign-born population - Albania (%)
Place of birth for the foreign-born population - Belarus (%)
Place of birth for the foreign-born population - Bosnia and Herzegovina (%)
Place of birth for the foreign-born population - Bulgaria (%)
Place of birth for the foreign-born population - Croatia (%)
Place of birth for the foreign-born population - Czechoslovakia (%)
Place of birth for the foreign-born population - Hungary (%)
Place of birth for the foreign-born population - Latvia (%)
Place of birth for the foreign-born population - Lithuania (%)
Place of birth for the foreign-born population - North Macedonia (Macedonia) (%)
Place of birth for the foreign-born population - Moldova (%)
Place of birth for the foreign-born population - Poland (%)
Place of birth for the foreign-born population - Romania (%)
Place of birth for the foreign-born population - Russia (%)
Place of birth for the foreign-born population - Serbia (%)
Place of birth for the foreign-born population - Ukraine (%)
Place of birth for the foreign-born population - Other Eastern Europe (%)
Place of birth for the foreign-born population - China (%)
Place of birth for the foreign-born population - Hong Kong (%)
Place of birth for the foreign-born population - Taiwan (%)
Place of birth for the foreign-born population - Japan (%)
Place of birth for the foreign-born population - Korea (%)
Place of birth for the foreign-born population - Other Eastern Asia (%)
Place of birth for the foreign-born population - Afghanistan (%)
Place of birth for the foreign-born population - Bangladesh (%)
Place of birth for the foreign-born population - India (%)
Place of birth for the foreign-born population - Iran (%)
Place of birth for the foreign-born population - Kazakhstan (%)
Place of birth for the foreign-born population - Nepal (%)
Place of birth for the foreign-born population - Pakistan (%)
Place of birth for the foreign-born population - Sri Lanka (%)
Place of birth for the foreign-born population - Uzbekistan (%)
Place of birth for the foreign-born population - Other South Central Asia (%)
Place of birth for the foreign-born population - Burma (%)
Place of birth for the foreign-born population - Cambodia (%)
Place of birth for the foreign-born population - Indonesia (%)
Place of birth for the foreign-born population - Laos (%)
Place of birth for the foreign-born population - Malaysia (%)
Place of birth for the foreign-born population - Philippines (%)
Place of birth for the foreign-born population - Singapore (%)
Place of birth for the foreign-born population - Thailand (%)
Place of birth for the foreign-born population - Vietnam (%)
Place of birth for the foreign-born population - Other South Eastern Asia (%)
Place of birth for the foreign-born population - Armenia (%)
Place of birth for the foreign-born population - Iraq (%)
Place of birth for the foreign-born population - Israel (%)
Place of birth for the foreign-born population - Jordan (%)
Place of birth for the foreign-born population - Kuwait (%)
Place of birth for the foreign-born population - Lebanon (%)
Place of birth for the foreign-born population - Saudi Arabia (%)
Place of birth for the foreign-born population - Syria (%)
Place of birth for the foreign-born population - Turkey (%)
Place of birth for the foreign-born population - Yemen (%)
Place of birth for the foreign-born population - Other Western Asia (%)
Place of birth for the foreign-born population - Eritrea (%)
Place of birth for the foreign-born population - Ethiopia (%)
Place of birth for the foreign-born population - Kenya (%)
Place of birth for the foreign-born population - Somalia (%)
Place of birth for the foreign-born population - Uganda (%)
Place of birth for the foreign-born population - Zimbabwe (%)
Place of birth for the foreign-born population - Other Eastern Africa (%)
Place of birth for the foreign-born population - Cameroon (%)
Place of birth for the foreign-born population - Congo (%)
Place of birth for the foreign-born population - Democratic Republic of Congo (Zaire) (%)
Place of birth for the foreign-born population - Other Middle Africa (%)
Place of birth for the foreign-born population - Egypt (%)
Place of birth for the foreign-born population - Morocco (%)
Place of birth for the foreign-born population - Sudan (%)
Place of birth for the foreign-born population - Other Northern Africa (%)
Place of birth for the foreign-born population - South Africa (%)
Place of birth for the foreign-born population - Other Southern Africa (%)
Place of birth for the foreign-born population - Cabo Verde (%)
Place of birth for the foreign-born population - Ghana (%)
Place of birth for the foreign-born population - Liberia (%)
Place of birth for the foreign-born population - Nigeria (%)
Place of birth for the foreign-born population - Senegal (%)
Place of birth for the foreign-born population - Sierra Leone (%)
Place of birth for the foreign-born population - Other Western Africa (%)
Place of birth for the foreign-born population - Australia (%)
Place of birth for the foreign-born population - New Zealand (%)
Place of birth for the foreign-born population - Fiji (%)
Place of birth for the foreign-born population - Micronesia (%)
Place of birth for the foreign-born population - Bahamas (%)
Place of birth for the foreign-born population - Barbados (%)
Place of birth for the foreign-born population - Cuba (%)
Place of birth for the foreign-born population - Dominica (%)
Place of birth for the foreign-born population - Dominican Republic (%)
Place of birth for the foreign-born population - Grenada (%)
Place of birth for the foreign-born population - Haiti (%)
Place of birth for the foreign-born population - Jamaica (%)
Place of birth for the foreign-born population - St. Vincent and the Grenadines (%)
Place of birth for the foreign-born population - Trinidad and Tobago (%)
Place of birth for the foreign-born population - West Indies (%)
Place of birth for the foreign-born population - Other Caribbean (%)
Place of birth for the foreign-born population - Belize (%)
Place of birth for the foreign-born population - Costa Rica (%)
Place of birth for the foreign-born population - El Salvador (%)
Place of birth for the foreign-born population - Guatemala (%)
Place of birth for the foreign-born population - Honduras (%)
Place of birth for the foreign-born population - Mexico (%)
Place of birth for the foreign-born population - Nicaragua (%)
Place of birth for the foreign-born population - Panama (%)
Place of birth for the foreign-born population - Other Central America (%)
Place of birth for the foreign-born population - Argentina (%)
Place of birth for the foreign-born population - Bolivia (%)
Place of birth for the foreign-born population - Brazil (%)
Place of birth for the foreign-born population - Chile (%)
Place of birth for the foreign-born population - Colombia (%)
Place of birth for the foreign-born population - Ecuador (%)
Place of birth for the foreign-born population - Guyana (%)
Place of birth for the foreign-born population - Peru (%)
Place of birth for the foreign-born population - Uruguay (%)
Place of birth for the foreign-born population - Venezuela (%)
Place of birth for the foreign-born population - Other South America (%)
Place of birth for the foreign-born population - Canada (%)
Place of birth for the foreign-born population - Other Northern America (%)
Place of birth for the foreign-born population - Other (%)
Latest news about races in Baldwin, NY collected exclusively by city-data.com from local newspapers, TV, and radio stations
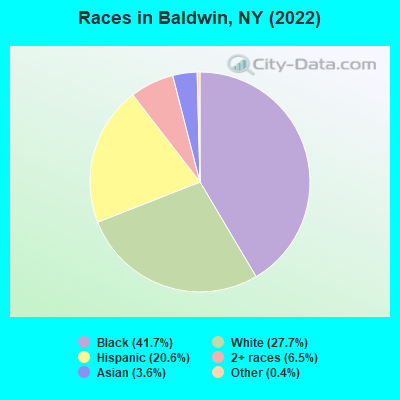
According to 2022 data, the most numerous races in Baldwin, NY are White alone (9,321 residents), Hispanic (6,919 residents), and Black alone (14,014 residents). 73.1% of Baldwin residents speak English at home. 25.7% of Baldwin, NY residents are foreign-born (20.9% born in Latin America), which is 14.3% greater than the foreign-born rate of 22.0% across the entire state of New York.
Race distribution in Baldwin
2000 2022
11,760,981 62.0% White alone 2,867,583 15.1% Hispanic 2,812,623 14.8% Black alone 1,035,926 5.5% Asian alone 366,116 1.9% Two or more races 75,499 0.4% Other race alone 52,499 0.3% American Indian alone 5,230 0.03% Native Hawaiian and Other
10,408,933 52.9% White alone 3,867,299 19.7% Hispanic 2,633,840 13.4% Black alone 1,776,286 9.0% Asian alone 732,670 3.7% Two or more races 216,110 1.1% Other race alone 35,082 0.2% American Indian alone 6,931 0.04% Native Hawaiian and Other
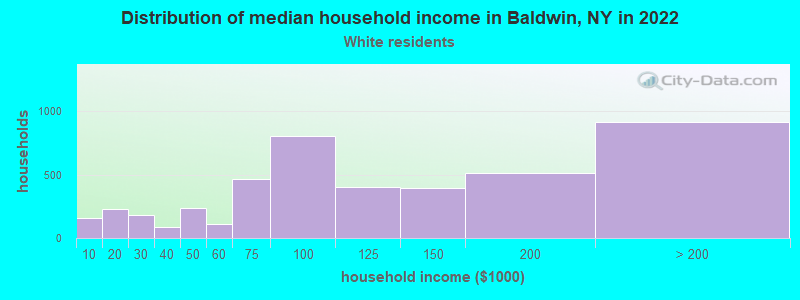
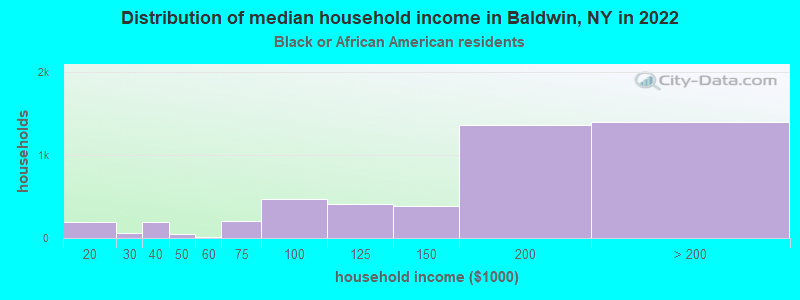
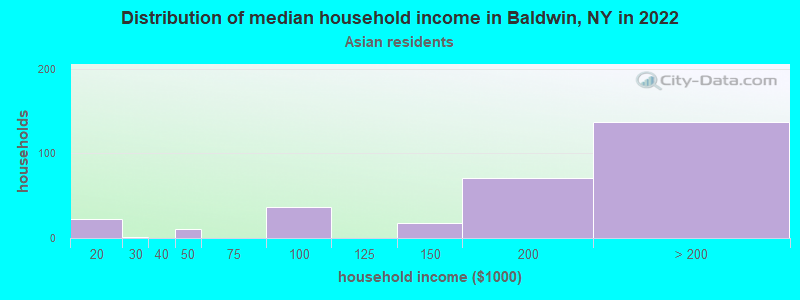
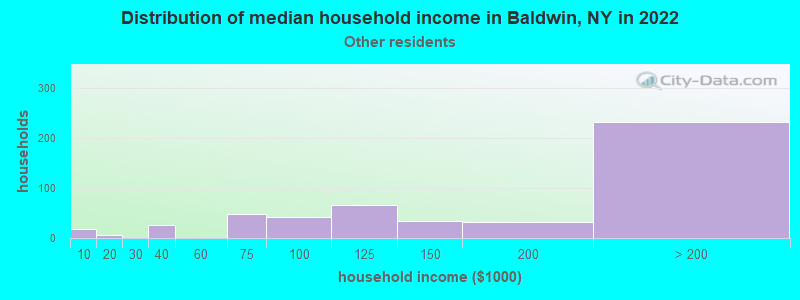
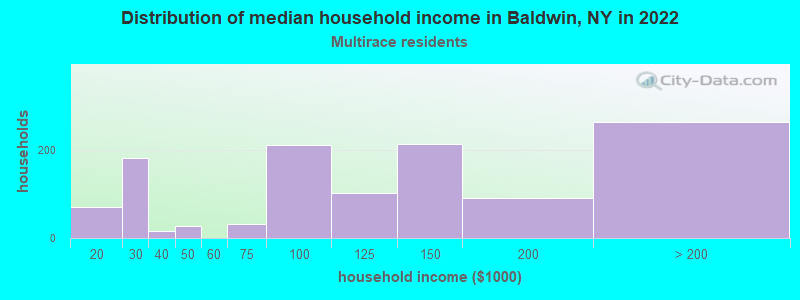
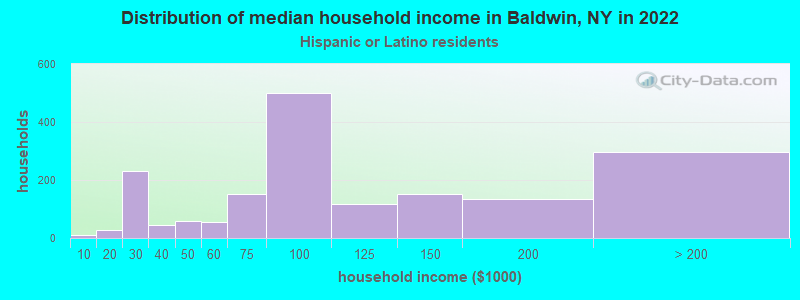
Income and house value in Baldwin Median household income in 2022 $114,019 White non-Hispanic householders$178,339 Black householders$190,782 Asian householders$124,851 Two or more races householders$94,112 Hispanic or Latino race householdersMedian 2022 house value $528,919 White Non-Hispanic householders$559,641 Black or African American householders$761,134 American Indian or Alaska Native householders $559,918 Asian householders$528,365 Some other race householders$570,989 Two or more races householders$567,114 Hispanic or Latino householders
Median age by race in Baldwin
48.5 Median age for White residents46.4 50.8 42.2 Median age for Black or African American residents38.5 45.8 -855,158,729.3 Median age for American Indian / Alaska Native residents-607,543,322.5 -837,121,211.3 50.0 Median age for Asian residents40.8 52.9 -487,992,314.6 Median age for Native Hawaiian / Pacific Islander residents-477,502,295.2 -497,387,669.3 38.2 Median age for Other race residents43.0 28.7 25.3 Median age for Two or more races residents24.9 26.0 53.0 Median age for White alone residents50.6 55.7 34.1 Median age for Hispanic or Latino residents27.2 36.4
Owner/renter occupied households by race in Baldwin
House owners and renters - White residents 3,862 87.1% Owner occupied571 12.9% Renter occupiedHouse owners and renters - Black or African American residents 4,226 91.7% Owner occupied381 8.3% Renter occupiedHouse owners and renters - American Indian / Alaska Native residents 16 100.0% Owner occupiedHouse owners and renters - Asian residents 300 100.0% Owner occupiedHouse owners and renters - Other race residents 474 88.9% Owner occupied59 11.1% Renter occupiedHouse owners and renters - Two or more races residents 864 73.1% Owner occupied318 26.9% Renter occupiedHouse owners and renters - White alone residents 3,355 85.8% Owner occupied554 14.2% Renter occupiedHouse owners and renters - Hispanic or Latino residents 1,386 80.7% Owner occupied332 19.3% Renter occupied
Language usage in Baldwin
English speakers - Total 73.1% of residents of Baldwin speak English at home.
13.9% of residents speak Spanish at home 2,440 54.6% Speak English very well2,026 45.4% Speak English less than very well12.7% of residents speak other language at home 3,173 77.6% Speak English very well914 22.4% Speak English less than very well
English speakers - Born in the United States 94.1% of residents of Baldwin speak English at home.
3.0% of residents speak Spanish at home 72 100.0% Speak English very well2.3% of residents speak other language at home 55 100.0% Speak English very well
English speakers - Native, born elsewhere 63.2% of residents of Baldwin speak English at home.
22.1% of residents speak Spanish at home 267 95.7% Speak English very well12 4.3% Speak English less than very well12.4% of residents speak other language at home 133 84.7% Speak English very well24 15.3% Speak English less than very well
English speakers - Foreign-born 39.1% of residents of Baldwin speak English at home.
27.3% of residents speak Spanish at home 847 35.0% Speak English very well1,573 65.0% Speak English less than very well31.3% of residents speak other language at home 1,987 71.6% Speak English very well790 28.4% Speak English less than very well
White (Caucasian) - Speak only English Native:
90.3% (8,644)Foreign-born:
19.5% (254)
White (Caucasian) - Speak another language Native:
8.9% (855)Foreign-born:
78.3% (1,021)
Black or African American - Speak only English Native:
89.6% (8,755)Foreign-born:
61.9% (2,568)
Black or African American - Speak another language Native:
10.4% (1,012)Foreign-born:
38.0% (1,575)
Asian - Speak only English Native:
58.4% (211)Foreign-born:
28.8% (244)
Asian - Speak another language Native:
42.2% (152)Foreign-born:
66.9% (568)
Other race - Speak only English Native:
39.3% (474)Foreign-born:
4.8% (34)
Other race - Speak another language Native:
60.6% (731)Foreign-born:
95.9% (671)
Two or more races - Speak only English Native:
75.1% (2,486)Foreign-born:
25.4% (442)
Two or more races - Speak another language Native:
22.6% (749)Foreign-born:
73.4% (1,275)
White alone - Speak only English Native:
97.4% (8,263)Foreign-born:
32.0% (188)
White alone - Speak another language Native:
2.9% (244)Foreign-born:
68.0% (399)
Hispanic or Latino - Speak only English Native:
44.7% (1,646)Foreign-born:
7.8% (206)
Hispanic or Latino - Speak another language Native:
55.4% (2,039)Foreign-born:
92.2% (2,440)
Foreign-born residents in Baldwin 8,634 residents are foreign born (20.9% Latin America ).
This city:
25.7%New York:
22.6%
Marital status for residents in Baldwin Marital status - White (Caucasian) population 15 years and over
Males 38.8% Never married51.9% Now married2.3% Separated2.2% Widowed4.8% DivorcedFemales 31.4% Never married48.2% Now married3.0% Separated11.1% Widowed6.4% DivorcedWomen who gave birth in the past 12 months Now married:
0.0% (0)Unmarried:
100.0% (13)
Women who did not give birth in the past 12 months Now married:
36.1% (800)Unmarried:
63.9% (1,415)
Marital status - Black or African American population 15 years and over
Males 39.3% Never married51.9% Now married0.6% Separated1.1% Widowed7.2% DivorcedFemales 35.1% Never married41.4% Now married3.0% Separated7.3% Widowed13.2% DivorcedWomen who gave birth in the past 12 months Now married:
85.9% (126)Unmarried:
14.1% (21)
Women who did not give birth in the past 12 months Now married:
37.2% (1,176)Unmarried:
62.8% (1,984)
Marital status - Asian population 15 years and over
Males 37.5% Never married59.5% Now married0.0% Separated0.0% Widowed3.0% DivorcedFemales 16.9% Never married74.5% Now married0.0% Separated4.1% Widowed4.5% DivorcedWomen who gave birth in the past 12 months Now married:
100.0% (20)Unmarried:
0.0% (0)
Women who did not give birth in the past 12 months Now married:
74.0% (178)Unmarried:
26.0% (63)
Marital status - Other race population 15 years and over
Males 33.0% Never married58.6% Now married8.4% Separated0.0% Widowed0.0% DivorcedFemales 25.7% Never married54.1% Now married3.8% Separated7.4% Widowed9.0% DivorcedWomen who gave birth in the past 12 months Now married:
0.0% (0)Unmarried:
100.0% (11)
Women who did not give birth in the past 12 months Now married:
60.8% (257)Unmarried:
39.2% (166)
Marital status - Two or more races population 15 years and over
Males 62.8% Never married32.5% Now married0.0% Separated0.5% Widowed4.2% DivorcedFemales 48.1% Never married37.4% Now married4.6% Separated0.4% Widowed9.5% DivorcedWomen who gave birth in the past 12 months Now married:
59.2% (248)Unmarried:
40.8% (171)
Women who did not give birth in the past 12 months Now married:
29.5% (345)Unmarried:
70.5% (824)
Marital status - White alone, not Hispanic / Latino population 15 years and over
Males 34.6% Never married55.4% Now married2.6% Separated2.9% Widowed4.6% DivorcedFemales 29.3% Never married48.8% Now married2.3% Separated13.2% Widowed6.5% DivorcedWomen who did not give birth in the past 12 months Now married:
34.2% (590)Unmarried:
65.8% (1,133)
Marital status - Hispanic or Latino population 15 years and over
Males 52.0% Never married42.2% Now married2.2% Separated0.0% Widowed3.6% DivorcedFemales 38.8% Never married44.9% Now married5.8% Separated2.3% Widowed8.2% DivorcedWomen who gave birth in the past 12 months Now married:
55.9% (146)Unmarried:
44.1% (115)
Women who did not give birth in the past 12 months Now married:
44.6% (672)Unmarried:
55.4% (833)
Ancestries in Baldwin
1,965 10.5% Jamaican1,793 9.6% Haitian1,352 7.2% Italian818 4.4% American755 4.0% West Indian719 3.8% Irish429 2.3% Nigerian328 1.8% Trinidadian and Tobagonian305 1.6% German248 1.3% African222 1.2% English185 1.0% Guyanese158 0.8% Polish109 0.6% European96 0.5% British West Indian86 0.5% Turkish68 0.4% Romanian62 0.3% Ghanaian56 0.3% Eastern European54 0.3% Armenian53 0.3% Belizean48 0.3% Lithuanian45 0.2% Russian27 0.1% Dutch23 0.1% Scotch-Irish23 0.1% Hungarian23 0.1% French Canadian22 0.1% Barbadian21 0.1% Danish19 0.1% Norwegian18 0.10% Austrian17 0.09% Portuguese14 0.07% Ukrainian13 0.07% Croatian13 0.07% Slovene11 0.06% Scottish11 0.06% Greek9 0.05% Pennsylvania German9 0.05% Welsh8 0.04% Israeli8 0.04% Iranian6 0.03% Scandinavian5 0.03% Serbian5 0.03% Swiss
Geographical mobility in Baldwin Same house 1 year ago 10,571 94.4% White (Caucasian)13,477 94.2% Black or African American15 100.0% American Indian / Alaska Native1,120 90.8% Asian1,901 97.9% Other race4,943 90.8% Two or more races8,951 96.7% White alone, not Hispanic / Latino5,923 88.9% Hispanic or LatinoMoved within same county 473 4.2% White / Caucasian301 2.1% Black or African American34 1.7% Other race543 10.0% Two or more races170 1.8% White alone, not Hispanic / Latino739 11.1% Hispanic or LatinoMoved within same state 32 0.3% White / Caucasian461 3.2% Black or African American124 10.1% Asian6 0.3% Other race20 0.4% Two or more races22 0.2% White alone, not Hispanic / Latino30 0.4% Hispanic or LatinoMoved from different state 68 0.6% White / Caucasian12 0.1% Black or African American69 0.7% White alone, not Hispanic / Latino13 0.2% Hispanic or LatinoMoved from abroad 8 0.1% Black or African American
Children Nativity (place of birth) in Baldwin
Children under 6 years - Living with two parents Both parents native 569 100.0% NativeBoth parents foreign-born 294 92.2% Native25 7.8% Foreign-bornOne native, one foreign-born parent 221 100.0% NativeChildren under 6 years - Living with one parent Native parent 427 100.0% NativeForeign-born parent 288 75.7% Native92 24.3% Foreign-bornChildren 6 to 17 years - Living with two parents Both parents native 1,334 100.0% NativeBoth parents foreign-born 1,015 95.8% Native44 4.2% Foreign-bornOne native, one foreign-born parent 885 100.0% NativeChildren 6 to 17 years - Living with one parent Native parent 904 100.0% NativeForeign-born parent 566 47.5% Native626 52.5% Foreign-born
Grandparents responsible for own grandchildren in Baldwin
Grandparents (30 to 59 years) White / Caucasian 20 100.0% Responsible for grandchildrenBlack or African American 105 25.5% Responsible for grandchildren305 74.5% Not responsible for grandchildrenTwo or more races 67 100.0% Not responsible for grandchildrenHispanic or Latino 24 47.0% Responsible for grandchildren27 53.0% Not responsible for grandchildrenGrandparents (60 years and over) White / Caucasian 19 13.8% Responsible for grandchildren117 86.2% Not responsible for grandchildrenBlack or African American 35 5.6% Responsible for grandchildren597 94.4% Not responsible for grandchildrenTwo or more races 15 11.4% Responsible for grandchildren114 88.6% Not responsible for grandchildrenHispanic or Latino 79 100.0% Not responsible for grandchildren