Races in Barretts, Georgia (GA) Detailed Stats
Ancestries, Foreign-born residents, place of birth
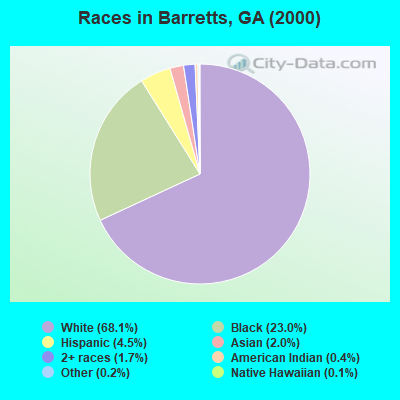
Race distribution in Barretts

- 9,04968.1%White alone
- 3,06123.0%Black alone
- 6024.5%Hispanic
- 2672.0%Asian alone
- 2281.7%Two or more races
- 550.4%American Indian alone
- 200.2%Other race alone
- 150.1%Native Hawaiian and Other
Pacific Islander alone
2000
2022
-
- 5,128,66162.6%White alone
- 2,331,46528.5%Black alone
- 435,2275.3%Hispanic
- 171,5132.1%Asian alone
- 87,3641.1%Two or more races
- 17,6700.2%American Indian alone
- 11,2750.1%Other race alone
- 3,2780.04%Native Hawaiian and Other
Pacific Islander alone

-
- 5,415,65749.6%White alone
- 3,349,24030.7%Black alone
- 1,132,60410.4%Hispanic
- 479,1564.4%Asian alone
- 462,9234.2%Two or more races
- 54,4160.5%Other race alone
- 11,9230.1%American Indian alone
- 6,9570.06%Native Hawaiian and Other
Pacific Islander alone

Income and house value in Barretts
- Median household income in 2022
- $73,002White non-Hispanic householders
- $58,822Black householders
- $145,176Asian householders
- $69,043Some other race householders
- $119,076Two or more races householders
- $81,783Hispanic or Latino race householders
- Median 2022 house value
- $238,125White Non-Hispanic householders
- $236,575Black or African American householders
- $355,122American Indian or Alaska Native householders
- $252,330Asian householders
- $219,530Two or more races householders
- $217,980Hispanic or Latino householders
Household income for White non-Hispanic householders

Household income for Black householders

Household income for American Indian and Alaska Native householders

Household income for Asian householders

Household income for Native Hawaiian and other Pacific Islander householders

Household income for Two or more races householders

Household income for Hispanic or Latino race householders

Zip code: 31605