Races in Barronett, Wisconsin (WI) Detailed Stats
Ancestries, Foreign-born residents, place of birth

Data:
Race distribution in Barronett

- 39597.5%White alone
- 51.2%Two or more races
- 20.5%Hispanic
- 20.5%Black alone
- 10.2%Asian alone
2000
2022
-
- 4,681,63087.3%White alone
- 300,2455.6%Black alone
- 192,9213.6%Hispanic
- 87,9951.6%Asian alone
- 51,9211.0%Two or more races
- 43,9800.8%American Indian alone
- 3,6370.07%Other race alone
- 1,3460.03%Native Hawaiian and Other
Pacific Islander alone
-
- 4,654,03179.0%White alone
- 447,0227.6%Hispanic
- 345,6785.9%Black alone
- 217,5323.7%Two or more races
- 172,2422.9%Asian alone
- 33,7620.6%American Indian alone
- 19,6800.3%Other race alone
- 2,5920.04%Native Hawaiian and Other
Pacific Islander alone
Income and house value in Barronett
- Median household income in 2022
- $68,210White non-Hispanic householders
- Median 2022 house value
- $152,559White Non-Hispanic householders
Household income for White non-Hispanic householders

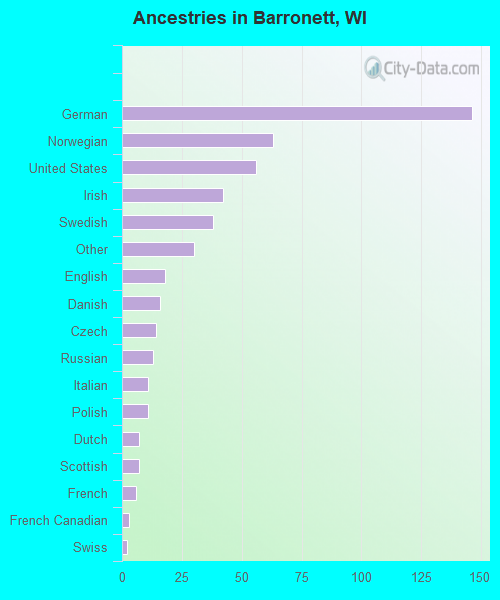
Ancestries in Barronett

- 14630.2%German
- 6313.0%Norwegian
- 5611.6%United States
- 428.7%Irish
- 387.9%Swedish
- 306.2%Other
- 183.7%English
- 163.3%Danish
- 142.9%Czech
- 132.7%Russian
- 112.3%Italian
- 112.3%Polish
- 71.4%Dutch
- 71.4%Scottish
- 61.2%French
- 30.6%French Canadian
- 20.4%Swiss