Races in Beavercreek, Ohio (OH) Detailed Stats
Data:
Races - White alone (%)
Races - White alone (% change since 2000)
Races - Black alone (%)
Races - Black alone (% change since 2000)
Races - American Indian alone (%)
Races - American Indian alone (% change since 2000)
Races - Asian alone (%)
Races - Asian alone (% change since 2000)
Races - Hispanic (%)
Races - Hispanic (% change since 2000)
Races - Native Hawaiian and Other Pacific Islander alone (%)
Races - Native Hawaiian and Other Pacific Islander alone (% change since 2000)
Races - Two or more races(%)
Races - Two or more races(% change since 2000)
Races - Other race alone (%)
Races - Other race alone (% change since 2000)
Racial diversity
Place of birth - Born in state of residence (%)
Place of birth - Born in state of residence (%) - White
Place of birth - Born in state of residence (%) - Black or African American
Place of birth - Born in state of residence (%) - Asian
Place of birth - Born in state of residence (%) - Hispanic or Latino
Place of birth - Born in state of residence (%) - American Indian and Alaska Native
Place of birth - Born in state of residence (%) - Multirace
Place of birth - Born in state of residence (%) - Other Race
Place of birth - Born in other state (%)
Place of birth - Born in other state (%) - White
Place of birth - Born in other state (%) - Black or African American
Place of birth - Born in other state (%) - Asian
Place of birth - Born in other state (%) - Hispanic or Latino
Place of birth - Born in other state (%) - American Indian and Alaska Native
Place of birth - Born in other state (%) - Multirace
Place of birth - Born in other state (%) - Other Race
Place of birth - Native, outside of US (%)
Place of birth - Native, outside of US (%) - White
Place of birth - Native, outside of US (%) - Black or African American
Place of birth - Native, outside of US (%) - Asian
Place of birth - Native, outside of US (%) - Hispanic or Latino
Place of birth - Native, outside of US (%) - American Indian and Alaska Native
Place of birth - Native, outside of US (%) - Multirace
Place of birth - Native, outside of US (%) - Other Race
Place of birth - Foreign born (%)
Place of birth - Foreign born (%) - White
Place of birth - Foreign born (%) - Black or African American
Place of birth - Foreign born (%) - Asian
Place of birth - Foreign born (%) - Hispanic or Latino
Place of birth - Foreign born (%) - American Indian and Alaska Native
Place of birth - Foreign born (%) - Multirace
Place of birth - Foreign born (%) - Other Race
Residents speaking English at home (%)
Residents speaking English at home - Born in the United States (%)
Residents speaking English at home - Native, born elsewhere (%)
Residents speaking English at home - Foreign born (%)
Residents speaking Spanish at home (%)
Residents speaking Spanish at home - Born in the United States (%)
Residents speaking Spanish at home - Native, born elsewhere (%)
Residents speaking Spanish at home - Foreign born (%)
Residents speaking other language at home (%)
Residents speaking other language at home - Born in the United States (%)
Residents speaking other language at home - Native, born elsewhere (%)
Residents speaking other language at home - Foreign born (%)
Marital status - Never married (%)
Marital status - Now married (%)
Marital status - Separated (%)
Marital status - Widowed (%)
Marital status - Divorced (%)
Ancestries Reported - Arab (%)
Ancestries Reported - Czech (%)
Ancestries Reported - Danish (%)
Ancestries Reported - Dutch (%)
Ancestries Reported - English (%)
Ancestries Reported - French (%)
Ancestries Reported - French Canadian (%)
Ancestries Reported - German (%)
Ancestries Reported - Greek (%)
Ancestries Reported - Hungarian (%)
Ancestries Reported - Irish (%)
Ancestries Reported - Italian (%)
Ancestries Reported - Lithuanian (%)
Ancestries Reported - Norwegian (%)
Ancestries Reported - Polish (%)
Ancestries Reported - Portuguese (%)
Ancestries Reported - Russian (%)
Ancestries Reported - Scotch-Irish (%)
Ancestries Reported - Scottish (%)
Ancestries Reported - Slovak (%)
Ancestries Reported - Subsaharan African (%)
Ancestries Reported - Swedish (%)
Ancestries Reported - Swiss (%)
Ancestries Reported - Ukrainian (%)
Ancestries Reported - United States (%)
Ancestries Reported - Welsh (%)
Ancestries Reported - West Indian (%)
Ancestries Reported - Other (%)
Geographical mobility - Same house 1 year ago (%)
Geographical mobility - Same house 1 year ago (%) - White
Geographical mobility - Same house 1 year ago (%) - Black or African American
Geographical mobility - Same house 1 year ago (%) - Asian
Geographical mobility - Same house 1 year ago (%) - Hispanic or Latino
Geographical mobility - Same house 1 year ago (%) - American Indian and Alaska Native
Geographical mobility - Same house 1 year ago (%) - Multirace
Geographical mobility - Same house 1 year ago (%) - Other Race
Geographical mobility - Moved within same county (%)
Geographical mobility - Moved within same county (%) - White
Geographical mobility - Moved within same county (%) - Black or African American
Geographical mobility - Moved within same county (%) - Asian
Geographical mobility - Moved within same county (%) - Hispanic or Latino
Geographical mobility - Moved within same county (%) - American Indian and Alaska Native
Geographical mobility - Moved within same county (%) - Multirace
Geographical mobility - Moved within same county (%) - Other Race
Geographical mobility - Moved from different county within same state (%)
Geographical mobility - Moved from different county within same state (%) - White
Geographical mobility - Moved from different county within same state (%) - Black or African American
Geographical mobility - Moved from different county within same state (%) - Asian
Geographical mobility - Moved from different county within same state (%) - Hispanic or Latino
Geographical mobility - Moved from different county within same state (%) - American Indian and Alaska Native
Geographical mobility - Moved from different county within same state (%) - Multirace
Geographical mobility - Moved from different county within same state (%) - Other Race
Geographical mobility - Moved from different state (%)
Geographical mobility - Moved from different state (%) - White
Geographical mobility - Moved from different state (%) - Black or African American
Geographical mobility - Moved from different state (%) - Asian
Geographical mobility - Moved from different state (%) - Hispanic or Latino
Geographical mobility - Moved from different state (%) - American Indian and Alaska Native
Geographical mobility - Moved from different state (%) - Multirace
Geographical mobility - Moved from different state (%) - Other Race
Geographical mobility - Moved from abroad (%)
Geographical mobility - Moved from abroad (%) - White
Geographical mobility - Moved from abroad (%) - Black or African American
Geographical mobility - Moved from abroad (%) - Asian
Geographical mobility - Moved from abroad (%) - Hispanic or Latino
Geographical mobility - Moved from abroad (%) - American Indian and Alaska Native
Geographical mobility - Moved from abroad (%) - Multirace
Geographical mobility - Moved from abroad (%) - Other Race
Place of birth for the foreign-born population - Ireland (%)
Place of birth for the foreign-born population - Denmark (%)
Place of birth for the foreign-born population - Norway (%)
Place of birth for the foreign-born population - Sweden (%)
Place of birth for the foreign-born population - United Kingdom (%)
Place of birth for the foreign-born population - England (%)
Place of birth for the foreign-born population - Scotland (%)
Place of birth for the foreign-born population - Other Northern Europe (%)
Place of birth for the foreign-born population - Austria (%)
Place of birth for the foreign-born population - Belgium (%)
Place of birth for the foreign-born population - France (%)
Place of birth for the foreign-born population - Germany (%)
Place of birth for the foreign-born population - Netherlands (%)
Place of birth for the foreign-born population - Switzerland (%)
Place of birth for the foreign-born population - Other Western Europe (%)
Place of birth for the foreign-born population - Greece (%)
Place of birth for the foreign-born population - Italy (%)
Place of birth for the foreign-born population - Portugal (%)
Place of birth for the foreign-born population - Spain (%)
Place of birth for the foreign-born population - Other Southern Europe (%)
Place of birth for the foreign-born population - Albania (%)
Place of birth for the foreign-born population - Belarus (%)
Place of birth for the foreign-born population - Bosnia and Herzegovina (%)
Place of birth for the foreign-born population - Bulgaria (%)
Place of birth for the foreign-born population - Croatia (%)
Place of birth for the foreign-born population - Czechoslovakia (%)
Place of birth for the foreign-born population - Hungary (%)
Place of birth for the foreign-born population - Latvia (%)
Place of birth for the foreign-born population - Lithuania (%)
Place of birth for the foreign-born population - North Macedonia (Macedonia) (%)
Place of birth for the foreign-born population - Moldova (%)
Place of birth for the foreign-born population - Poland (%)
Place of birth for the foreign-born population - Romania (%)
Place of birth for the foreign-born population - Russia (%)
Place of birth for the foreign-born population - Serbia (%)
Place of birth for the foreign-born population - Ukraine (%)
Place of birth for the foreign-born population - Other Eastern Europe (%)
Place of birth for the foreign-born population - China (%)
Place of birth for the foreign-born population - Hong Kong (%)
Place of birth for the foreign-born population - Taiwan (%)
Place of birth for the foreign-born population - Japan (%)
Place of birth for the foreign-born population - Korea (%)
Place of birth for the foreign-born population - Other Eastern Asia (%)
Place of birth for the foreign-born population - Afghanistan (%)
Place of birth for the foreign-born population - Bangladesh (%)
Place of birth for the foreign-born population - India (%)
Place of birth for the foreign-born population - Iran (%)
Place of birth for the foreign-born population - Kazakhstan (%)
Place of birth for the foreign-born population - Nepal (%)
Place of birth for the foreign-born population - Pakistan (%)
Place of birth for the foreign-born population - Sri Lanka (%)
Place of birth for the foreign-born population - Uzbekistan (%)
Place of birth for the foreign-born population - Other South Central Asia (%)
Place of birth for the foreign-born population - Burma (%)
Place of birth for the foreign-born population - Cambodia (%)
Place of birth for the foreign-born population - Indonesia (%)
Place of birth for the foreign-born population - Laos (%)
Place of birth for the foreign-born population - Malaysia (%)
Place of birth for the foreign-born population - Philippines (%)
Place of birth for the foreign-born population - Singapore (%)
Place of birth for the foreign-born population - Thailand (%)
Place of birth for the foreign-born population - Vietnam (%)
Place of birth for the foreign-born population - Other South Eastern Asia (%)
Place of birth for the foreign-born population - Armenia (%)
Place of birth for the foreign-born population - Iraq (%)
Place of birth for the foreign-born population - Israel (%)
Place of birth for the foreign-born population - Jordan (%)
Place of birth for the foreign-born population - Kuwait (%)
Place of birth for the foreign-born population - Lebanon (%)
Place of birth for the foreign-born population - Saudi Arabia (%)
Place of birth for the foreign-born population - Syria (%)
Place of birth for the foreign-born population - Turkey (%)
Place of birth for the foreign-born population - Yemen (%)
Place of birth for the foreign-born population - Other Western Asia (%)
Place of birth for the foreign-born population - Eritrea (%)
Place of birth for the foreign-born population - Ethiopia (%)
Place of birth for the foreign-born population - Kenya (%)
Place of birth for the foreign-born population - Somalia (%)
Place of birth for the foreign-born population - Uganda (%)
Place of birth for the foreign-born population - Zimbabwe (%)
Place of birth for the foreign-born population - Other Eastern Africa (%)
Place of birth for the foreign-born population - Cameroon (%)
Place of birth for the foreign-born population - Congo (%)
Place of birth for the foreign-born population - Democratic Republic of Congo (Zaire) (%)
Place of birth for the foreign-born population - Other Middle Africa (%)
Place of birth for the foreign-born population - Egypt (%)
Place of birth for the foreign-born population - Morocco (%)
Place of birth for the foreign-born population - Sudan (%)
Place of birth for the foreign-born population - Other Northern Africa (%)
Place of birth for the foreign-born population - South Africa (%)
Place of birth for the foreign-born population - Other Southern Africa (%)
Place of birth for the foreign-born population - Cabo Verde (%)
Place of birth for the foreign-born population - Ghana (%)
Place of birth for the foreign-born population - Liberia (%)
Place of birth for the foreign-born population - Nigeria (%)
Place of birth for the foreign-born population - Senegal (%)
Place of birth for the foreign-born population - Sierra Leone (%)
Place of birth for the foreign-born population - Other Western Africa (%)
Place of birth for the foreign-born population - Australia (%)
Place of birth for the foreign-born population - New Zealand (%)
Place of birth for the foreign-born population - Fiji (%)
Place of birth for the foreign-born population - Micronesia (%)
Place of birth for the foreign-born population - Bahamas (%)
Place of birth for the foreign-born population - Barbados (%)
Place of birth for the foreign-born population - Cuba (%)
Place of birth for the foreign-born population - Dominica (%)
Place of birth for the foreign-born population - Dominican Republic (%)
Place of birth for the foreign-born population - Grenada (%)
Place of birth for the foreign-born population - Haiti (%)
Place of birth for the foreign-born population - Jamaica (%)
Place of birth for the foreign-born population - St. Vincent and the Grenadines (%)
Place of birth for the foreign-born population - Trinidad and Tobago (%)
Place of birth for the foreign-born population - West Indies (%)
Place of birth for the foreign-born population - Other Caribbean (%)
Place of birth for the foreign-born population - Belize (%)
Place of birth for the foreign-born population - Costa Rica (%)
Place of birth for the foreign-born population - El Salvador (%)
Place of birth for the foreign-born population - Guatemala (%)
Place of birth for the foreign-born population - Honduras (%)
Place of birth for the foreign-born population - Mexico (%)
Place of birth for the foreign-born population - Nicaragua (%)
Place of birth for the foreign-born population - Panama (%)
Place of birth for the foreign-born population - Other Central America (%)
Place of birth for the foreign-born population - Argentina (%)
Place of birth for the foreign-born population - Bolivia (%)
Place of birth for the foreign-born population - Brazil (%)
Place of birth for the foreign-born population - Chile (%)
Place of birth for the foreign-born population - Colombia (%)
Place of birth for the foreign-born population - Ecuador (%)
Place of birth for the foreign-born population - Guyana (%)
Place of birth for the foreign-born population - Peru (%)
Place of birth for the foreign-born population - Uruguay (%)
Place of birth for the foreign-born population - Venezuela (%)
Place of birth for the foreign-born population - Other South America (%)
Place of birth for the foreign-born population - Canada (%)
Place of birth for the foreign-born population - Other Northern America (%)
Place of birth for the foreign-born population - Other (%)
Latest news about races in Beavercreek, OH collected exclusively by city-data.com from local newspapers, TV, and radio stations
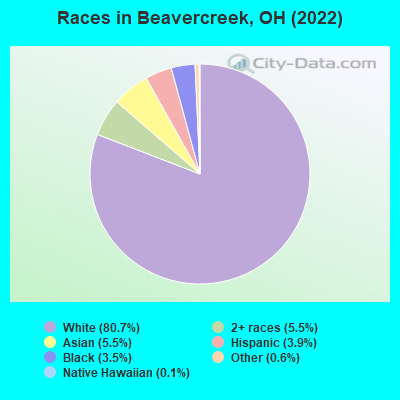
According to 2022 data, the most numerous races in Beavercreek, OH are White alone (37,779 residents), Black alone (1,636 residents), and Two or more races (2,581 residents). 94.2% of Beavercreek residents speak English at home. 5.5% of Beavercreek, OH residents are foreign-born (3.9% born in Asia, 0.7% born in Europe), which is 27.3% greater than the foreign-born rate of 4.0% across the entire state of Ohio.
Race distribution in Beavercreek
2000 2022
9,538,111 84.0% White alone 1,290,662 11.4% Black alone 217,123 1.9% Hispanic 137,770 1.2% Two or more races 131,670 1.2% Asian alone 21,985 0.2% American Indian alone 13,483 0.1% Other race alone 2,336 0.02% Native Hawaiian and Other
8,948,793 76.1% White alone 1,401,403 11.9% Black alone 529,291 4.5% Two or more races 517,232 4.4% Hispanic 293,387 2.5% Asian alone 52,805 0.4% Other race alone 9,785 0.08% American Indian alone 3,362 0.03% Native Hawaiian and Other
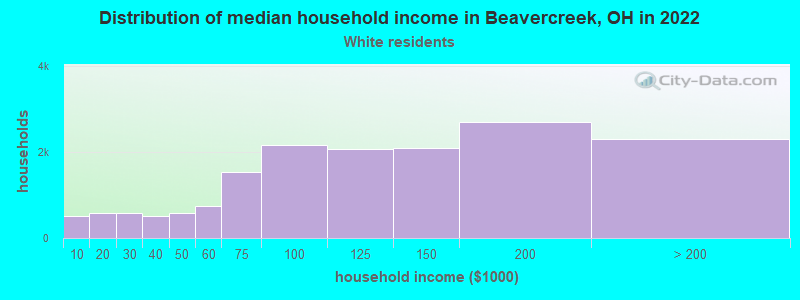
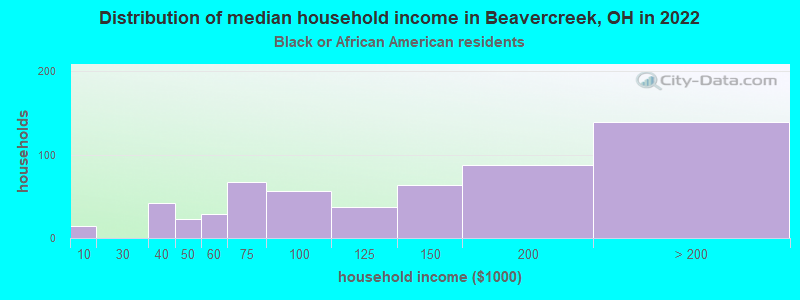
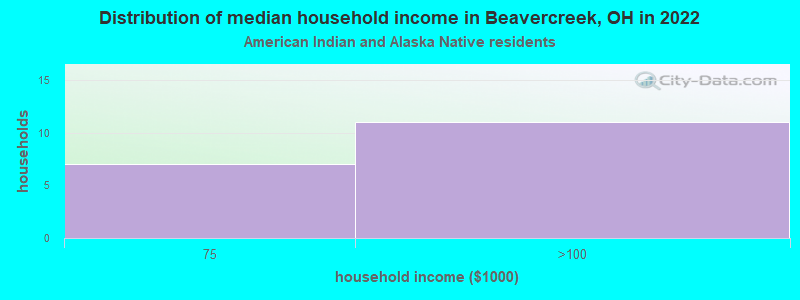
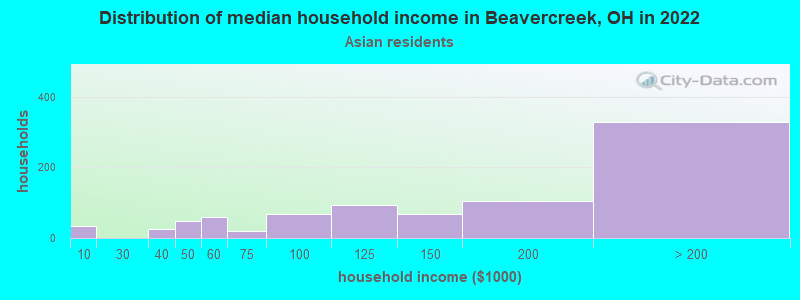
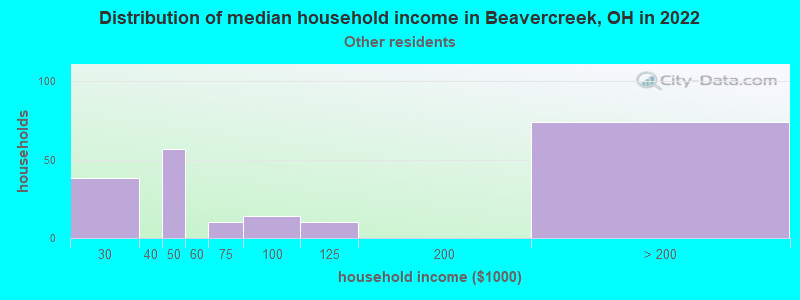
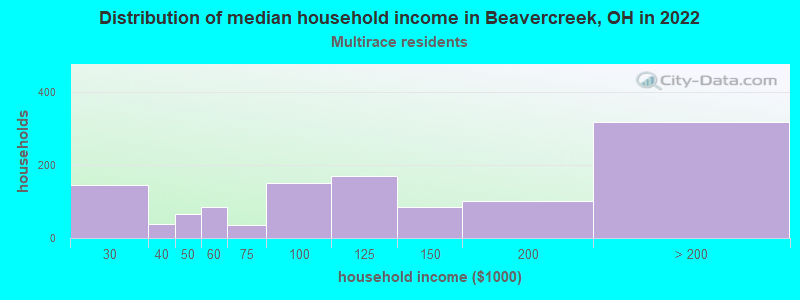
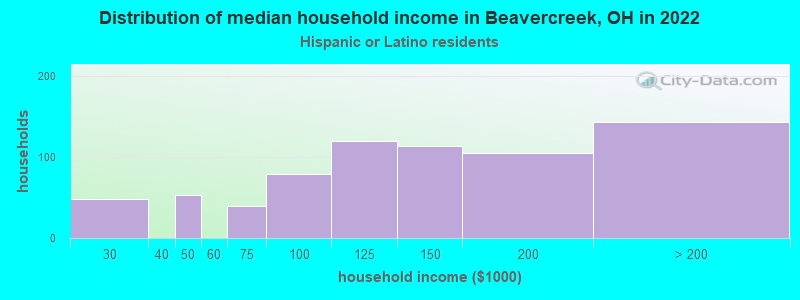
Income and house value in Beavercreek Median household income in 2022 $112,686 White non-Hispanic householders$127,287 Black householders$159,318 Asian householders$104,310 Two or more races householders$113,345 Hispanic or Latino race householdersMedian 2022 house value $272,329 White Non-Hispanic householders$369,493 Black or African American householders$263,513 American Indian or Alaska Native householders $363,169 Asian householders$311,424 Some other race householders$295,901 Two or more races householders$315,832 Hispanic or Latino householders
Median age by race in Beavercreek
43.9 Median age for White residents42.2 45.3 36.3 Median age for Black or African American residents32.0 51.7 14.7 Median age for American Indian / Alaska Native residents18.8 -443,438,913.6 39.6 Median age for Asian residents34.0 47.9 -800,387,596.1 Median age for Native Hawaiian / Pacific Islander residents-666,666,666.0 -805,394,989.6 38.2 Median age for Other race residents64.9 12.9 31.8 Median age for Two or more races residents20.7 43.9 44.7 Median age for White alone residents42.7 45.7 38.8 Median age for Hispanic or Latino residents29.0 40.2
Owner/renter occupied households by race in Beavercreek
House owners and renters - White residents 12,349 75.7% Owner occupied3,968 24.3% Renter occupiedHouse owners and renters - Black or African American residents 293 58.8% Owner occupied205 41.2% Renter occupiedHouse owners and renters - American Indian / Alaska Native residents 15 100.0% Owner occupiedHouse owners and renters - Asian residents 724 81.0% Owner occupied170 19.0% Renter occupiedHouse owners and renters - Other race residents 76 42.2% Owner occupied104 57.8% Renter occupiedHouse owners and renters - Two or more races residents 553 47.9% Owner occupied603 52.1% Renter occupiedHouse owners and renters - White alone residents 12,081 75.7% Owner occupied3,881 24.3% Renter occupiedHouse owners and renters - Hispanic or Latino residents 640 82.5% Owner occupied136 17.5% Renter occupied
Language usage in Beavercreek
English speakers - Total 94.2% of residents of Beavercreek speak English at home.
1.4% of residents speak Spanish at home 499 80.1% Speak English very well124 19.9% Speak English less than very well4.2% of residents speak other language at home 1,194 63.8% Speak English very well677 36.2% Speak English less than very well
English speakers - Born in the United States 96.4% of residents of Beavercreek speak English at home.
2.0% of residents speak Spanish at home 266 86.9% Speak English very well40 13.1% Speak English less than very well1.5% of residents speak other language at home 168 70.9% Speak English very well69 29.1% Speak English less than very well
English speakers - Native, born elsewhere 81.4% of residents of Beavercreek speak English at home.
12.3% of residents speak Spanish at home 115 87.1% Speak English very well17 12.9% Speak English less than very well2.5% of residents speak other language at home 16 59.3% Speak English very well11 40.7% Speak English less than very well
English speakers - Foreign-born 37.9% of residents of Beavercreek speak English at home.
4.5% of residents speak Spanish at home 71 68.9% Speak English very well32 31.1% Speak English less than very well60.8% of residents speak other language at home 682 48.8% Speak English very well715 51.2% Speak English less than very well
White (Caucasian) - Speak only English Native:
98.6% (35,810)Foreign-born:
67.8% (313)
White (Caucasian) - Speak another language Native:
1.3% (490)Foreign-born:
34.9% (161)
Black or African American - Speak only English Native:
98.6% (1,373)Foreign-born:
91.8% (20)
Black or African American - Speak another language Native:
1.3% (19)Foreign-born:
14.6% (3)
Asian - Speak only English Native:
74.7% (542)Foreign-born:
31.3% (518)
Asian - Speak another language Native:
24.1% (175)Foreign-born:
71.0% (1,173)
Other race - Speak another language Native:
43.2% (236)Foreign-born:
100.0% (30)
Two or more races - Speak only English Native:
92.6% (3,479)Foreign-born:
47.0% (159)
Two or more races - Speak another language Native:
7.1% (266)Foreign-born:
46.1% (156)
White alone - Speak only English Native:
98.9% (35,162)Foreign-born:
66.0% (315)
White alone - Speak another language Native:
1.1% (374)Foreign-born:
35.3% (169)
Hispanic or Latino - Speak only English Native:
74.9% (1,253)Foreign-born:
33.3% (39)
Hispanic or Latino - Speak another language Native:
23.1% (386)Foreign-born:
88.7% (105)
Foreign-born residents in Beavercreek 2,578 residents are foreign born (3.9% Asia , 0.7% Europe ).
Marital status for residents in Beavercreek Marital status - White (Caucasian) population 15 years and over
Males 27.1% Never married61.9% Now married0.5% Separated2.8% Widowed7.7% DivorcedFemales 20.0% Never married58.6% Now married0.9% Separated7.6% Widowed12.9% DivorcedWomen who gave birth in the past 12 months Now married:
89.1% (414)Unmarried:
10.9% (51)
Women who did not give birth in the past 12 months Now married:
49.9% (3,560)Unmarried:
50.1% (3,576)
Marital status - Black or African American population 15 years and over
Males 58.6% Never married29.2% Now married0.0% Separated4.8% Widowed7.3% DivorcedFemales 38.8% Never married35.1% Now married7.8% Separated0.0% Widowed18.3% DivorcedWomen who gave birth in the past 12 months Now married:
97.6% (1)Unmarried:
0.0% (0)
Women who did not give birth in the past 12 months Now married:
31.7% (99)Unmarried:
68.3% (213)
Marital status - Asian population 15 years and over
Males 28.8% Never married65.8% Now married2.8% Separated0.0% Widowed2.6% DivorcedFemales 18.4% Never married66.8% Now married0.0% Separated11.6% Widowed3.2% DivorcedWomen who gave birth in the past 12 months Now married:
100.0% (9)Unmarried:
0.0% (0)
Women who did not give birth in the past 12 months Now married:
60.5% (412)Unmarried:
39.5% (269)
Marital status - Other race population 15 years and over
Males 17.6% Never married49.5% Now married26.0% Separated0.0% Widowed6.9% DivorcedFemales 32.9% Never married48.6% Now married1.2% Separated6.9% Widowed10.4% DivorcedWomen who gave birth in the past 12 months Now married:
33.3% (8)Unmarried:
66.7% (16)
Women who did not give birth in the past 12 months Now married:
44.1% (59)Unmarried:
55.9% (75)
Marital status - Two or more races population 15 years and over
Males 53.3% Never married32.1% Now married0.0% Separated0.0% Widowed14.6% DivorcedFemales 24.7% Never married55.9% Now married4.2% Separated0.1% Widowed15.1% DivorcedWomen who gave birth in the past 12 months Now married:
75.8% (67)Unmarried:
24.2% (21)
Women who did not give birth in the past 12 months Now married:
48.8% (474)Unmarried:
51.2% (497)
Marital status - White alone, not Hispanic / Latino population 15 years and over
Males 27.0% Never married62.1% Now married0.5% Separated2.8% Widowed7.6% DivorcedFemales 20.0% Never married58.4% Now married0.9% Separated7.7% Widowed13.0% DivorcedWomen who gave birth in the past 12 months Now married:
88.7% (391)Unmarried:
11.3% (50)
Women who did not give birth in the past 12 months Now married:
49.7% (3,432)Unmarried:
50.3% (3,468)
Marital status - Hispanic or Latino population 15 years and over
Males 31.2% Never married55.7% Now married5.2% Separated0.0% Widowed7.9% DivorcedFemales 29.6% Never married54.0% Now married0.0% Separated3.6% Widowed12.8% DivorcedWomen who gave birth in the past 12 months Now married:
39.1% (19)Unmarried:
60.9% (30)
Women who did not give birth in the past 12 months Now married:
40.3% (179)Unmarried:
59.7% (265)
Ancestries in Beavercreek
4,090 20.1% German2,992 14.7% English2,879 14.1% American1,396 6.9% Irish1,048 5.1% European689 3.4% Italian450 2.2% Polish258 1.3% Scottish195 1.0% French176 0.9% Scotch-Irish173 0.8% Dutch126 0.6% Norwegian116 0.6% Welsh116 0.6% Swedish109 0.5% Hungarian100 0.5% African84 0.4% Slovak60 0.3% Egyptian56 0.3% Russian55 0.3% Austrian55 0.3% British54 0.3% Australian54 0.3% French Canadian48 0.2% Danish46 0.2% Iranian37 0.2% Brazilian36 0.2% Nigerian35 0.2% Maltese35 0.2% Finnish31 0.2% Lebanese30 0.1% Estonian29 0.1% Lithuanian29 0.1% Swiss28 0.1% Dutch West Indian22 0.1% Scandinavian18 0.09% Slavic17 0.08% Syrian17 0.08% Czechoslovakian16 0.08% Northern European14 0.07% Canadian12 0.06% Slovene12 0.06% Ukrainian12 0.06% Trinidadian and Tobagonian10 0.05% Palestinian9 0.04% Croatian8 0.04% Romanian8 0.04% Eastern European6 0.03% Moroccan5 0.02% Arab2 0.01% Greek
Geographical mobility in Beavercreek Same house 1 year ago 33,371 87.6% White (Caucasian)1,344 84.2% Black or African American35 87.0% American Indian / Alaska Native2,505 94.3% Asian69 100.0% Native Hawaiian / Pacific Islander499 81.9% Other race3,279 93.2% Two or more races32,711 87.5% White alone, not Hispanic / Latino1,590 90.0% Hispanic or LatinoMoved within same county 1,694 4.4% White / Caucasian93 5.8% Black or African American78 2.9% Asian2 0.4% Other race70 2.0% Two or more races1,706 4.6% White alone, not Hispanic / Latino26 1.5% Hispanic or LatinoMoved within same state 2,268 6.0% White / Caucasian73 4.6% Black or African American29 4.8% Other race285 8.1% Two or more races2,228 6.0% White alone, not Hispanic / LatinoMoved from different state 707 1.9% White / Caucasian54 3.4% Black or African American6 0.2% Asian46 7.6% Other race307 8.7% Two or more races671 1.8% White alone, not Hispanic / Latino125 7.1% Hispanic or LatinoMoved from abroad 28 0.1% White1 0.1% Black or African American7 16.5% American Indian / Alaska Native112 4.2% Asian59 9.7% Other race30 0.1% White alone, not Hispanic / Latino41 2.3% Hispanic or Latino
Children Nativity (place of birth) in Beavercreek
Children under 6 years - Living with two parents Both parents native 1,999 100.0% NativeBoth parents foreign-born 158 100.0% NativeOne native, one foreign-born parent 194 100.0% NativeChildren under 6 years - Living with one parent Native parent 215 100.0% NativeChildren 6 to 17 years - Living with two parents Both parents native 4,546 99.6% Native19 0.4% Foreign-bornBoth parents foreign-born 338 86.5% Native53 13.5% Foreign-bornOne native, one foreign-born parent 295 91.8% Native26 8.2% Foreign-bornChildren 6 to 17 years - Living with one parent Native parent 1,467 100.0% NativeForeign-born parent 9 50.4% Native9 49.6% Foreign-born
Grandparents responsible for own grandchildren in Beavercreek
Grandparents (30 to 59 years) White / Caucasian 28 26.8% Responsible for grandchildren77 73.2% Not responsible for grandchildrenWhite alone, not Hispanic / Latino 28 26.8% Responsible for grandchildren77 73.2% Not responsible for grandchildrenGrandparents (60 years and over) White / Caucasian 171 43.6% Responsible for grandchildren221 56.4% Not responsible for grandchildrenWhite alone, not Hispanic / Latino 171 43.6% Responsible for grandchildren221 56.4% Not responsible for grandchildren