Races in Bixby, Oklahoma (OK) Detailed Stats
Data:
Races - White alone (%)
Races - White alone (% change since 2000)
Races - Black alone (%)
Races - Black alone (% change since 2000)
Races - American Indian alone (%)
Races - American Indian alone (% change since 2000)
Races - Asian alone (%)
Races - Asian alone (% change since 2000)
Races - Hispanic (%)
Races - Hispanic (% change since 2000)
Races - Native Hawaiian and Other Pacific Islander alone (%)
Races - Native Hawaiian and Other Pacific Islander alone (% change since 2000)
Races - Two or more races(%)
Races - Two or more races(% change since 2000)
Races - Other race alone (%)
Races - Other race alone (% change since 2000)
Racial diversity
Place of birth - Born in state of residence (%)
Place of birth - Born in state of residence (%) - White
Place of birth - Born in state of residence (%) - Black or African American
Place of birth - Born in state of residence (%) - Asian
Place of birth - Born in state of residence (%) - Hispanic or Latino
Place of birth - Born in state of residence (%) - American Indian and Alaska Native
Place of birth - Born in state of residence (%) - Multirace
Place of birth - Born in state of residence (%) - Other Race
Place of birth - Born in other state (%)
Place of birth - Born in other state (%) - White
Place of birth - Born in other state (%) - Black or African American
Place of birth - Born in other state (%) - Asian
Place of birth - Born in other state (%) - Hispanic or Latino
Place of birth - Born in other state (%) - American Indian and Alaska Native
Place of birth - Born in other state (%) - Multirace
Place of birth - Born in other state (%) - Other Race
Place of birth - Native, outside of US (%)
Place of birth - Native, outside of US (%) - White
Place of birth - Native, outside of US (%) - Black or African American
Place of birth - Native, outside of US (%) - Asian
Place of birth - Native, outside of US (%) - Hispanic or Latino
Place of birth - Native, outside of US (%) - American Indian and Alaska Native
Place of birth - Native, outside of US (%) - Multirace
Place of birth - Native, outside of US (%) - Other Race
Place of birth - Foreign born (%)
Place of birth - Foreign born (%) - White
Place of birth - Foreign born (%) - Black or African American
Place of birth - Foreign born (%) - Asian
Place of birth - Foreign born (%) - Hispanic or Latino
Place of birth - Foreign born (%) - American Indian and Alaska Native
Place of birth - Foreign born (%) - Multirace
Place of birth - Foreign born (%) - Other Race
Residents speaking English at home (%)
Residents speaking English at home - Born in the United States (%)
Residents speaking English at home - Native, born elsewhere (%)
Residents speaking English at home - Foreign born (%)
Residents speaking Spanish at home (%)
Residents speaking Spanish at home - Born in the United States (%)
Residents speaking Spanish at home - Native, born elsewhere (%)
Residents speaking Spanish at home - Foreign born (%)
Residents speaking other language at home (%)
Residents speaking other language at home - Born in the United States (%)
Residents speaking other language at home - Native, born elsewhere (%)
Residents speaking other language at home - Foreign born (%)
Marital status - Never married (%)
Marital status - Now married (%)
Marital status - Separated (%)
Marital status - Widowed (%)
Marital status - Divorced (%)
Ancestries Reported - Arab (%)
Ancestries Reported - Czech (%)
Ancestries Reported - Danish (%)
Ancestries Reported - Dutch (%)
Ancestries Reported - English (%)
Ancestries Reported - French (%)
Ancestries Reported - French Canadian (%)
Ancestries Reported - German (%)
Ancestries Reported - Greek (%)
Ancestries Reported - Hungarian (%)
Ancestries Reported - Irish (%)
Ancestries Reported - Italian (%)
Ancestries Reported - Lithuanian (%)
Ancestries Reported - Norwegian (%)
Ancestries Reported - Polish (%)
Ancestries Reported - Portuguese (%)
Ancestries Reported - Russian (%)
Ancestries Reported - Scotch-Irish (%)
Ancestries Reported - Scottish (%)
Ancestries Reported - Slovak (%)
Ancestries Reported - Subsaharan African (%)
Ancestries Reported - Swedish (%)
Ancestries Reported - Swiss (%)
Ancestries Reported - Ukrainian (%)
Ancestries Reported - United States (%)
Ancestries Reported - Welsh (%)
Ancestries Reported - West Indian (%)
Ancestries Reported - Other (%)
Geographical mobility - Same house 1 year ago (%)
Geographical mobility - Same house 1 year ago (%) - White
Geographical mobility - Same house 1 year ago (%) - Black or African American
Geographical mobility - Same house 1 year ago (%) - Asian
Geographical mobility - Same house 1 year ago (%) - Hispanic or Latino
Geographical mobility - Same house 1 year ago (%) - American Indian and Alaska Native
Geographical mobility - Same house 1 year ago (%) - Multirace
Geographical mobility - Same house 1 year ago (%) - Other Race
Geographical mobility - Moved within same county (%)
Geographical mobility - Moved within same county (%) - White
Geographical mobility - Moved within same county (%) - Black or African American
Geographical mobility - Moved within same county (%) - Asian
Geographical mobility - Moved within same county (%) - Hispanic or Latino
Geographical mobility - Moved within same county (%) - American Indian and Alaska Native
Geographical mobility - Moved within same county (%) - Multirace
Geographical mobility - Moved within same county (%) - Other Race
Geographical mobility - Moved from different county within same state (%)
Geographical mobility - Moved from different county within same state (%) - White
Geographical mobility - Moved from different county within same state (%) - Black or African American
Geographical mobility - Moved from different county within same state (%) - Asian
Geographical mobility - Moved from different county within same state (%) - Hispanic or Latino
Geographical mobility - Moved from different county within same state (%) - American Indian and Alaska Native
Geographical mobility - Moved from different county within same state (%) - Multirace
Geographical mobility - Moved from different county within same state (%) - Other Race
Geographical mobility - Moved from different state (%)
Geographical mobility - Moved from different state (%) - White
Geographical mobility - Moved from different state (%) - Black or African American
Geographical mobility - Moved from different state (%) - Asian
Geographical mobility - Moved from different state (%) - Hispanic or Latino
Geographical mobility - Moved from different state (%) - American Indian and Alaska Native
Geographical mobility - Moved from different state (%) - Multirace
Geographical mobility - Moved from different state (%) - Other Race
Geographical mobility - Moved from abroad (%)
Geographical mobility - Moved from abroad (%) - White
Geographical mobility - Moved from abroad (%) - Black or African American
Geographical mobility - Moved from abroad (%) - Asian
Geographical mobility - Moved from abroad (%) - Hispanic or Latino
Geographical mobility - Moved from abroad (%) - American Indian and Alaska Native
Geographical mobility - Moved from abroad (%) - Multirace
Geographical mobility - Moved from abroad (%) - Other Race
Place of birth for the foreign-born population - Ireland (%)
Place of birth for the foreign-born population - Denmark (%)
Place of birth for the foreign-born population - Norway (%)
Place of birth for the foreign-born population - Sweden (%)
Place of birth for the foreign-born population - United Kingdom (%)
Place of birth for the foreign-born population - England (%)
Place of birth for the foreign-born population - Scotland (%)
Place of birth for the foreign-born population - Other Northern Europe (%)
Place of birth for the foreign-born population - Austria (%)
Place of birth for the foreign-born population - Belgium (%)
Place of birth for the foreign-born population - France (%)
Place of birth for the foreign-born population - Germany (%)
Place of birth for the foreign-born population - Netherlands (%)
Place of birth for the foreign-born population - Switzerland (%)
Place of birth for the foreign-born population - Other Western Europe (%)
Place of birth for the foreign-born population - Greece (%)
Place of birth for the foreign-born population - Italy (%)
Place of birth for the foreign-born population - Portugal (%)
Place of birth for the foreign-born population - Spain (%)
Place of birth for the foreign-born population - Other Southern Europe (%)
Place of birth for the foreign-born population - Albania (%)
Place of birth for the foreign-born population - Belarus (%)
Place of birth for the foreign-born population - Bosnia and Herzegovina (%)
Place of birth for the foreign-born population - Bulgaria (%)
Place of birth for the foreign-born population - Croatia (%)
Place of birth for the foreign-born population - Czechoslovakia (%)
Place of birth for the foreign-born population - Hungary (%)
Place of birth for the foreign-born population - Latvia (%)
Place of birth for the foreign-born population - Lithuania (%)
Place of birth for the foreign-born population - North Macedonia (Macedonia) (%)
Place of birth for the foreign-born population - Moldova (%)
Place of birth for the foreign-born population - Poland (%)
Place of birth for the foreign-born population - Romania (%)
Place of birth for the foreign-born population - Russia (%)
Place of birth for the foreign-born population - Serbia (%)
Place of birth for the foreign-born population - Ukraine (%)
Place of birth for the foreign-born population - Other Eastern Europe (%)
Place of birth for the foreign-born population - China (%)
Place of birth for the foreign-born population - Hong Kong (%)
Place of birth for the foreign-born population - Taiwan (%)
Place of birth for the foreign-born population - Japan (%)
Place of birth for the foreign-born population - Korea (%)
Place of birth for the foreign-born population - Other Eastern Asia (%)
Place of birth for the foreign-born population - Afghanistan (%)
Place of birth for the foreign-born population - Bangladesh (%)
Place of birth for the foreign-born population - India (%)
Place of birth for the foreign-born population - Iran (%)
Place of birth for the foreign-born population - Kazakhstan (%)
Place of birth for the foreign-born population - Nepal (%)
Place of birth for the foreign-born population - Pakistan (%)
Place of birth for the foreign-born population - Sri Lanka (%)
Place of birth for the foreign-born population - Uzbekistan (%)
Place of birth for the foreign-born population - Other South Central Asia (%)
Place of birth for the foreign-born population - Burma (%)
Place of birth for the foreign-born population - Cambodia (%)
Place of birth for the foreign-born population - Indonesia (%)
Place of birth for the foreign-born population - Laos (%)
Place of birth for the foreign-born population - Malaysia (%)
Place of birth for the foreign-born population - Philippines (%)
Place of birth for the foreign-born population - Singapore (%)
Place of birth for the foreign-born population - Thailand (%)
Place of birth for the foreign-born population - Vietnam (%)
Place of birth for the foreign-born population - Other South Eastern Asia (%)
Place of birth for the foreign-born population - Armenia (%)
Place of birth for the foreign-born population - Iraq (%)
Place of birth for the foreign-born population - Israel (%)
Place of birth for the foreign-born population - Jordan (%)
Place of birth for the foreign-born population - Kuwait (%)
Place of birth for the foreign-born population - Lebanon (%)
Place of birth for the foreign-born population - Saudi Arabia (%)
Place of birth for the foreign-born population - Syria (%)
Place of birth for the foreign-born population - Turkey (%)
Place of birth for the foreign-born population - Yemen (%)
Place of birth for the foreign-born population - Other Western Asia (%)
Place of birth for the foreign-born population - Eritrea (%)
Place of birth for the foreign-born population - Ethiopia (%)
Place of birth for the foreign-born population - Kenya (%)
Place of birth for the foreign-born population - Somalia (%)
Place of birth for the foreign-born population - Uganda (%)
Place of birth for the foreign-born population - Zimbabwe (%)
Place of birth for the foreign-born population - Other Eastern Africa (%)
Place of birth for the foreign-born population - Cameroon (%)
Place of birth for the foreign-born population - Congo (%)
Place of birth for the foreign-born population - Democratic Republic of Congo (Zaire) (%)
Place of birth for the foreign-born population - Other Middle Africa (%)
Place of birth for the foreign-born population - Egypt (%)
Place of birth for the foreign-born population - Morocco (%)
Place of birth for the foreign-born population - Sudan (%)
Place of birth for the foreign-born population - Other Northern Africa (%)
Place of birth for the foreign-born population - South Africa (%)
Place of birth for the foreign-born population - Other Southern Africa (%)
Place of birth for the foreign-born population - Cabo Verde (%)
Place of birth for the foreign-born population - Ghana (%)
Place of birth for the foreign-born population - Liberia (%)
Place of birth for the foreign-born population - Nigeria (%)
Place of birth for the foreign-born population - Senegal (%)
Place of birth for the foreign-born population - Sierra Leone (%)
Place of birth for the foreign-born population - Other Western Africa (%)
Place of birth for the foreign-born population - Australia (%)
Place of birth for the foreign-born population - New Zealand (%)
Place of birth for the foreign-born population - Fiji (%)
Place of birth for the foreign-born population - Micronesia (%)
Place of birth for the foreign-born population - Bahamas (%)
Place of birth for the foreign-born population - Barbados (%)
Place of birth for the foreign-born population - Cuba (%)
Place of birth for the foreign-born population - Dominica (%)
Place of birth for the foreign-born population - Dominican Republic (%)
Place of birth for the foreign-born population - Grenada (%)
Place of birth for the foreign-born population - Haiti (%)
Place of birth for the foreign-born population - Jamaica (%)
Place of birth for the foreign-born population - St. Vincent and the Grenadines (%)
Place of birth for the foreign-born population - Trinidad and Tobago (%)
Place of birth for the foreign-born population - West Indies (%)
Place of birth for the foreign-born population - Other Caribbean (%)
Place of birth for the foreign-born population - Belize (%)
Place of birth for the foreign-born population - Costa Rica (%)
Place of birth for the foreign-born population - El Salvador (%)
Place of birth for the foreign-born population - Guatemala (%)
Place of birth for the foreign-born population - Honduras (%)
Place of birth for the foreign-born population - Mexico (%)
Place of birth for the foreign-born population - Nicaragua (%)
Place of birth for the foreign-born population - Panama (%)
Place of birth for the foreign-born population - Other Central America (%)
Place of birth for the foreign-born population - Argentina (%)
Place of birth for the foreign-born population - Bolivia (%)
Place of birth for the foreign-born population - Brazil (%)
Place of birth for the foreign-born population - Chile (%)
Place of birth for the foreign-born population - Colombia (%)
Place of birth for the foreign-born population - Ecuador (%)
Place of birth for the foreign-born population - Guyana (%)
Place of birth for the foreign-born population - Peru (%)
Place of birth for the foreign-born population - Uruguay (%)
Place of birth for the foreign-born population - Venezuela (%)
Place of birth for the foreign-born population - Other South America (%)
Place of birth for the foreign-born population - Canada (%)
Place of birth for the foreign-born population - Other Northern America (%)
Place of birth for the foreign-born population - Other (%)
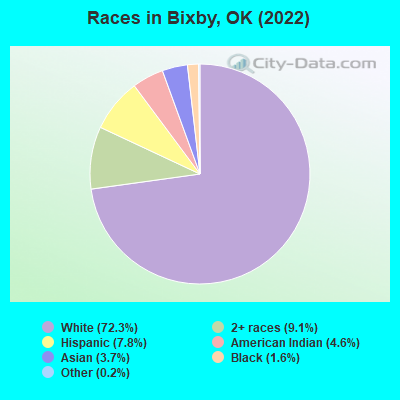
According to 2022 data, the most numerous races in Bixby, OK are White alone (21,042 residents), Hispanic (2,265 residents), and Two or more races (2,655 residents). 91.5% of Bixby residents speak English at home. 5.0% of Bixby, OK residents are foreign-born (2.3% born in Asia, 1.9% born in Latin America, 0.5% born in Europe), which is 19.8% less than the foreign-born rate of 6.0% across the entire state of Oklahoma.
Race distribution in Bixby
2000 2022
2,556,368 74.1% White alone 266,158 7.7% American Indian alone 257,981 7.5% Black alone 179,304 5.2% Hispanic 140,249 4.1% Two or more races 46,172 1.3% Asian alone 2,322 0.07% Other race alone 2,100 0.06% Native Hawaiian and Other
2,517,403 62.6% White alone 486,692 12.1% Hispanic 364,453 9.1% Two or more races 273,650 6.8% American Indian alone 268,543 6.7% Black alone 92,672 2.3% Asian alone 10,786 0.3% Other race alone 5,601 0.1% Native Hawaiian and Other
Income and house value in Bixby Median household income in 2022 $90,550 White non-Hispanic householders$134,973 Black householders$83,482 American Indian and Alaska Native householders$115,463 Asian householders$126,501 Some other race householders$77,173 Two or more races householders$62,579 Hispanic or Latino race householdersMedian 2022 house value $348,994 White Non-Hispanic householders$889,351 Black or African American householders$254,731 American Indian or Alaska Native householders$354,668 Native Hawaiian and other Pacific Islander householders$401,958 Some other race householders$317,468 Two or more races householders$401,958 Hispanic or Latino householders
Median age by race in Bixby
41.5 Median age for White residents40.2 42.7 39.3 Median age for Black or African American residents39.8 39.4 30.5 Median age for American Indian / Alaska Native residents27.5 30.9 34.4 Median age for Asian residents35.8 32.0 -633,554,083.3 Median age for Native Hawaiian / Pacific Islander residents-662,177,328.2 -442,328,041.9 33.7 Median age for Other race residents37.1 30.4 20.2 Median age for Two or more races residents21.4 19.5 41.3 Median age for White alone residents40.4 42.4 22.8 Median age for Hispanic or Latino residents25.5 22.4
Owner/renter occupied households by race in Bixby
House owners and renters - White residents 6,492 77.5% Owner occupied1,881 22.5% Renter occupiedHouse owners and renters - Black or African American residents 105 59.8% Owner occupied71 40.2% Renter occupiedHouse owners and renters - American Indian / Alaska Native residents 293 77.1% Owner occupied87 22.9% Renter occupiedHouse owners and renters - Asian residents 341 88.2% Owner occupied46 11.8% Renter occupiedHouse owners and renters - Other race residents 95 75.6% Owner occupied31 24.4% Renter occupiedHouse owners and renters - Two or more races residents 589 60.6% Owner occupied382 39.4% Renter occupiedHouse owners and renters - White alone residents 6,520 77.5% Owner occupied1,895 22.5% Renter occupiedHouse owners and renters - Hispanic or Latino residents 297 56.9% Owner occupied224 43.1% Renter occupied
Language usage in Bixby
English speakers - Total 91.5% of residents of Bixby speak English at home.
4.2% of residents speak Spanish at home 779 67.9% Speak English very well368 32.1% Speak English less than very well4.1% of residents speak other language at home 725 64.8% Speak English very well393 35.2% Speak English less than very well
English speakers - Born in the United States 95.5% of residents of Bixby speak English at home.
3.2% of residents speak Spanish at home 284 85.0% Speak English very well50 15.0% Speak English less than very well1.3% of residents speak other language at home 111 82.8% Speak English very well23 17.2% Speak English less than very well
All residents speak only English at home
English speakers - Foreign-born 15.5% of residents of Bixby speak English at home.
33.0% of residents speak Spanish at home 233 46.2% Speak English very well271 53.8% Speak English less than very well49.7% of residents speak other language at home 432 56.8% Speak English very well328 43.2% Speak English less than very well
White (Caucasian) - Speak only English Native:
99.7% (19,565)Foreign-born:
55.2% (131)
White (Caucasian) - Speak another language Native:
1.4% (268)Foreign-born:
55.5% (132)
Black or African American - Speak only English Native:
100.0% (439)Foreign-born:
26.5% (7)
American Indian / Alaska Native - Speak another language Native:
5.5% (72)Foreign-born:
74.5% (18)
Asian - Speak only English Native:
38.2% (135)Foreign-born:
9.0% (56)
Asian - Speak another language Native:
60.1% (212)Foreign-born:
90.3% (560)
Other race - Speak only English Native:
44.1% (123)Foreign-born:
16.4% (39)
Other race - Speak another language Native:
54.2% (151)Foreign-born:
82.2% (194)
Two or more races - Speak only English Native:
90.3% (3,009)Foreign-born:
2.0% (7)
Two or more races - Speak another language Native:
8.5% (284)Foreign-born:
99.6% (363)
White alone - Speak only English Native:
99.1% (19,470)Foreign-born:
57.7% (141)
White alone - Speak another language Native:
1.0% (199)Foreign-born:
44.5% (109)
Hispanic or Latino - Speak only English Native:
65.7% (952)Foreign-born:
8.2% (46)
Hispanic or Latino - Speak another language Native:
35.3% (512)Foreign-born:
91.4% (517)
Foreign-born residents in Bixby 1,457 residents are foreign born (2.3% Asia , 1.9% Latin America , 0.5% Europe ).
This city:
5.0%Oklahoma:
6.1%
Marital status for residents in Bixby Marital status - White (Caucasian) population 15 years and over
Males 23.1% Never married64.9% Now married1.0% Separated2.3% Widowed8.8% DivorcedFemales 21.8% Never married54.7% Now married0.8% Separated9.3% Widowed13.3% DivorcedWomen who gave birth in the past 12 months Now married:
90.3% (209)Unmarried:
9.7% (22)
Women who did not give birth in the past 12 months Now married:
52.9% (2,419)Unmarried:
47.1% (2,153)
Marital status - Black or African American population 15 years and over
Males 3.7% Never married91.1% Now married0.0% Separated0.0% Widowed5.2% DivorcedFemales 32.7% Never married52.7% Now married3.6% Separated7.8% Widowed3.2% DivorcedWomen who did not give birth in the past 12 months Now married:
53.9% (86)Unmarried:
46.1% (74)
Marital status - American Indian / Alaska Native population 15 years and over
Males 29.3% Never married55.0% Now married3.9% Separated3.9% Widowed8.0% DivorcedFemales 32.9% Never married56.9% Now married0.0% Separated2.2% Widowed8.0% DivorcedWomen who gave birth in the past 12 months Now married:
0.0% (0)Unmarried:
100.0% (18)
Women who did not give birth in the past 12 months Now married:
52.6% (206)Unmarried:
47.4% (186)
Marital status - Asian population 15 years and over
Males 8.3% Never married84.9% Now married0.0% Separated0.0% Widowed6.8% DivorcedFemales 14.0% Never married85.1% Now married0.0% Separated0.8% Widowed0.0% DivorcedWomen who gave birth in the past 12 months Now married:
100.0% (20)Unmarried:
0.0% (0)
Women who did not give birth in the past 12 months Now married:
80.7% (227)Unmarried:
19.3% (54)
Marital status - Other race population 15 years and over
Males 33.8% Never married54.1% Now married0.0% Separated12.1% Widowed0.0% DivorcedFemales 31.8% Never married58.8% Now married4.7% Separated0.0% Widowed4.7% DivorcedWomen who gave birth in the past 12 months Now married:
100.0% (14)Unmarried:
0.0% (0)
Women who did not give birth in the past 12 months Now married:
57.5% (110)Unmarried:
42.5% (81)
Marital status - Two or more races population 15 years and over
Males 37.4% Never married45.9% Now married0.7% Separated3.0% Widowed13.0% DivorcedFemales 46.8% Never married44.1% Now married3.0% Separated1.7% Widowed4.4% DivorcedWomen who gave birth in the past 12 months Now married:
100.0% (14)Unmarried:
0.0% (0)
Women who did not give birth in the past 12 months Now married:
42.3% (479)Unmarried:
57.7% (654)
Marital status - White alone, not Hispanic / Latino population 15 years and over
Males 23.2% Never married64.9% Now married1.0% Separated2.3% Widowed8.5% DivorcedFemales 21.9% Never married54.6% Now married0.8% Separated9.4% Widowed13.3% DivorcedWomen who gave birth in the past 12 months Now married:
89.8% (208)Unmarried:
10.2% (24)
Women who did not give birth in the past 12 months Now married:
52.8% (2,465)Unmarried:
47.2% (2,201)
Marital status - Hispanic or Latino population 15 years and over
Males 22.2% Never married62.0% Now married0.0% Separated4.8% Widowed11.0% DivorcedFemales 38.7% Never married50.4% Now married2.7% Separated1.3% Widowed6.9% DivorcedWomen who gave birth in the past 12 months Now married:
100.0% (33)Unmarried:
0.0% (0)
Women who did not give birth in the past 12 months Now married:
45.9% (280)Unmarried:
54.1% (331)
Ancestries in Bixby
1,976 14.5% English1,552 11.4% German997 7.3% American815 6.0% Irish735 5.4% European335 2.5% Scottish188 1.4% Italian173 1.3% French125 0.9% Danish116 0.9% Greek109 0.8% Scotch-Irish98 0.7% Northern European75 0.6% Scandinavian73 0.5% British69 0.5% Polish60 0.4% Iranian60 0.4% Norwegian53 0.4% Welsh52 0.4% Moroccan50 0.4% Dutch26 0.2% Ukrainian23 0.2% Swedish22 0.2% Brazilian20 0.1% Eastern European20 0.1% Finnish18 0.1% Lebanese18 0.1% Russian17 0.1% Czech13 0.10% Kenyan8 0.06% Australian6 0.04% Armenian6 0.04% Slovak3 0.02% Austrian
Geographical mobility in Bixby Same house 1 year ago 18,120 88.1% White (Caucasian)418 84.5% Black or African American1,227 85.7% American Indian / Alaska Native879 81.7% Asian472 89.3% Other race3,407 80.9% Two or more races18,239 87.7% White alone, not Hispanic / Latino1,888 85.0% Hispanic or LatinoMoved within same county 1,608 7.8% White / Caucasian37 7.4% Black or African American101 7.1% American Indian / Alaska Native123 11.4% Asian32 6.0% Other race627 14.9% Two or more races1,640 7.9% White alone, not Hispanic / Latino235 10.6% Hispanic or LatinoMoved within same state 341 1.7% White / Caucasian47 9.5% Black or African American48 3.3% American Indian / Alaska Native45 1.1% Two or more races356 1.7% White alone, not Hispanic / Latino9 0.4% Hispanic or LatinoMoved from different state 532 2.6% White / Caucasian4 0.8% Black or African American56 3.9% American Indian / Alaska Native38 3.5% Asian18 3.4% Other race68 1.6% Two or more races568 2.7% White alone, not Hispanic / Latino64 2.9% Hispanic or LatinoMoved from abroad 4 0.0% White64 1.5% Two or more races6 0.0% White alone, not Hispanic / Latino32 1.5% Hispanic or Latino
Children Nativity (place of birth) in Bixby
Children under 6 years - Living with two parents Both parents native 1,585 100.0% NativeBoth parents foreign-born 173 100.0% NativeOne native, one foreign-born parent 196 100.0% NativeChildren under 6 years - Living with one parent Native parent 273 100.0% NativeForeign-born parent 72 100.0% NativeChildren 6 to 17 years - Living with two parents Both parents native 4,033 99.6% Native15 0.4% Foreign-bornBoth parents foreign-born 212 78.3% Native59 21.7% Foreign-bornOne native, one foreign-born parent 350 100.0% NativeChildren 6 to 17 years - Living with one parent Native parent 1,208 100.0% NativeForeign-born parent 108 50.3% Native107 49.7% Foreign-born
Grandparents responsible for own grandchildren in Bixby
Grandparents (30 to 59 years) White / Caucasian 29 74.4% Responsible for grandchildren10 25.6% Not responsible for grandchildrenAmerican Indian / Alaska Native 27 100.0% Not responsible for grandchildrenWhite alone, not Hispanic / Latino 31 73.4% Responsible for grandchildren11 26.6% Not responsible for grandchildren
Grandparents (60 years and over) White / Caucasian 1 0.5% Responsible for grandchildren208 99.5% Not responsible for grandchildrenAmerican Indian / Alaska Native 2 100.0% Responsible for grandchildrenWhite alone, not Hispanic / Latino 1 0.5% Responsible for grandchildren211 99.5% Not responsible for grandchildren