Races in Bloomfield Township, Michigan (MI) Detailed Stats
Ancestries, Foreign-born residents, place of birth

Recent posts about races in Bloomfield Township, Michigan on our local forum with over 2,400,000 registered users:

14.2% of Bloomfield Township, MI residents are foreign-born (6.8% born in Asia, 4.9% born in Europe), which is 57.6% greater than the foreign-born rate of 6.0% across the entire state of Michigan.
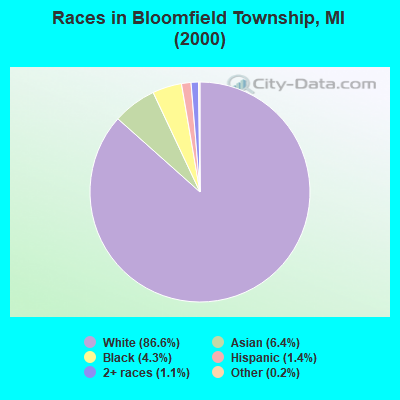
Race distribution in Bloomfield Township

- 37,24786.6%White alone
- 2,7726.4%Asian alone
- 1,8354.3%Black alone
- 5951.4%Hispanic
- 4521.1%Two or more races
- 650.2%Other race alone
- 320.07%American Indian alone
- 230.05%Native Hawaiian and Other
Pacific Islander alone
2000
2022
-
- 7,806,69178.6%White alone
- 1,402,04714.1%Black alone
- 323,8773.3%Hispanic
- 175,3111.8%Asian alone
- 163,4871.6%Two or more races
- 53,4210.5%American Indian alone
- 11,4650.1%Other race alone
- 2,1450.02%Native Hawaiian and Other
Pacific Islander alone

-
- 7,289,05172.6%White alone
- 1,310,46413.1%Black alone
- 572,4055.7%Hispanic
- 450,0314.5%Two or more races
- 335,7323.3%Asian alone
- 45,2170.5%Other race alone
- 29,0110.3%American Indian alone
- 2,2070.02%Native Hawaiian and Other
Pacific Islander alone

Income and house value in Bloomfield Township
- Median household income in 2022
- $155,054White non-Hispanic householders
- $90,969Black householders
- over $200,000American Indian and Alaska Native householders
- over $200,000Asian householders
- $86,830Some other race householders
- $160,081Two or more races householders
- $166,688Hispanic or Latino race householders
- Median 2022 house value
- $683,678White Non-Hispanic householders
- $535,979Black or African American householders
- $428,250American Indian or Alaska Native householders
- $790,836Asian householders
- $123,716Native Hawaiian and other Pacific Islander householders
- $991,257Some other race householders
- $493,725Two or more races householders
- $441,003Hispanic or Latino householders
Household income for White non-Hispanic householders

Household income for Black householders

Household income for American Indian and Alaska Native householders

Household income for Asian householders

Household income for Native Hawaiian and other Pacific Islander householders

Household income for Two or more races householders

Household income for Hispanic or Latino race householders

Foreign-born residents in Bloomfield Township
6,095 residents are foreign born (6.8% Asia, 4.9% Europe).
| This city: | 14.2% |
| Michigan: | 5.3% |
Ancestries in Bloomfield Township

- 11,46722.1%Other
- 8,30716.0%German
- 6,03111.6%Irish
- 5,85811.3%English
- 3,5566.9%Polish
- 2,4194.7%Italian
- 1,8003.5%French
- 1,6763.2%Russian
- 1,6153.1%United States
- 1,3372.6%Scottish
- 1,2722.5%Arab
- 9001.7%Swedish
- 7761.5%Scotch-Irish
- 6661.3%French Canadian
- 6451.2%Dutch
- 6341.2%Greek
- 4500.9%Czech
- 4250.8%Hungarian
- 4180.8%Ukrainian
- 3060.6%Welsh
- 2870.6%Lithuanian
- 2840.5%Norwegian
- 2390.5%Danish
- 2080.4%Swiss
- 1520.3%Slovak
- 850.2%Subsaharan African
- 470.09%Portuguese
- 390.08%West Indian

Zip codes: 48302.