Races in Boling-Iago, Texas (TX) Detailed Stats
Ancestries, Foreign-born residents, place of birth

Discuss Boling-Iago, Texas races on our local forum with over 2,400,000 registered users
21.1% of Boling-Iago, TX residents are foreign-born (21.1% born in Latin America), which is 19.4% greater than the foreign-born rate of 17.0% across the entire state of Texas.
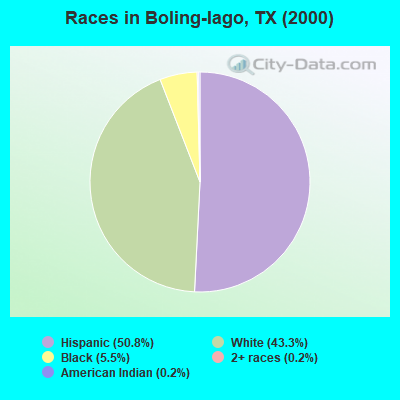
Race distribution in Boling-Iago

- 64650.8%Hispanic
- 55043.3%White alone
- 705.5%Black alone
- 30.2%Two or more races
- 20.2%American Indian alone
2000
2022
-
- 10,933,31352.4%White alone
- 6,669,66632.0%Hispanic
- 2,364,25511.3%Black alone
- 554,4452.7%Asian alone
- 230,5671.1%Two or more races
- 68,8590.3%American Indian alone
- 19,9580.10%Other race alone
- 10,7570.05%Native Hawaiian and Other
Pacific Islander alone

-
- 12,070,64240.2%Hispanic
- 11,683,43038.9%White alone
- 3,508,70611.7%Black alone
- 1,608,1735.4%Asian alone
- 956,5603.2%Two or more races
- 125,7630.4%Other race alone
- 47,0230.2%American Indian alone
- 29,2750.10%Native Hawaiian and Other
Pacific Islander alone

Income and house value in Boling-Iago
- Median household income in 2022
- $63,753White non-Hispanic householders
- $87,102Black householders
- $49,797Some other race householders
- $45,873Two or more races householders
- $49,387Hispanic or Latino race householders
- Median 2022 house value
- $143,022White Non-Hispanic householders
- $111,780Some other race householders
- $130,178Two or more races householders
- $137,468Hispanic or Latino householders
Household income for White non-Hispanic householders

Household income for Black householders

Household income for Two or more races householders

Household income for Hispanic or Latino race householders

Foreign-born residents in Boling-Iago
268 residents are foreign born (21.1% Latin America).
| This city: | 21.1% |
| Texas: | 13.9% |
Ancestries in Boling-Iago

- 77459.6%Other
- 14411.1%German
- 1118.6%United States
- 876.7%Czech
- 735.6%English
- 655.0%Irish
- 211.6%French
- 100.8%Scottish
- 70.5%Hungarian
- 60.5%Subsaharan African

Zip codes: 77420.