Races in Chesterfield, New Hampshire (NH) Detailed Stats
Ancestries, Foreign-born residents, place of birth

Recent posts about races in Chesterfield, New Hampshire on our local forum with over 2,400,000 registered users:
 | Large NH Estate Home Finally Goes Under Contract And A New One Is Listed (14 replies) |
| Living in NH vs VT (5 replies) |
| Looking at Southern NH...Where would you recommend searching? (15 replies) |
| Life in Keene (5 replies) |
| Broadband/High Speed Internet access? (47 replies) |
| 2010 Trick or Treat!! (3 replies) |
3.2% of Chesterfield, NH residents are foreign-born (1.4% born in Europe, 1.3% born in North America), which is 58.1% less than the foreign-born rate of 5.0% across the entire state of New Hampshire.
Race distribution in Chesterfield

- 3,44997.4%White alone
- 401.1%Two or more races
- 200.6%Hispanic
- 190.5%American Indian alone
- 60.2%Asian alone
- 60.2%Black alone
- 20.06%Other race alone

2000
2022
-
- 1,175,25295.1%White alone
- 20,4891.7%Hispanic
- 15,8031.3%Asian alone
- 11,6060.9%Two or more races
- 8,3540.7%Black alone
- 2,6980.2%American Indian alone
- 1,2540.1%Other race alone
- 3300.03%Native Hawaiian and Other
Pacific Islander alone

-
- 1,208,10186.6%White alone
- 63,4794.5%Hispanic
- 60,7244.4%Two or more races
- 36,5192.6%Asian alone
- 17,9311.3%Black alone
- 6,6150.5%Other race alone
- 1,0140.07%American Indian alone
- 8480.06%Native Hawaiian and Other
Pacific Islander alone

Income and house value in Chesterfield
- Median household income in 2022
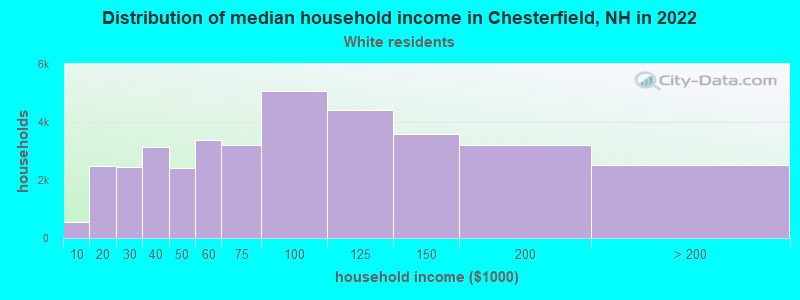
- $96,760White non-Hispanic householders
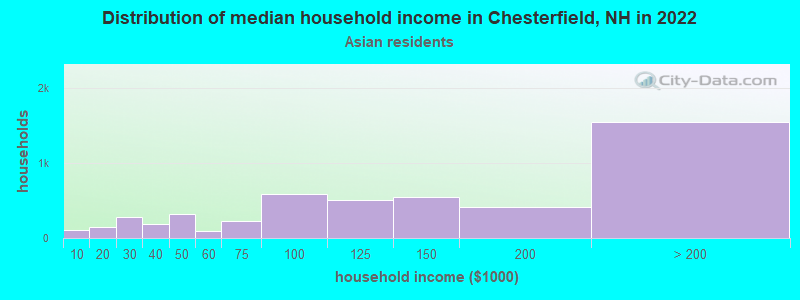
- $47,609Asian householders
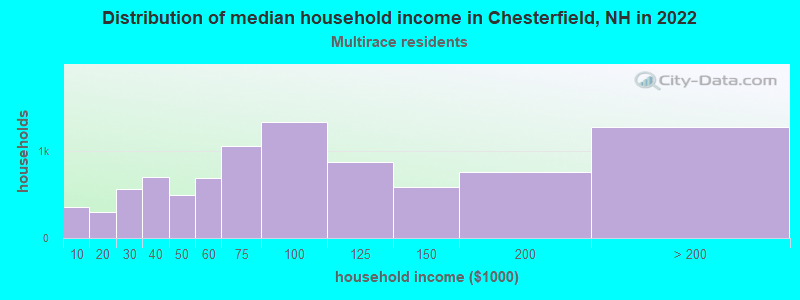
- $64,900Two or more races householders
- $83,330Hispanic or Latino race householders
- Median 2022 house value
- $336,801White Non-Hispanic householders
- $291,462Two or more races householders
Household income for White non-Hispanic householders
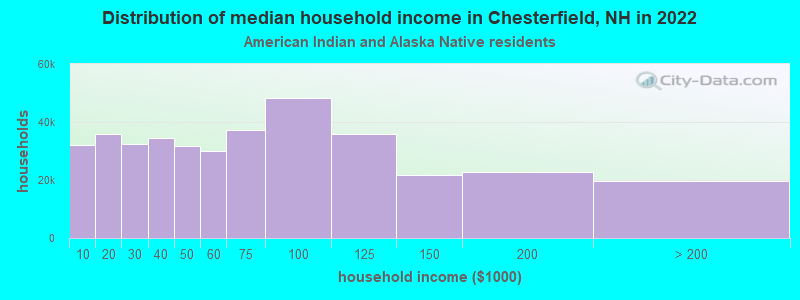
Household income for American Indian and Alaska Native householders
Household income for Asian householders
Household income for Two or more races householders
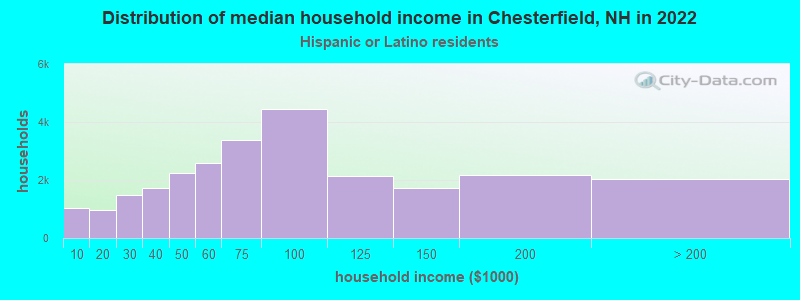
Household income for Hispanic or Latino race householders
Foreign-born residents in Chesterfield
112 residents are foreign born (1.4% Europe, 1.3% North America).
| This city: | 3.2% |
| New Hampshire: | 4.4% |
Ancestries in Chesterfield

- 82119.4%English
- 63715.1%Irish
- 47411.2%German
- 42610.1%French
- 3568.4%Other
- 2596.1%French Canadian
- 2165.1%Italian
- 1934.6%Scottish
- 1884.4%United States
- 1794.2%Polish
- 731.7%Scotch-Irish
- 701.7%Dutch
- 671.6%Russian
- 581.4%Swedish
- 370.9%Hungarian
- 300.7%Welsh
- 280.7%Greek
- 260.6%Portuguese
- 260.6%Ukrainian
- 160.4%Norwegian
- 160.4%Swiss
- 130.3%Danish
- 90.2%Arab
- 50.1%Lithuanian
- 30.07%Subsaharan African

Zip codes: 03462.