Races in Daytona Beach, Florida (FL) Detailed Stats
Data:
Races - White alone (%)
Races - White alone (% change since 2000)
Races - Black alone (%)
Races - Black alone (% change since 2000)
Races - American Indian alone (%)
Races - American Indian alone (% change since 2000)
Races - Asian alone (%)
Races - Asian alone (% change since 2000)
Races - Hispanic (%)
Races - Hispanic (% change since 2000)
Races - Native Hawaiian and Other Pacific Islander alone (%)
Races - Native Hawaiian and Other Pacific Islander alone (% change since 2000)
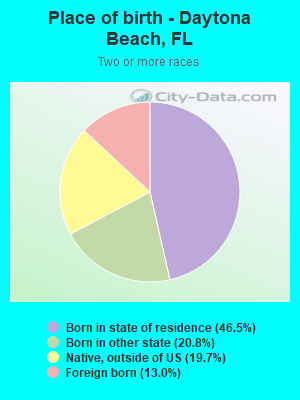
Races - Two or more races(%)
Races - Two or more races(% change since 2000)
Races - Other race alone (%)
Races - Other race alone (% change since 2000)
Racial diversity
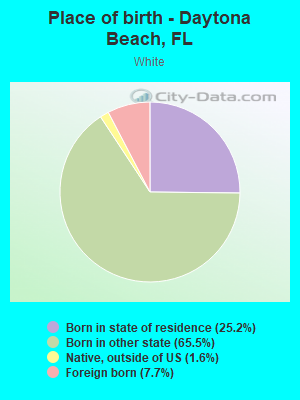
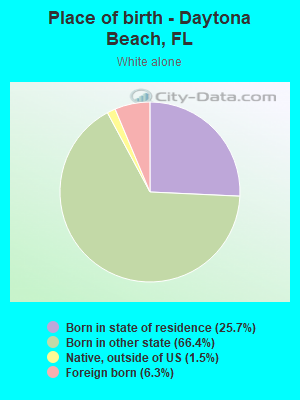
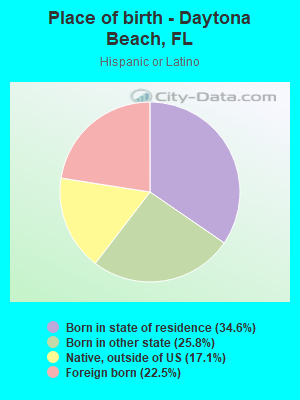
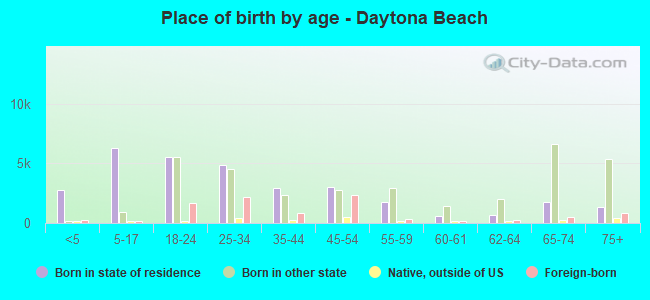
Place of birth - Born in state of residence (%)
Place of birth - Born in state of residence (%) - White
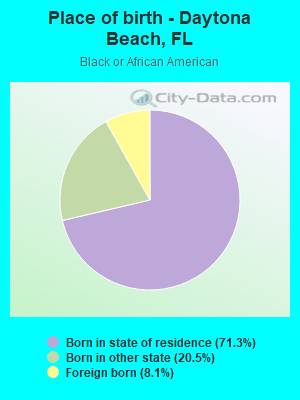
Place of birth - Born in state of residence (%) - Black or African American
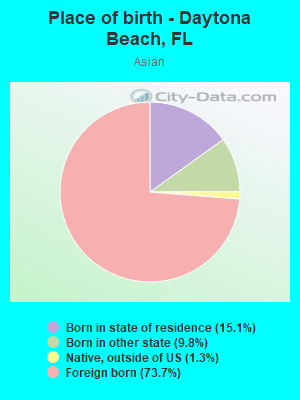
Place of birth - Born in state of residence (%) - Asian
Place of birth - Born in state of residence (%) - Hispanic or Latino
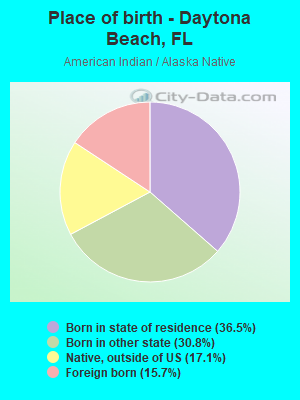
Place of birth - Born in state of residence (%) - American Indian and Alaska Native
Place of birth - Born in state of residence (%) - Multirace
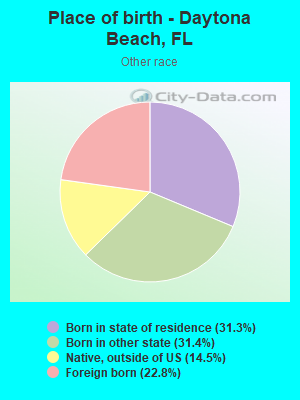
Place of birth - Born in state of residence (%) - Other Race
Place of birth - Born in other state (%)
Place of birth - Born in other state (%) - White
Place of birth - Born in other state (%) - Black or African American
Place of birth - Born in other state (%) - Asian
Place of birth - Born in other state (%) - Hispanic or Latino
Place of birth - Born in other state (%) - American Indian and Alaska Native
Place of birth - Born in other state (%) - Multirace
Place of birth - Born in other state (%) - Other Race
Place of birth - Native, outside of US (%)
Place of birth - Native, outside of US (%) - White
Place of birth - Native, outside of US (%) - Black or African American
Place of birth - Native, outside of US (%) - Asian
Place of birth - Native, outside of US (%) - Hispanic or Latino
Place of birth - Native, outside of US (%) - American Indian and Alaska Native
Place of birth - Native, outside of US (%) - Multirace
Place of birth - Native, outside of US (%) - Other Race
Place of birth - Foreign born (%)
Place of birth - Foreign born (%) - White
Place of birth - Foreign born (%) - Black or African American
Place of birth - Foreign born (%) - Asian
Place of birth - Foreign born (%) - Hispanic or Latino
Place of birth - Foreign born (%) - American Indian and Alaska Native
Place of birth - Foreign born (%) - Multirace
Place of birth - Foreign born (%) - Other Race
Residents speaking English at home (%)
Residents speaking English at home - Born in the United States (%)
Residents speaking English at home - Native, born elsewhere (%)
Residents speaking English at home - Foreign born (%)
Residents speaking Spanish at home (%)
Residents speaking Spanish at home - Born in the United States (%)
Residents speaking Spanish at home - Native, born elsewhere (%)
Residents speaking Spanish at home - Foreign born (%)
Residents speaking other language at home (%)
Residents speaking other language at home - Born in the United States (%)
Residents speaking other language at home - Native, born elsewhere (%)
Residents speaking other language at home - Foreign born (%)
Marital status - Never married (%)
Marital status - Now married (%)
Marital status - Separated (%)
Marital status - Widowed (%)
Marital status - Divorced (%)
Ancestries Reported - Arab (%)
Ancestries Reported - Czech (%)
Ancestries Reported - Danish (%)
Ancestries Reported - Dutch (%)
Ancestries Reported - English (%)
Ancestries Reported - French (%)
Ancestries Reported - French Canadian (%)
Ancestries Reported - German (%)
Ancestries Reported - Greek (%)
Ancestries Reported - Hungarian (%)
Ancestries Reported - Irish (%)
Ancestries Reported - Italian (%)
Ancestries Reported - Lithuanian (%)
Ancestries Reported - Norwegian (%)
Ancestries Reported - Polish (%)
Ancestries Reported - Portuguese (%)
Ancestries Reported - Russian (%)
Ancestries Reported - Scotch-Irish (%)
Ancestries Reported - Scottish (%)
Ancestries Reported - Slovak (%)
Ancestries Reported - Subsaharan African (%)
Ancestries Reported - Swedish (%)
Ancestries Reported - Swiss (%)
Ancestries Reported - Ukrainian (%)
Ancestries Reported - United States (%)
Ancestries Reported - Welsh (%)
Ancestries Reported - West Indian (%)
Ancestries Reported - Other (%)
Geographical mobility - Same house 1 year ago (%)
Geographical mobility - Same house 1 year ago (%) - White
Geographical mobility - Same house 1 year ago (%) - Black or African American
Geographical mobility - Same house 1 year ago (%) - Asian
Geographical mobility - Same house 1 year ago (%) - Hispanic or Latino
Geographical mobility - Same house 1 year ago (%) - American Indian and Alaska Native
Geographical mobility - Same house 1 year ago (%) - Multirace
Geographical mobility - Same house 1 year ago (%) - Other Race
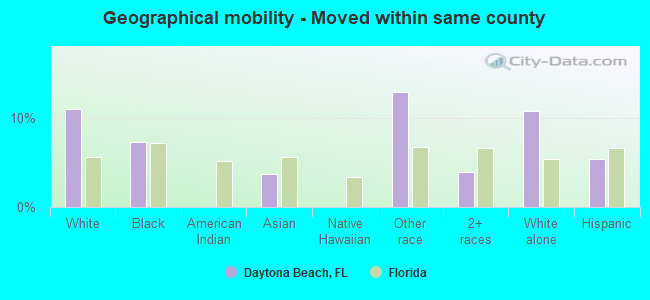
Geographical mobility - Moved within same county (%)
Geographical mobility - Moved within same county (%) - White
Geographical mobility - Moved within same county (%) - Black or African American
Geographical mobility - Moved within same county (%) - Asian
Geographical mobility - Moved within same county (%) - Hispanic or Latino
Geographical mobility - Moved within same county (%) - American Indian and Alaska Native
Geographical mobility - Moved within same county (%) - Multirace
Geographical mobility - Moved within same county (%) - Other Race
Geographical mobility - Moved from different county within same state (%)
Geographical mobility - Moved from different county within same state (%) - White
Geographical mobility - Moved from different county within same state (%) - Black or African American
Geographical mobility - Moved from different county within same state (%) - Asian
Geographical mobility - Moved from different county within same state (%) - Hispanic or Latino
Geographical mobility - Moved from different county within same state (%) - American Indian and Alaska Native
Geographical mobility - Moved from different county within same state (%) - Multirace
Geographical mobility - Moved from different county within same state (%) - Other Race
Geographical mobility - Moved from different state (%)
Geographical mobility - Moved from different state (%) - White
Geographical mobility - Moved from different state (%) - Black or African American
Geographical mobility - Moved from different state (%) - Asian
Geographical mobility - Moved from different state (%) - Hispanic or Latino
Geographical mobility - Moved from different state (%) - American Indian and Alaska Native
Geographical mobility - Moved from different state (%) - Multirace
Geographical mobility - Moved from different state (%) - Other Race
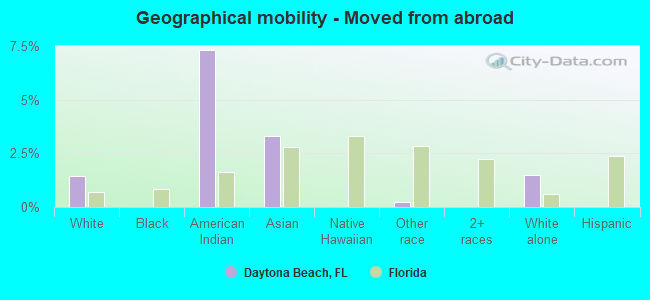
Geographical mobility - Moved from abroad (%)
Geographical mobility - Moved from abroad (%) - White
Geographical mobility - Moved from abroad (%) - Black or African American
Geographical mobility - Moved from abroad (%) - Asian
Geographical mobility - Moved from abroad (%) - Hispanic or Latino
Geographical mobility - Moved from abroad (%) - American Indian and Alaska Native
Geographical mobility - Moved from abroad (%) - Multirace
Geographical mobility - Moved from abroad (%) - Other Race
Place of birth for the foreign-born population - Ireland (%)
Place of birth for the foreign-born population - Denmark (%)
Place of birth for the foreign-born population - Norway (%)
Place of birth for the foreign-born population - Sweden (%)
Place of birth for the foreign-born population - United Kingdom (%)
Place of birth for the foreign-born population - England (%)
Place of birth for the foreign-born population - Scotland (%)
Place of birth for the foreign-born population - Other Northern Europe (%)
Place of birth for the foreign-born population - Austria (%)
Place of birth for the foreign-born population - Belgium (%)
Place of birth for the foreign-born population - France (%)
Place of birth for the foreign-born population - Germany (%)
Place of birth for the foreign-born population - Netherlands (%)
Place of birth for the foreign-born population - Switzerland (%)
Place of birth for the foreign-born population - Other Western Europe (%)
Place of birth for the foreign-born population - Greece (%)
Place of birth for the foreign-born population - Italy (%)
Place of birth for the foreign-born population - Portugal (%)
Place of birth for the foreign-born population - Spain (%)
Place of birth for the foreign-born population - Other Southern Europe (%)
Place of birth for the foreign-born population - Albania (%)
Place of birth for the foreign-born population - Belarus (%)
Place of birth for the foreign-born population - Bosnia and Herzegovina (%)
Place of birth for the foreign-born population - Bulgaria (%)
Place of birth for the foreign-born population - Croatia (%)
Place of birth for the foreign-born population - Czechoslovakia (%)
Place of birth for the foreign-born population - Hungary (%)
Place of birth for the foreign-born population - Latvia (%)
Place of birth for the foreign-born population - Lithuania (%)
Place of birth for the foreign-born population - North Macedonia (Macedonia) (%)
Place of birth for the foreign-born population - Moldova (%)
Place of birth for the foreign-born population - Poland (%)
Place of birth for the foreign-born population - Romania (%)
Place of birth for the foreign-born population - Russia (%)
Place of birth for the foreign-born population - Serbia (%)
Place of birth for the foreign-born population - Ukraine (%)
Place of birth for the foreign-born population - Other Eastern Europe (%)
Place of birth for the foreign-born population - China (%)
Place of birth for the foreign-born population - Hong Kong (%)
Place of birth for the foreign-born population - Taiwan (%)
Place of birth for the foreign-born population - Japan (%)
Place of birth for the foreign-born population - Korea (%)
Place of birth for the foreign-born population - Other Eastern Asia (%)
Place of birth for the foreign-born population - Afghanistan (%)
Place of birth for the foreign-born population - Bangladesh (%)
Place of birth for the foreign-born population - India (%)
Place of birth for the foreign-born population - Iran (%)
Place of birth for the foreign-born population - Kazakhstan (%)
Place of birth for the foreign-born population - Nepal (%)
Place of birth for the foreign-born population - Pakistan (%)
Place of birth for the foreign-born population - Sri Lanka (%)
Place of birth for the foreign-born population - Uzbekistan (%)
Place of birth for the foreign-born population - Other South Central Asia (%)
Place of birth for the foreign-born population - Burma (%)
Place of birth for the foreign-born population - Cambodia (%)
Place of birth for the foreign-born population - Indonesia (%)
Place of birth for the foreign-born population - Laos (%)
Place of birth for the foreign-born population - Malaysia (%)
Place of birth for the foreign-born population - Philippines (%)
Place of birth for the foreign-born population - Singapore (%)
Place of birth for the foreign-born population - Thailand (%)
Place of birth for the foreign-born population - Vietnam (%)
Place of birth for the foreign-born population - Other South Eastern Asia (%)
Place of birth for the foreign-born population - Armenia (%)
Place of birth for the foreign-born population - Iraq (%)
Place of birth for the foreign-born population - Israel (%)
Place of birth for the foreign-born population - Jordan (%)
Place of birth for the foreign-born population - Kuwait (%)
Place of birth for the foreign-born population - Lebanon (%)
Place of birth for the foreign-born population - Saudi Arabia (%)
Place of birth for the foreign-born population - Syria (%)
Place of birth for the foreign-born population - Turkey (%)
Place of birth for the foreign-born population - Yemen (%)
Place of birth for the foreign-born population - Other Western Asia (%)
Place of birth for the foreign-born population - Eritrea (%)
Place of birth for the foreign-born population - Ethiopia (%)
Place of birth for the foreign-born population - Kenya (%)
Place of birth for the foreign-born population - Somalia (%)
Place of birth for the foreign-born population - Uganda (%)
Place of birth for the foreign-born population - Zimbabwe (%)
Place of birth for the foreign-born population - Other Eastern Africa (%)
Place of birth for the foreign-born population - Cameroon (%)
Place of birth for the foreign-born population - Congo (%)
Place of birth for the foreign-born population - Democratic Republic of Congo (Zaire) (%)
Place of birth for the foreign-born population - Other Middle Africa (%)
Place of birth for the foreign-born population - Egypt (%)
Place of birth for the foreign-born population - Morocco (%)
Place of birth for the foreign-born population - Sudan (%)
Place of birth for the foreign-born population - Other Northern Africa (%)
Place of birth for the foreign-born population - South Africa (%)
Place of birth for the foreign-born population - Other Southern Africa (%)
Place of birth for the foreign-born population - Cabo Verde (%)
Place of birth for the foreign-born population - Ghana (%)
Place of birth for the foreign-born population - Liberia (%)
Place of birth for the foreign-born population - Nigeria (%)
Place of birth for the foreign-born population - Senegal (%)
Place of birth for the foreign-born population - Sierra Leone (%)
Place of birth for the foreign-born population - Other Western Africa (%)
Place of birth for the foreign-born population - Australia (%)
Place of birth for the foreign-born population - New Zealand (%)
Place of birth for the foreign-born population - Fiji (%)
Place of birth for the foreign-born population - Micronesia (%)
Place of birth for the foreign-born population - Bahamas (%)
Place of birth for the foreign-born population - Barbados (%)
Place of birth for the foreign-born population - Cuba (%)
Place of birth for the foreign-born population - Dominica (%)
Place of birth for the foreign-born population - Dominican Republic (%)
Place of birth for the foreign-born population - Grenada (%)
Place of birth for the foreign-born population - Haiti (%)
Place of birth for the foreign-born population - Jamaica (%)
Place of birth for the foreign-born population - St. Vincent and the Grenadines (%)
Place of birth for the foreign-born population - Trinidad and Tobago (%)
Place of birth for the foreign-born population - West Indies (%)
Place of birth for the foreign-born population - Other Caribbean (%)
Place of birth for the foreign-born population - Belize (%)
Place of birth for the foreign-born population - Costa Rica (%)
Place of birth for the foreign-born population - El Salvador (%)
Place of birth for the foreign-born population - Guatemala (%)
Place of birth for the foreign-born population - Honduras (%)
Place of birth for the foreign-born population - Mexico (%)
Place of birth for the foreign-born population - Nicaragua (%)
Place of birth for the foreign-born population - Panama (%)
Place of birth for the foreign-born population - Other Central America (%)
Place of birth for the foreign-born population - Argentina (%)
Place of birth for the foreign-born population - Bolivia (%)
Place of birth for the foreign-born population - Brazil (%)
Place of birth for the foreign-born population - Chile (%)
Place of birth for the foreign-born population - Colombia (%)
Place of birth for the foreign-born population - Ecuador (%)
Place of birth for the foreign-born population - Guyana (%)
Place of birth for the foreign-born population - Peru (%)
Place of birth for the foreign-born population - Uruguay (%)
Place of birth for the foreign-born population - Venezuela (%)
Place of birth for the foreign-born population - Other South America (%)
Place of birth for the foreign-born population - Canada (%)
Place of birth for the foreign-born population - Other Northern America (%)
Place of birth for the foreign-born population - Other (%)
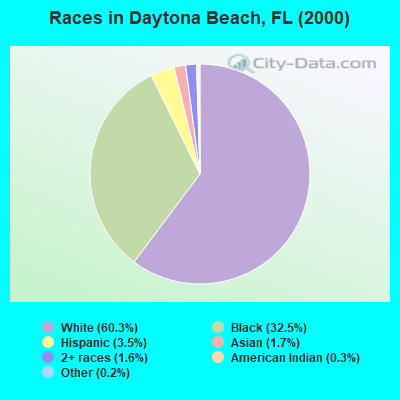
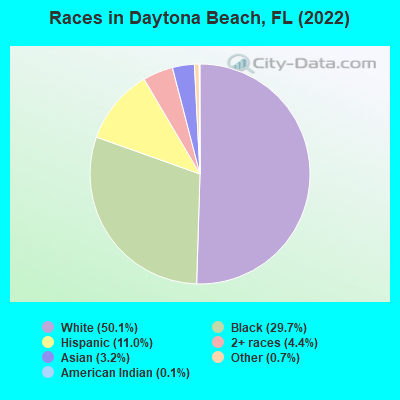
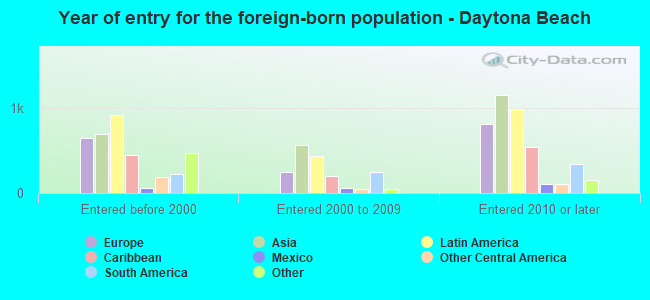
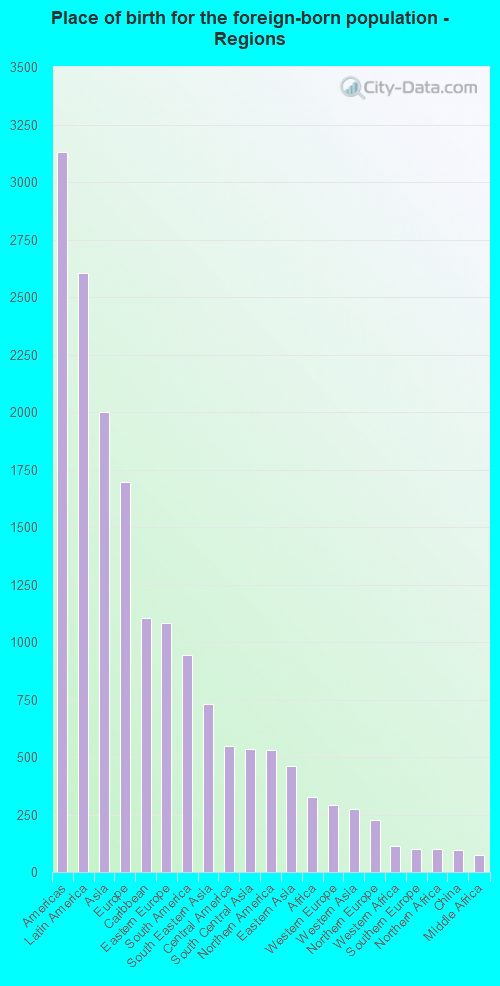
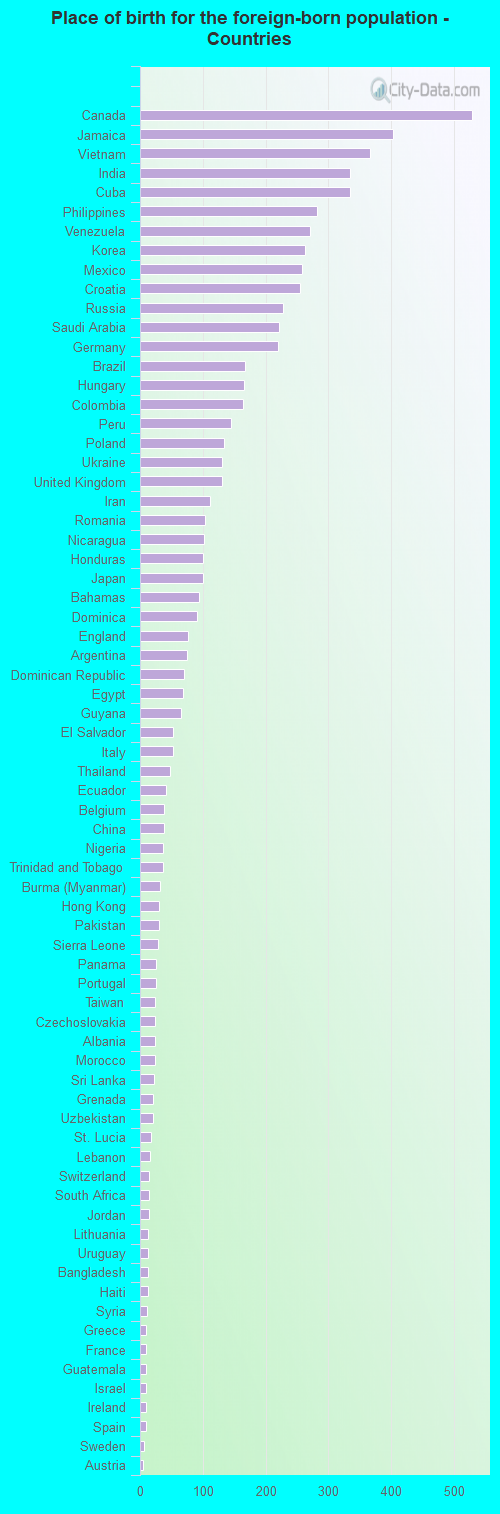
According to 2022 data, the most numerous races in Daytona Beach, FL are White alone (38,129 residents), Hispanic (8,353 residents), and Black alone (22,551 residents). 85.2% of Daytona Beach residents speak English at home. 9.4% of Daytona Beach, FL residents are foreign-born (3.4% born in Latin America, 2.6% born in Asia, 2.2% born in Europe), which is 122.8% less than the foreign-born rate of 21.0% across the entire state of Florida.
Race distribution in Daytona Beach
2000 2022
10,458,509 65.4% White alone 2,682,715 16.8% Hispanic 2,264,268 14.2% Black alone 261,693 1.6% Asian alone 236,954 1.5% Two or more races 42,358 0.3% American Indian alone 28,994 0.2% Other race alone 6,887 0.04% Native Hawaiian and Other
11,309,403 50.8% White alone 6,025,039 27.1% Hispanic 3,241,015 14.6% Black alone 861,630 3.9% Two or more races 623,692 2.8% Asian alone 152,054 0.7% Other race alone 22,504 0.1% American Indian alone 9,486 0.04% Native Hawaiian and Other
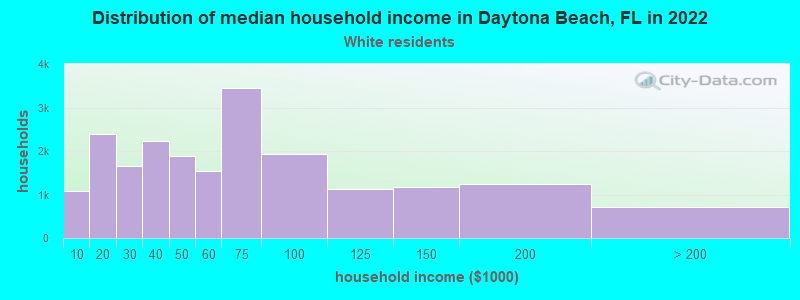
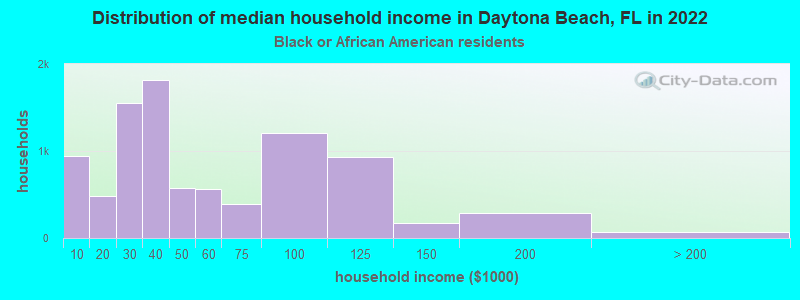
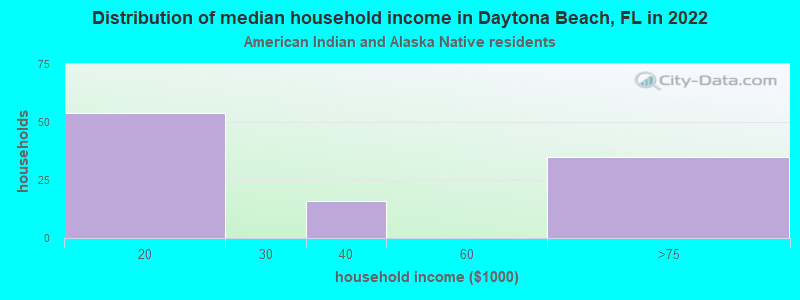
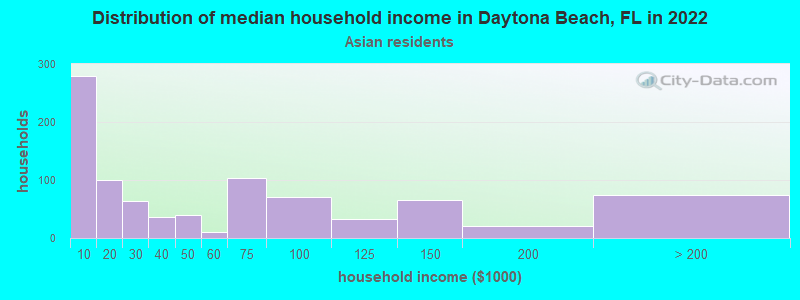
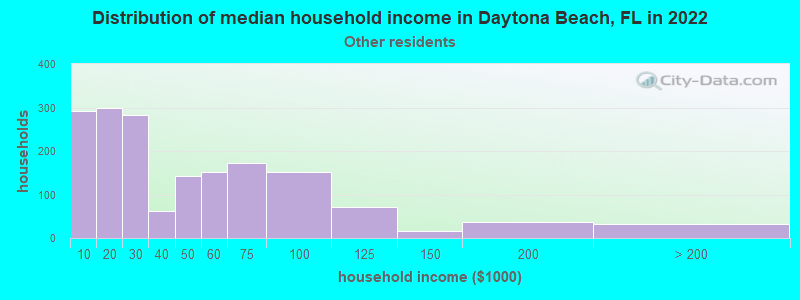
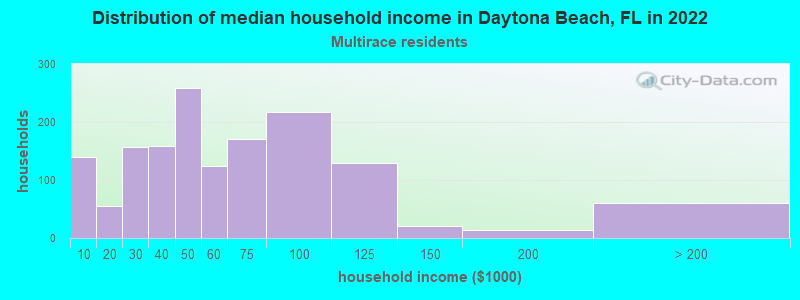
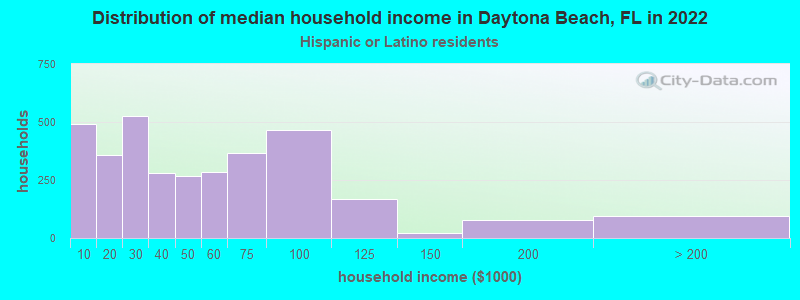
Income and house value in Daytona Beach Median household income in 2022 $54,333 White non-Hispanic householders$36,640 Black householders$45,063 Some other race householders$75,035 Two or more races householders$62,248 Hispanic or Latino race householdersMedian 2022 house value $303,486 White Non-Hispanic householders$190,327 Black or African American householders$209,706 American Indian or Alaska Native householders $339,475 Asian householders$286,184 Some other race householders$285,491 Two or more races householders$291,028 Hispanic or Latino householders
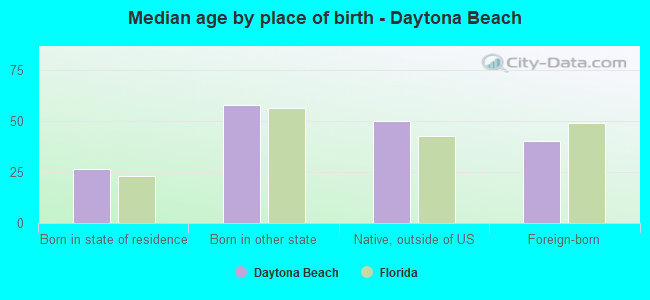
Median age by race in Daytona Beach
51.1 Median age for White residents51.2 50.8 35.9 Median age for Black or African American residents42.6 33.2 2.4 Median age for American Indian / Alaska Native residents0.0 2.4 34.2 Median age for Asian residents24.0 52.1 -666,666,666.0 Median age for Native Hawaiian / Pacific Islander residents-666,666,666.0 -666,666,666.0 35.4 Median age for Other race residents27.5 50.3 32.0 Median age for Two or more races residents40.5 25.7 51.5 Median age for White alone residents50.6 53.2 30.4 Median age for Hispanic or Latino residents30.4 30.5
Owner/renter occupied households by race in Daytona Beach
House owners and renters - White residents 11,704 57.3% Owner occupied8,713 42.7% Renter occupiedHouse owners and renters - Black or African American residents 3,042 33.8% Owner occupied5,951 66.2% Renter occupiedHouse owners and renters - American Indian / Alaska Native residents 76 83.2% Owner occupied15 16.8% Renter occupiedHouse owners and renters - Asian residents 691 59.5% Owner occupied471 40.5% Renter occupiedHouse owners and renters - Native Hawaiian / Pacific Islander residents 11 100.0% Renter occupiedHouse owners and renters - Other race residents 308 21.1% Owner occupied1,152 78.9% Renter occupiedHouse owners and renters - Two or more races residents 929 61.4% Owner occupied583 38.6% Renter occupiedHouse owners and renters - White alone residents 11,704 58.6% Owner occupied8,284 41.4% Renter occupiedHouse owners and renters - Hispanic or Latino residents 1,060 36.1% Owner occupied1,878 63.9% Renter occupied
Language usage in Daytona Beach
English speakers - Total 85.2% of residents of Daytona Beach speak English at home.
7.9% of residents speak Spanish at home 4,777 80.7% Speak English very well1,141 19.3% Speak English less than very well6.9% of residents speak other language at home 4,003 77.6% Speak English very well1,156 22.4% Speak English less than very well
English speakers - Born in the United States 95.4% of residents of Daytona Beach speak English at home.
2.8% of residents speak Spanish at home 977 100.0% Speak English very well1.8% of residents speak other language at home 621 100.0% Speak English very well
English speakers - Native, born elsewhere 27.3% of residents of Daytona Beach speak English at home.
66.7% of residents speak Spanish at home 1,220 77.4% Speak English very well356 22.6% Speak English less than very well6.0% of residents speak other language at home 141 100.0% Speak English very well
English speakers - Foreign-born 32.5% of residents of Daytona Beach speak English at home.
21.9% of residents speak Spanish at home 1,329 66.5% Speak English very well671 33.5% Speak English less than very well45.7% of residents speak other language at home 3,022 72.3% Speak English very well1,156 27.7% Speak English less than very well
White (Caucasian) - Speak only English Native:
96.7% (35,822)Foreign-born:
35.0% (1,088)
White (Caucasian) - Speak another language Native:
3.3% (1,225)Foreign-born:
65.0% (2,024)
Black or African American - Speak only English Native:
96.7% (20,499)Foreign-born:
77.7% (580)
Black or African American - Speak another language Native:
2.9% (620)Foreign-born:
23.8% (178)
American Indian / Alaska Native - Speak another language Native:
56.0% (87)Foreign-born:
100.0% (65)
Asian - Speak only English Native:
100.0% (567)Foreign-born:
5.9% (154)
Native Hawaiian / Pacific Islander - Speak only English Native:
87.6% (12)Foreign-born:
100.0% (6)
Other race - Speak another language Native:
49.4% (1,856)Foreign-born:
100.0% (1,134)
Two or more races - Speak only English Native:
74.0% (3,342)Foreign-born:
9.7% (75)
Two or more races - Speak another language Native:
25.0% (1,128)Foreign-born:
92.6% (716)
White alone - Speak only English Native:
97.0% (35,545)Foreign-born:
43.7% (1,088)
White alone - Speak another language Native:
3.0% (1,104)Foreign-born:
56.3% (1,404)
Hispanic or Latino - Speak only English Native:
42.7% (2,630)Foreign-born:
2.7% (56)
Hispanic or Latino - Speak another language Native:
57.3% (3,530)Foreign-born:
97.3% (2,000)
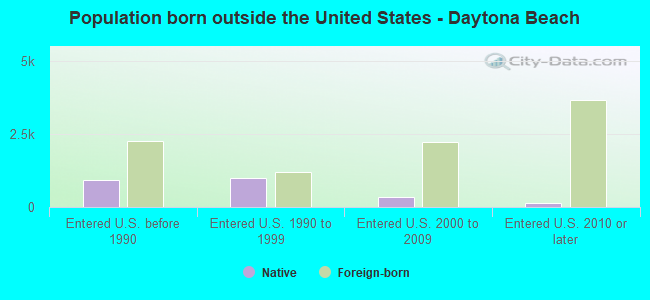
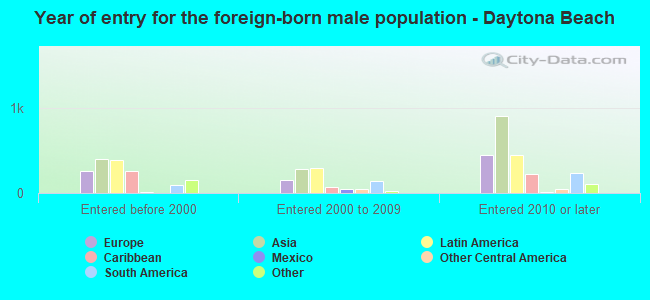
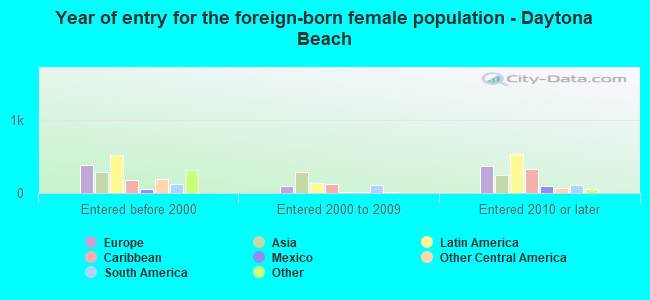
Foreign-born residents in Daytona Beach 7,167 residents are foreign born (3.4% Latin America , 2.6% Asia , 2.2% Europe ).
This city:
9.4%Florida:
21.1%
Marital status for residents in Daytona Beach Marital status - White (Caucasian) population 15 years and over
Males 43.2% Never married35.6% Now married0.4% Separated4.0% Widowed16.8% DivorcedFemales 31.7% Never married34.9% Now married0.8% Separated9.7% Widowed23.0% DivorcedWomen who gave birth in the past 12 months Now married:
87.0% (116)Unmarried:
13.0% (17)
Women who did not give birth in the past 12 months Now married:
34.1% (2,467)Unmarried:
65.9% (4,777)
Marital status - Black or African American population 15 years and over
Males 48.9% Never married26.9% Now married1.9% Separated2.8% Widowed19.5% DivorcedFemales 58.0% Never married23.9% Now married2.8% Separated4.8% Widowed10.5% DivorcedWomen who gave birth in the past 12 months Now married:
17.6% (57)Unmarried:
82.4% (264)
Women who did not give birth in the past 12 months Now married:
15.6% (1,023)Unmarried:
84.4% (5,543)
Marital status - American Indian / Alaska Native population 15 years and over
Males 0.0% Never married62.5% Now married0.0% Separated0.0% Widowed37.5% DivorcedFemales 37.6% Never married62.4% Now married0.0% Separated0.0% Widowed0.0% DivorcedWomen who gave birth in the past 12 months Now married:
100.0% (33)Unmarried:
0.0% (0)
Women who did not give birth in the past 12 months Now married:
0.0% (0)Unmarried:
100.0% (67)
Marital status - Asian population 15 years and over
Males 55.0% Never married41.5% Now married0.4% Separated2.5% Widowed0.6% DivorcedFemales 26.4% Never married54.4% Now married2.4% Separated12.2% Widowed4.6% DivorcedWomen who did not give birth in the past 12 months Now married:
49.4% (204)Unmarried:
50.6% (209)
Marital status - Other race population 15 years and over
Males 54.5% Never married19.7% Now married7.9% Separated0.6% Widowed17.3% DivorcedFemales 55.8% Never married24.6% Now married4.8% Separated9.4% Widowed5.5% DivorcedWomen who gave birth in the past 12 months Now married:
0.0% (0)Unmarried:
100.0% (59)
Women who did not give birth in the past 12 months Now married:
31.2% (411)Unmarried:
68.8% (905)
Marital status - Two or more races population 15 years and over
Males 15.0% Never married64.4% Now married0.0% Separated2.7% Widowed17.9% DivorcedFemales 59.1% Never married23.6% Now married1.5% Separated4.0% Widowed11.8% DivorcedWomen who gave birth in the past 12 months Now married:
0.0% (0)Unmarried:
100.0% (70)
Women who did not give birth in the past 12 months Now married:
23.3% (284)Unmarried:
76.7% (933)
Marital status - White alone, not Hispanic / Latino population 15 years and over
Males 43.8% Never married35.0% Now married0.5% Separated3.7% Widowed17.0% DivorcedFemales 30.3% Never married36.1% Now married0.8% Separated10.1% Widowed22.7% DivorcedWomen who gave birth in the past 12 months Now married:
84.5% (100)Unmarried:
15.5% (18)
Women who did not give birth in the past 12 months Now married:
34.5% (2,364)Unmarried:
65.5% (4,480)
Marital status - Hispanic or Latino population 15 years and over
Males 47.1% Never married38.3% Now married5.1% Separated1.3% Widowed8.2% DivorcedFemales 33.3% Never married40.6% Now married2.2% Separated8.1% Widowed15.9% DivorcedWomen who gave birth in the past 12 months Now married:
42.9% (47)Unmarried:
57.1% (63)
Women who did not give birth in the past 12 months Now married:
27.6% (606)Unmarried:
72.4% (1,586)
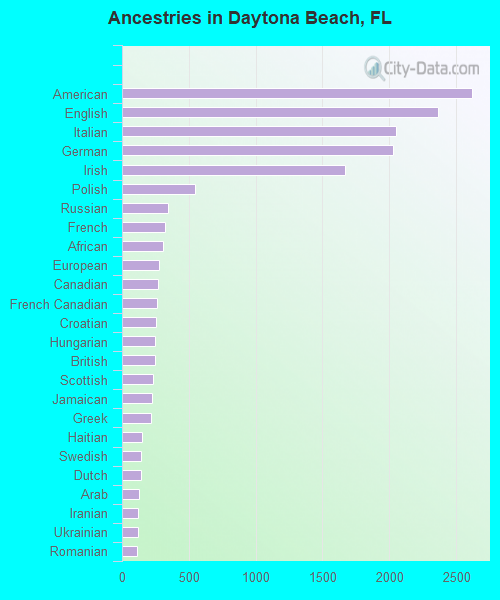
Ancestries in Daytona Beach
2,615 6.5% American2,361 5.9% English2,050 5.1% Italian2,024 5.0% German1,666 4.1% Irish543 1.4% Polish347 0.9% Russian319 0.8% French306 0.8% African276 0.7% European269 0.7% Canadian260 0.6% French Canadian252 0.6% Croatian249 0.6% Hungarian246 0.6% British235 0.6% Scottish225 0.6% Jamaican215 0.5% Greek151 0.4% Haitian145 0.4% Swedish140 0.3% Dutch124 0.3% Arab123 0.3% Iranian120 0.3% Ukrainian110 0.3% Romanian98 0.2% Norwegian97 0.2% Portuguese96 0.2% Brazilian93 0.2% Welsh89 0.2% Scotch-Irish87 0.2% Scandinavian74 0.2% Slavic68 0.2% Eastern European64 0.2% Northern European63 0.2% Swiss62 0.2% Guyanese58 0.1% British West Indian52 0.1% Serbian48 0.1% Pennsylvania German43 0.1% West Indian42 0.1% Czech39 0.10% Moroccan39 0.10% Lebanese39 0.10% Egyptian37 0.09% Danish35 0.09% Belizean32 0.08% Barbadian24 0.06% Lithuanian20 0.05% Albanian18 0.04% Slovene18 0.04% Nigerian13 0.03% Armenian10 0.02% Finnish10 0.02% Celtic10 0.02% Latvian8 0.02% Czechoslovakian8 0.02% Austrian8 0.02% Belgian6 0.01% Slovak
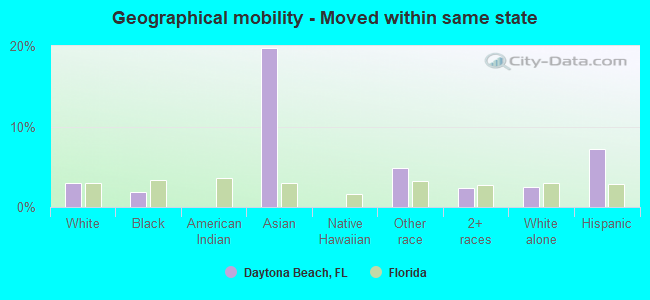
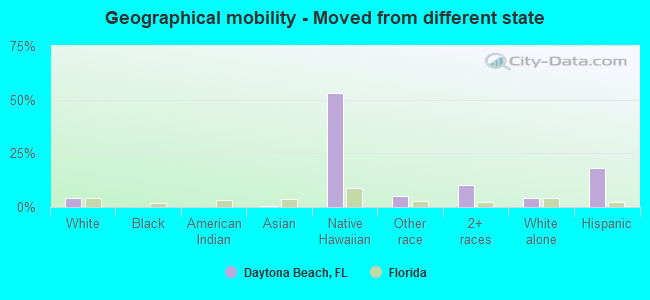
Geographical mobility in Daytona Beach Same house 1 year ago 33,229 80.5% White (Caucasian)21,183 90.8% Black or African American261 97.4% American Indian / Alaska Native1,853 74.4% Asian20 70.5% Native Hawaiian / Pacific Islander3,382 76.2% Other race4,743 85.6% Two or more races32,719 81.2% White alone, not Hispanic / Latino6,039 69.0% Hispanic or LatinoMoved within same county 4,541 11.0% White / Caucasian1,705 7.3% Black or African American92 3.7% Asian570 12.8% Other race218 3.9% Two or more races4,302 10.7% White alone, not Hispanic / Latino469 5.4% Hispanic or LatinoMoved within same state 1,233 3.0% White / Caucasian438 1.9% Black or African American493 19.8% Asian215 4.8% Other race132 2.4% Two or more races999 2.5% White alone, not Hispanic / Latino635 7.3% Hispanic or LatinoMoved from different state 1,694 4.1% White / Caucasian14 0.6% Asian15 53.2% Native Hawaiian / Pacific Islander229 5.2% Other race555 10.0% Two or more races1,659 4.1% White alone, not Hispanic / Latino1,606 18.4% Hispanic or LatinoMoved from abroad 597 1.4% White20 7.3% American Indian / Alaska Native82 3.3% Asian11 0.2% Other race597 1.5% White alone, not Hispanic / Latino
Children Nativity (place of birth) in Daytona Beach
Children under 6 years - Living with two parents Both parents native 888 100.0% NativeBoth parents foreign-born 33 61.8% Native20 38.2% Foreign-bornOne native, one foreign-born parent 204 100.0% NativeChildren under 6 years - Living with one parent Native parent 2,257 100.0% NativeForeign-born parent 52 49.6% Native53 50.4% Foreign-bornChildren 6 to 17 years - Living with two parents Both parents native 1,665 99.3% Native12 0.7% Foreign-bornBoth parents foreign-born 309 77.4% Native90 22.6% Foreign-bornOne native, one foreign-born parent 242 100.0% NativeChildren 6 to 17 years - Living with one parent Native parent 4,508 100.0% NativeForeign-born parent 99 55.4% Native80 44.6% Foreign-born
Grandparents responsible for own grandchildren in Daytona Beach
Grandparents (30 to 59 years) White / Caucasian 62 70.4% Responsible for grandchildren26 29.6% Not responsible for grandchildrenBlack or African American 95 91.4% Responsible for grandchildren9 8.6% Not responsible for grandchildrenOther race 13 100.0% Responsible for grandchildrenWhite alone, not Hispanic / Latino 64 69.0% Responsible for grandchildren29 31.0% Not responsible for grandchildrenHispanic or Latino 4 100.0% Responsible for grandchildrenGrandparents (60 years and over) White / Caucasian 82 29.9% Responsible for grandchildren192 70.1% Not responsible for grandchildrenBlack or African American 30 14.3% Responsible for grandchildren178 85.7% Not responsible for grandchildrenOther race 50 100.0% Not responsible for grandchildrenWhite alone, not Hispanic / Latino 81 37.4% Responsible for grandchildren136 62.6% Not responsible for grandchildrenHispanic or Latino 108 100.0% Not responsible for grandchildren