Races in Dover, Delaware (DE) Detailed Stats
Data:
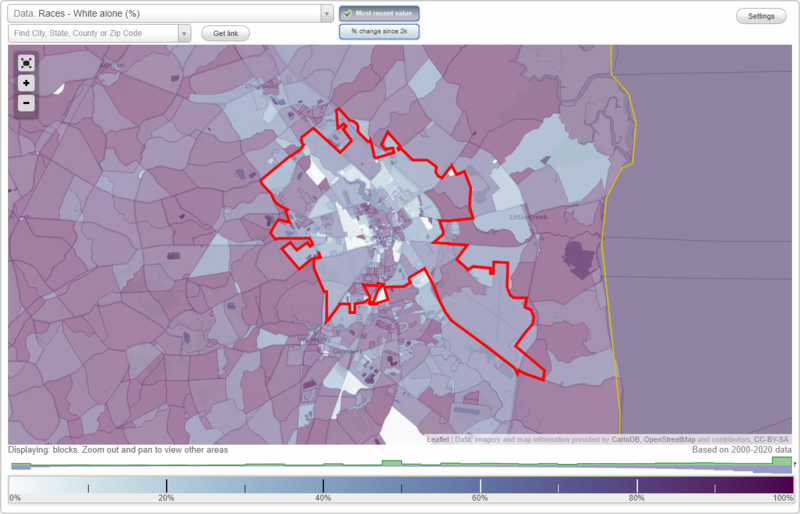
Races - White alone (%)
Races - White alone (% change since 2000)
Races - Black alone (%)
Races - Black alone (% change since 2000)
Races - American Indian alone (%)
Races - American Indian alone (% change since 2000)
Races - Asian alone (%)
Races - Asian alone (% change since 2000)
Races - Hispanic (%)
Races - Hispanic (% change since 2000)
Races - Native Hawaiian and Other Pacific Islander alone (%)
Races - Native Hawaiian and Other Pacific Islander alone (% change since 2000)
Races - Two or more races(%)
Races - Two or more races(% change since 2000)
Races - Other race alone (%)
Races - Other race alone (% change since 2000)
Racial diversity
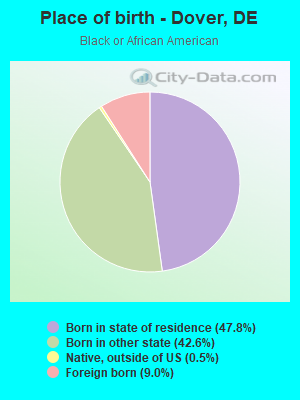
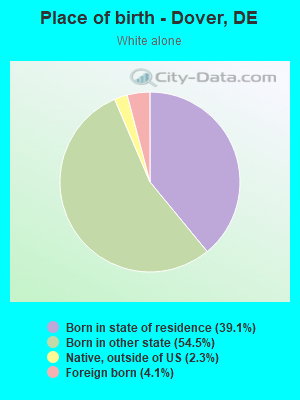
Place of birth - Born in state of residence (%)
Place of birth - Born in state of residence (%) - White
Place of birth - Born in state of residence (%) - Black or African American
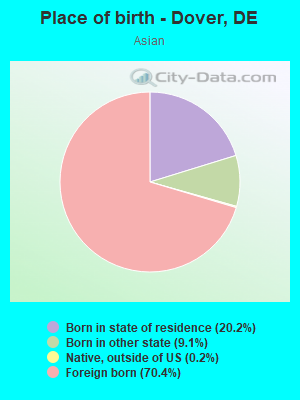
Place of birth - Born in state of residence (%) - Asian
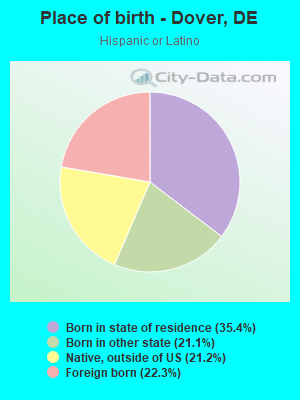
Place of birth - Born in state of residence (%) - Hispanic or Latino
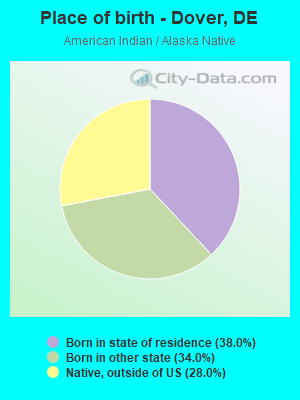
Place of birth - Born in state of residence (%) - American Indian and Alaska Native
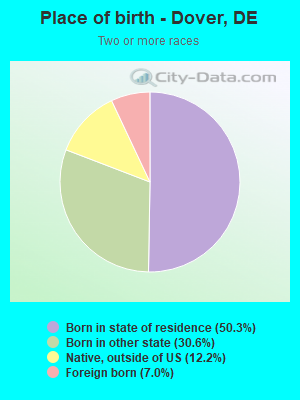
Place of birth - Born in state of residence (%) - Multirace
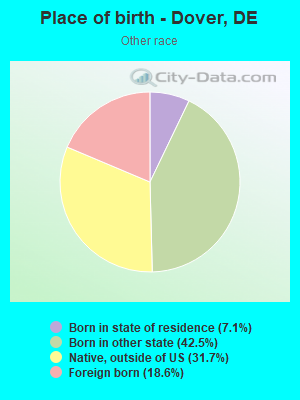
Place of birth - Born in state of residence (%) - Other Race
Place of birth - Born in other state (%)
Place of birth - Born in other state (%) - White
Place of birth - Born in other state (%) - Black or African American
Place of birth - Born in other state (%) - Asian
Place of birth - Born in other state (%) - Hispanic or Latino
Place of birth - Born in other state (%) - American Indian and Alaska Native
Place of birth - Born in other state (%) - Multirace
Place of birth - Born in other state (%) - Other Race
Place of birth - Native, outside of US (%)
Place of birth - Native, outside of US (%) - White
Place of birth - Native, outside of US (%) - Black or African American
Place of birth - Native, outside of US (%) - Asian
Place of birth - Native, outside of US (%) - Hispanic or Latino
Place of birth - Native, outside of US (%) - American Indian and Alaska Native
Place of birth - Native, outside of US (%) - Multirace
Place of birth - Native, outside of US (%) - Other Race
Place of birth - Foreign born (%)
Place of birth - Foreign born (%) - White
Place of birth - Foreign born (%) - Black or African American
Place of birth - Foreign born (%) - Asian
Place of birth - Foreign born (%) - Hispanic or Latino
Place of birth - Foreign born (%) - American Indian and Alaska Native
Place of birth - Foreign born (%) - Multirace
Place of birth - Foreign born (%) - Other Race
Residents speaking English at home (%)
Residents speaking English at home - Born in the United States (%)
Residents speaking English at home - Native, born elsewhere (%)
Residents speaking English at home - Foreign born (%)
Residents speaking Spanish at home (%)
Residents speaking Spanish at home - Born in the United States (%)
Residents speaking Spanish at home - Native, born elsewhere (%)
Residents speaking Spanish at home - Foreign born (%)
Residents speaking other language at home (%)
Residents speaking other language at home - Born in the United States (%)
Residents speaking other language at home - Native, born elsewhere (%)
Residents speaking other language at home - Foreign born (%)
Marital status - Never married (%)
Marital status - Now married (%)
Marital status - Separated (%)
Marital status - Widowed (%)
Marital status - Divorced (%)
Ancestries Reported - Arab (%)
Ancestries Reported - Czech (%)
Ancestries Reported - Danish (%)
Ancestries Reported - Dutch (%)
Ancestries Reported - English (%)
Ancestries Reported - French (%)
Ancestries Reported - French Canadian (%)
Ancestries Reported - German (%)
Ancestries Reported - Greek (%)
Ancestries Reported - Hungarian (%)
Ancestries Reported - Irish (%)
Ancestries Reported - Italian (%)
Ancestries Reported - Lithuanian (%)
Ancestries Reported - Norwegian (%)
Ancestries Reported - Polish (%)
Ancestries Reported - Portuguese (%)
Ancestries Reported - Russian (%)
Ancestries Reported - Scotch-Irish (%)
Ancestries Reported - Scottish (%)
Ancestries Reported - Slovak (%)
Ancestries Reported - Subsaharan African (%)
Ancestries Reported - Swedish (%)
Ancestries Reported - Swiss (%)
Ancestries Reported - Ukrainian (%)
Ancestries Reported - United States (%)
Ancestries Reported - Welsh (%)
Ancestries Reported - West Indian (%)
Ancestries Reported - Other (%)
Geographical mobility - Same house 1 year ago (%)
Geographical mobility - Same house 1 year ago (%) - White
Geographical mobility - Same house 1 year ago (%) - Black or African American
Geographical mobility - Same house 1 year ago (%) - Asian
Geographical mobility - Same house 1 year ago (%) - Hispanic or Latino
Geographical mobility - Same house 1 year ago (%) - American Indian and Alaska Native
Geographical mobility - Same house 1 year ago (%) - Multirace
Geographical mobility - Same house 1 year ago (%) - Other Race
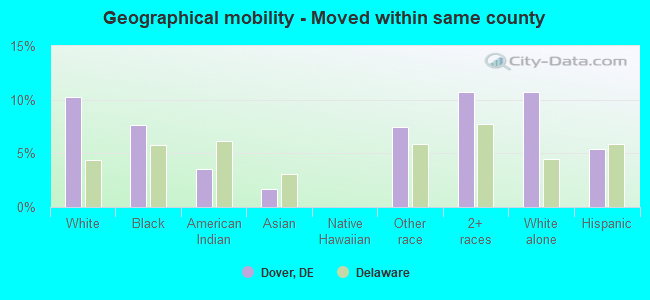
Geographical mobility - Moved within same county (%)
Geographical mobility - Moved within same county (%) - White
Geographical mobility - Moved within same county (%) - Black or African American
Geographical mobility - Moved within same county (%) - Asian
Geographical mobility - Moved within same county (%) - Hispanic or Latino
Geographical mobility - Moved within same county (%) - American Indian and Alaska Native
Geographical mobility - Moved within same county (%) - Multirace
Geographical mobility - Moved within same county (%) - Other Race
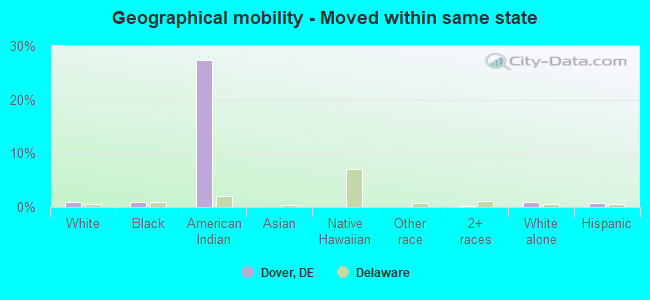
Geographical mobility - Moved from different county within same state (%)
Geographical mobility - Moved from different county within same state (%) - White
Geographical mobility - Moved from different county within same state (%) - Black or African American
Geographical mobility - Moved from different county within same state (%) - Asian
Geographical mobility - Moved from different county within same state (%) - Hispanic or Latino
Geographical mobility - Moved from different county within same state (%) - American Indian and Alaska Native
Geographical mobility - Moved from different county within same state (%) - Multirace
Geographical mobility - Moved from different county within same state (%) - Other Race
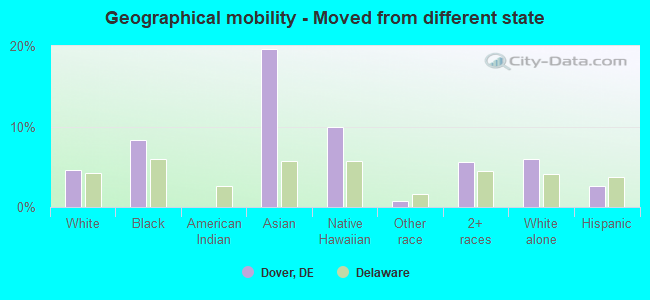
Geographical mobility - Moved from different state (%)
Geographical mobility - Moved from different state (%) - White
Geographical mobility - Moved from different state (%) - Black or African American
Geographical mobility - Moved from different state (%) - Asian
Geographical mobility - Moved from different state (%) - Hispanic or Latino
Geographical mobility - Moved from different state (%) - American Indian and Alaska Native
Geographical mobility - Moved from different state (%) - Multirace
Geographical mobility - Moved from different state (%) - Other Race
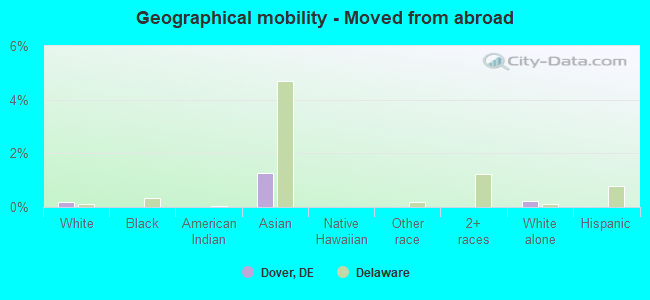
Geographical mobility - Moved from abroad (%)
Geographical mobility - Moved from abroad (%) - White
Geographical mobility - Moved from abroad (%) - Black or African American
Geographical mobility - Moved from abroad (%) - Asian
Geographical mobility - Moved from abroad (%) - Hispanic or Latino
Geographical mobility - Moved from abroad (%) - American Indian and Alaska Native
Geographical mobility - Moved from abroad (%) - Multirace
Geographical mobility - Moved from abroad (%) - Other Race
Place of birth for the foreign-born population - Ireland (%)
Place of birth for the foreign-born population - Denmark (%)
Place of birth for the foreign-born population - Norway (%)
Place of birth for the foreign-born population - Sweden (%)
Place of birth for the foreign-born population - United Kingdom (%)
Place of birth for the foreign-born population - England (%)
Place of birth for the foreign-born population - Scotland (%)
Place of birth for the foreign-born population - Other Northern Europe (%)
Place of birth for the foreign-born population - Austria (%)
Place of birth for the foreign-born population - Belgium (%)
Place of birth for the foreign-born population - France (%)
Place of birth for the foreign-born population - Germany (%)
Place of birth for the foreign-born population - Netherlands (%)
Place of birth for the foreign-born population - Switzerland (%)
Place of birth for the foreign-born population - Other Western Europe (%)
Place of birth for the foreign-born population - Greece (%)
Place of birth for the foreign-born population - Italy (%)
Place of birth for the foreign-born population - Portugal (%)
Place of birth for the foreign-born population - Spain (%)
Place of birth for the foreign-born population - Other Southern Europe (%)
Place of birth for the foreign-born population - Albania (%)
Place of birth for the foreign-born population - Belarus (%)
Place of birth for the foreign-born population - Bosnia and Herzegovina (%)
Place of birth for the foreign-born population - Bulgaria (%)
Place of birth for the foreign-born population - Croatia (%)
Place of birth for the foreign-born population - Czechoslovakia (%)
Place of birth for the foreign-born population - Hungary (%)
Place of birth for the foreign-born population - Latvia (%)
Place of birth for the foreign-born population - Lithuania (%)
Place of birth for the foreign-born population - North Macedonia (Macedonia) (%)
Place of birth for the foreign-born population - Moldova (%)
Place of birth for the foreign-born population - Poland (%)
Place of birth for the foreign-born population - Romania (%)
Place of birth for the foreign-born population - Russia (%)
Place of birth for the foreign-born population - Serbia (%)
Place of birth for the foreign-born population - Ukraine (%)
Place of birth for the foreign-born population - Other Eastern Europe (%)
Place of birth for the foreign-born population - China (%)
Place of birth for the foreign-born population - Hong Kong (%)
Place of birth for the foreign-born population - Taiwan (%)
Place of birth for the foreign-born population - Japan (%)
Place of birth for the foreign-born population - Korea (%)
Place of birth for the foreign-born population - Other Eastern Asia (%)
Place of birth for the foreign-born population - Afghanistan (%)
Place of birth for the foreign-born population - Bangladesh (%)
Place of birth for the foreign-born population - India (%)
Place of birth for the foreign-born population - Iran (%)
Place of birth for the foreign-born population - Kazakhstan (%)
Place of birth for the foreign-born population - Nepal (%)
Place of birth for the foreign-born population - Pakistan (%)
Place of birth for the foreign-born population - Sri Lanka (%)
Place of birth for the foreign-born population - Uzbekistan (%)
Place of birth for the foreign-born population - Other South Central Asia (%)
Place of birth for the foreign-born population - Burma (%)
Place of birth for the foreign-born population - Cambodia (%)
Place of birth for the foreign-born population - Indonesia (%)
Place of birth for the foreign-born population - Laos (%)
Place of birth for the foreign-born population - Malaysia (%)
Place of birth for the foreign-born population - Philippines (%)
Place of birth for the foreign-born population - Singapore (%)
Place of birth for the foreign-born population - Thailand (%)
Place of birth for the foreign-born population - Vietnam (%)
Place of birth for the foreign-born population - Other South Eastern Asia (%)
Place of birth for the foreign-born population - Armenia (%)
Place of birth for the foreign-born population - Iraq (%)
Place of birth for the foreign-born population - Israel (%)
Place of birth for the foreign-born population - Jordan (%)
Place of birth for the foreign-born population - Kuwait (%)
Place of birth for the foreign-born population - Lebanon (%)
Place of birth for the foreign-born population - Saudi Arabia (%)
Place of birth for the foreign-born population - Syria (%)
Place of birth for the foreign-born population - Turkey (%)
Place of birth for the foreign-born population - Yemen (%)
Place of birth for the foreign-born population - Other Western Asia (%)
Place of birth for the foreign-born population - Eritrea (%)
Place of birth for the foreign-born population - Ethiopia (%)
Place of birth for the foreign-born population - Kenya (%)
Place of birth for the foreign-born population - Somalia (%)
Place of birth for the foreign-born population - Uganda (%)
Place of birth for the foreign-born population - Zimbabwe (%)
Place of birth for the foreign-born population - Other Eastern Africa (%)
Place of birth for the foreign-born population - Cameroon (%)
Place of birth for the foreign-born population - Congo (%)
Place of birth for the foreign-born population - Democratic Republic of Congo (Zaire) (%)
Place of birth for the foreign-born population - Other Middle Africa (%)
Place of birth for the foreign-born population - Egypt (%)
Place of birth for the foreign-born population - Morocco (%)
Place of birth for the foreign-born population - Sudan (%)
Place of birth for the foreign-born population - Other Northern Africa (%)
Place of birth for the foreign-born population - South Africa (%)
Place of birth for the foreign-born population - Other Southern Africa (%)
Place of birth for the foreign-born population - Cabo Verde (%)
Place of birth for the foreign-born population - Ghana (%)
Place of birth for the foreign-born population - Liberia (%)
Place of birth for the foreign-born population - Nigeria (%)
Place of birth for the foreign-born population - Senegal (%)
Place of birth for the foreign-born population - Sierra Leone (%)
Place of birth for the foreign-born population - Other Western Africa (%)
Place of birth for the foreign-born population - Australia (%)
Place of birth for the foreign-born population - New Zealand (%)
Place of birth for the foreign-born population - Fiji (%)
Place of birth for the foreign-born population - Micronesia (%)
Place of birth for the foreign-born population - Bahamas (%)
Place of birth for the foreign-born population - Barbados (%)
Place of birth for the foreign-born population - Cuba (%)
Place of birth for the foreign-born population - Dominica (%)
Place of birth for the foreign-born population - Dominican Republic (%)
Place of birth for the foreign-born population - Grenada (%)
Place of birth for the foreign-born population - Haiti (%)
Place of birth for the foreign-born population - Jamaica (%)
Place of birth for the foreign-born population - St. Vincent and the Grenadines (%)
Place of birth for the foreign-born population - Trinidad and Tobago (%)
Place of birth for the foreign-born population - West Indies (%)
Place of birth for the foreign-born population - Other Caribbean (%)
Place of birth for the foreign-born population - Belize (%)
Place of birth for the foreign-born population - Costa Rica (%)
Place of birth for the foreign-born population - El Salvador (%)
Place of birth for the foreign-born population - Guatemala (%)
Place of birth for the foreign-born population - Honduras (%)
Place of birth for the foreign-born population - Mexico (%)
Place of birth for the foreign-born population - Nicaragua (%)
Place of birth for the foreign-born population - Panama (%)
Place of birth for the foreign-born population - Other Central America (%)
Place of birth for the foreign-born population - Argentina (%)
Place of birth for the foreign-born population - Bolivia (%)
Place of birth for the foreign-born population - Brazil (%)
Place of birth for the foreign-born population - Chile (%)
Place of birth for the foreign-born population - Colombia (%)
Place of birth for the foreign-born population - Ecuador (%)
Place of birth for the foreign-born population - Guyana (%)
Place of birth for the foreign-born population - Peru (%)
Place of birth for the foreign-born population - Uruguay (%)
Place of birth for the foreign-born population - Venezuela (%)
Place of birth for the foreign-born population - Other South America (%)
Place of birth for the foreign-born population - Canada (%)
Place of birth for the foreign-born population - Other Northern America (%)
Place of birth for the foreign-born population - Other (%)
Latest news about races in Dover, DE collected exclusively by city-data.com from local newspapers, TV, and radio stations
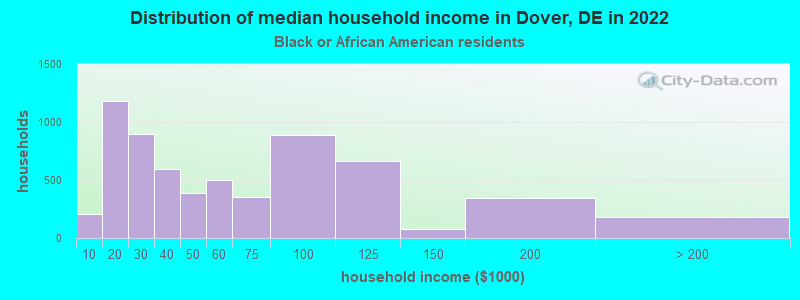
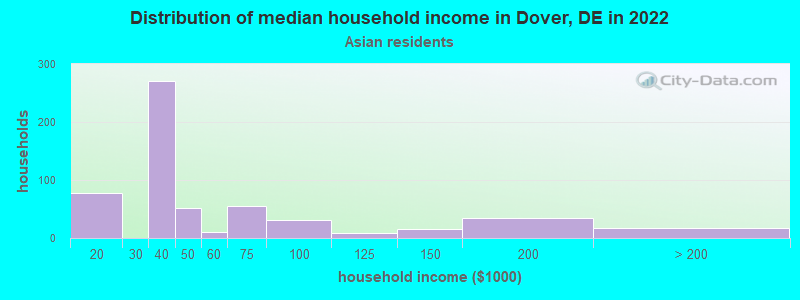
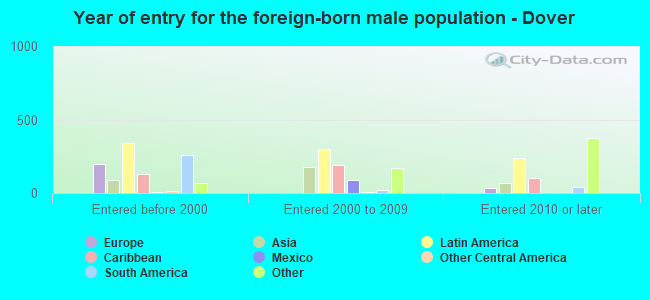
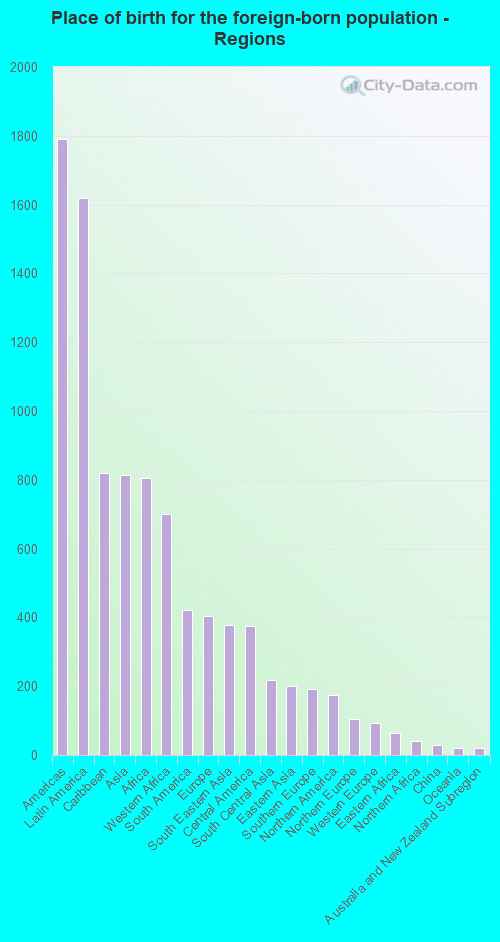
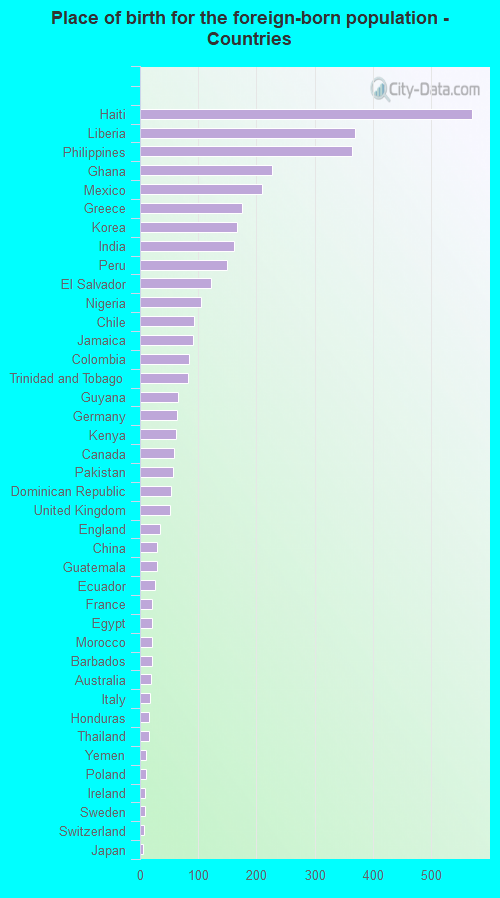
According to 2022 data, the most numerous races in Dover, DE are White alone (14,934 residents), Black alone (16,821 residents), and Hispanic (3,878 residents). 88.6% of Dover residents speak English at home. 9.6% of Dover, DE residents are foreign-born (4.1% born in Latin America, 2.1% born in Asia, 2.0% born in Africa, 1.0% born in Europe), which is 6.6% greater than the foreign-born rate of 9.0% across the entire state of Delaware.
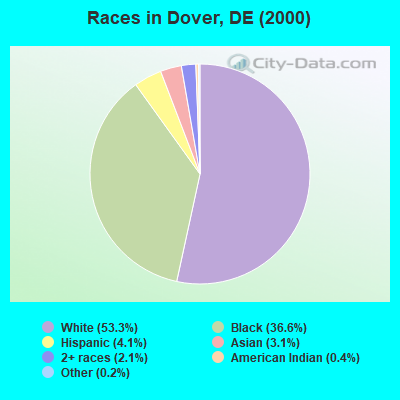
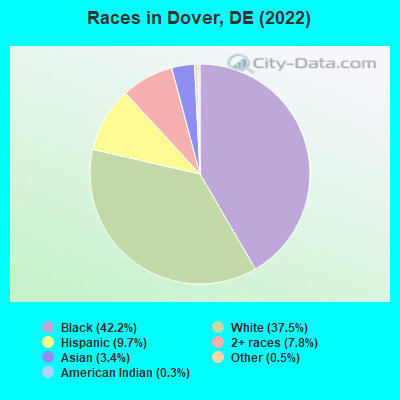
Race distribution in Dover
2000 2022
567,973 72.5% White alone 148,435 18.9% Black alone 37,277 4.8% Hispanic 16,110 2.1% Asian alone 10,222 1.3% Two or more races 2,324 0.3% American Indian alone 1,025 0.1% Other race alone 234 0.03% Native Hawaiian and Other
599,347 58.9% White alone 220,010 21.6% Black alone 105,300 10.3% Hispanic 46,016 4.5% Two or more races 41,350 4.1% Asian alone 5,097 0.5% Other race alone 1,276 0.1% American Indian alone
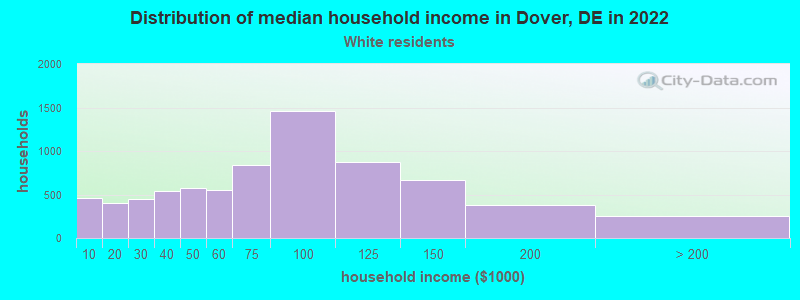
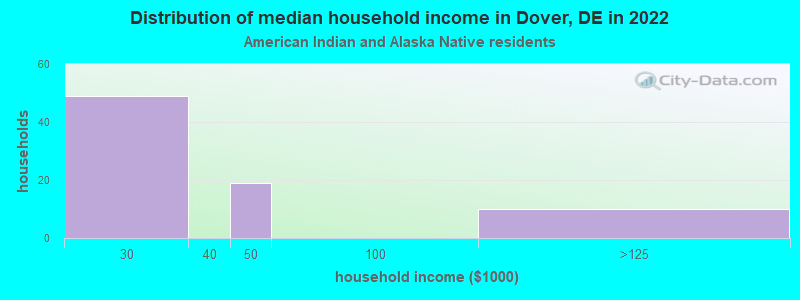
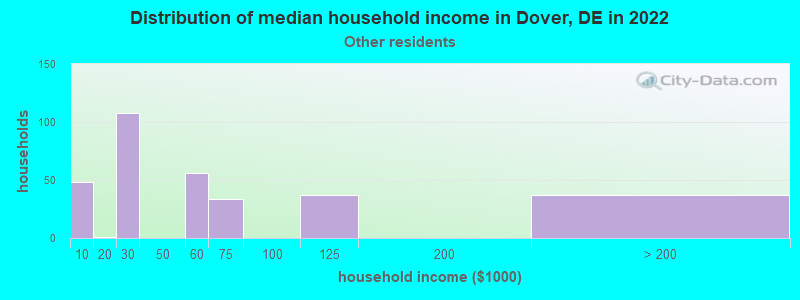
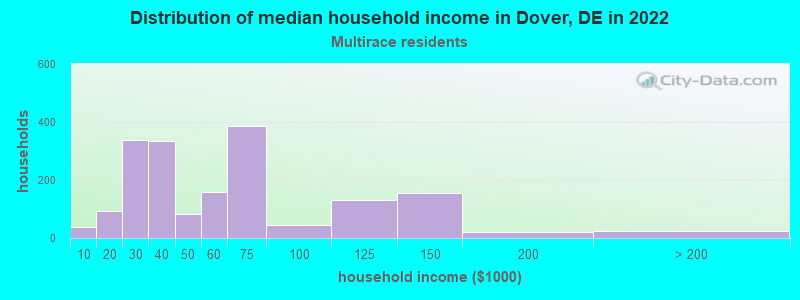
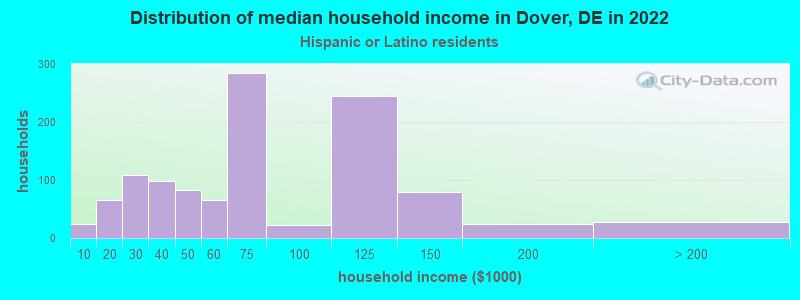
Income and house value in Dover Median household income in 2022 $70,758 White non-Hispanic householders$45,171 Black householders$32,552 American Indian and Alaska Native householders$33,535 Asian householders$57,038 Some other race householders$45,725 Two or more races householders$71,331 Hispanic or Latino race householdersMedian 2022 house value $264,965 White Non-Hispanic householders$243,431 Black or African American householders$185,850 American Indian or Alaska Native householders $276,903 Asian householders$246,708 Some other race householders$252,794 Two or more races householders$283,691 Hispanic or Latino householders
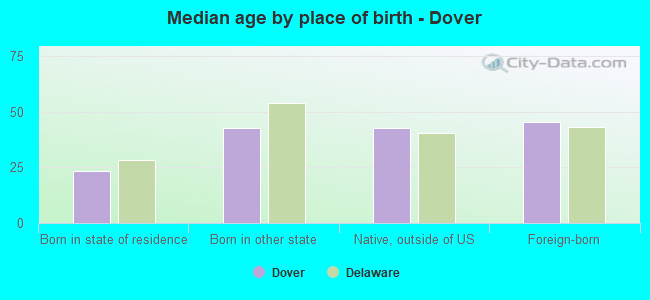
Median age by race in Dover
44.6 Median age for White residents41.9 46.4 28.1 Median age for Black or African American residents25.7 32.0 71.4 Median age for American Indian / Alaska Native residents78.9 65.7 32.9 Median age for Asian residents19.8 46.1 -666,666,666.0 Median age for Native Hawaiian / Pacific Islander residents-668,724,279.2 -666,666,666.0 47.2 Median age for Other race residents55.7 43.2 22.1 Median age for Two or more races residents21.9 22.9 45.5 Median age for White alone residents42.4 47.6 28.5 Median age for Hispanic or Latino residents28.8 27.6
Owner/renter occupied households by race in Dover
House owners and renters - White residents 4,576 63.8% Owner occupied2,594 36.2% Renter occupiedHouse owners and renters - Black or African American residents 2,600 43.9% Owner occupied3,320 56.1% Renter occupiedHouse owners and renters - American Indian / Alaska Native residents 20 26.0% Owner occupied58 74.0% Renter occupiedHouse owners and renters - Asian residents 217 37.6% Owner occupied360 62.4% Renter occupiedHouse owners and renters - Other race residents 166 69.5% Owner occupied73 30.5% Renter occupiedHouse owners and renters - Two or more races residents 945 45.2% Owner occupied1,145 54.8% Renter occupiedHouse owners and renters - White alone residents 4,325 62.3% Owner occupied2,622 37.7% Renter occupiedHouse owners and renters - Hispanic or Latino residents 996 76.2% Owner occupied312 23.8% Renter occupied
Language usage in Dover
English speakers - Total 88.6% of residents of Dover speak English at home.
5.9% of residents speak Spanish at home 1,438 64.1% Speak English very well805 35.9% Speak English less than very well5.5% of residents speak other language at home 1,177 56.3% Speak English very well914 43.7% Speak English less than very well
English speakers - Born in the United States 95.9% of residents of Dover speak English at home.
2.3% of residents speak Spanish at home 371 91.6% Speak English very well34 8.4% Speak English less than very well1.8% of residents speak other language at home 313 100.0% Speak English very well
English speakers - Native, born elsewhere 41.1% of residents of Dover speak English at home.
60.4% of residents speak Spanish at home 557 69.1% Speak English very well249 30.9% Speak English less than very well0.6% of residents speak other language at home 8 100.0% Speak English very well
English speakers - Foreign-born 43.5% of residents of Dover speak English at home.
18.1% of residents speak Spanish at home 365 48.5% Speak English very well387 51.5% Speak English less than very well39.3% of residents speak other language at home 740 45.4% Speak English very well890 54.6% Speak English less than very well
White (Caucasian) - Speak only English Native:
99.6% (14,158)Foreign-born:
50.3% (467)
White (Caucasian) - Speak another language Native:
1.7% (237)Foreign-born:
48.7% (452)
Black or African American - Speak only English Native:
96.9% (14,282)Foreign-born:
55.1% (885)
Black or African American - Speak another language Native:
3.0% (439)Foreign-born:
47.3% (759)
Asian - Speak only English Native:
27.1% (86)Foreign-born:
23.5% (219)
Asian - Speak another language Native:
73.9% (234)Foreign-born:
71.7% (670)
Other race - Speak only English Native:
47.9% (412)Foreign-born:
52.3% (183)
Other race - Speak another language Native:
52.6% (452)Foreign-born:
65.6% (230)
Two or more races - Speak only English Native:
78.2% (3,734)Foreign-born:
22.7% (89)
Two or more races - Speak another language Native:
21.1% (1,006)Foreign-born:
72.7% (285)
White alone - Speak only English Native:
99.9% (13,980)Foreign-born:
58.6% (357)
White alone - Speak another language Native:
1.0% (139)Foreign-born:
37.1% (226)
Hispanic or Latino - Speak only English Native:
53.9% (1,435)Foreign-born:
27.0% (234)
Hispanic or Latino - Speak another language Native:
46.1% (1,226)Foreign-born:
74.9% (650)
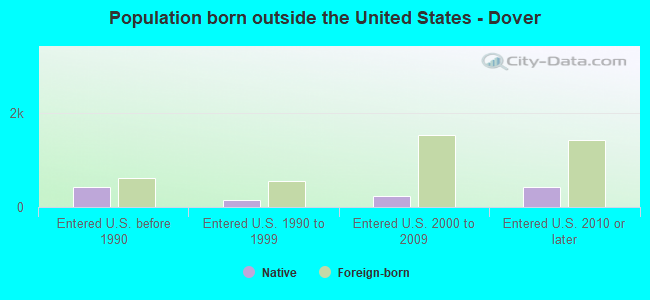
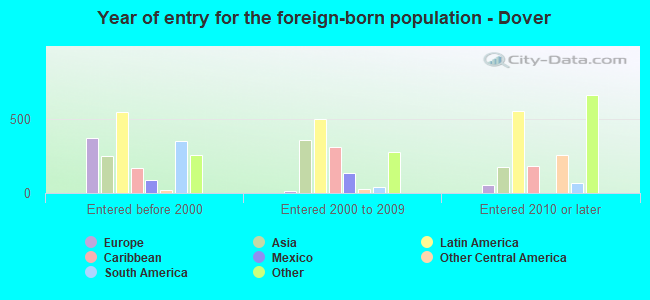
Foreign-born residents in Dover 3,839 residents are foreign born (4.1% Latin America , 2.1% Asia , 2.0% Africa , 1.0% Europe ).
This city:
9.6%Delaware:
9.8%
Marital status for residents in Dover Marital status - White (Caucasian) population 15 years and over
Males 42.2% Never married40.6% Now married2.9% Separated2.8% Widowed11.4% DivorcedFemales 30.2% Never married41.3% Now married1.5% Separated13.9% Widowed13.1% DivorcedWomen who gave birth in the past 12 months Now married:
62.0% (84)Unmarried:
38.0% (51)
Women who did not give birth in the past 12 months Now married:
36.3% (1,294)Unmarried:
63.7% (2,268)
Marital status - Black or African American population 15 years and over
Males 52.7% Never married32.2% Now married2.8% Separated2.1% Widowed10.3% DivorcedFemales 56.5% Never married20.9% Now married3.0% Separated8.8% Widowed10.7% DivorcedWomen who gave birth in the past 12 months Now married:
26.2% (38)Unmarried:
73.8% (107)
Women who did not give birth in the past 12 months Now married:
17.4% (901)Unmarried:
82.6% (4,276)
Marital status - American Indian / Alaska Native population 15 years and over
Males 0.0% Never married58.0% Now married0.0% Separated0.0% Widowed42.0% DivorcedFemales 79.1% Never married14.0% Now married0.0% Separated7.0% Widowed0.0% DivorcedWomen who did not give birth in the past 12 months Now married:
0.0% (0)Unmarried:
100.0% (34)
Marital status - Asian population 15 years and over
Males 59.2% Never married37.2% Now married0.0% Separated0.0% Widowed3.6% DivorcedFemales 16.9% Never married59.5% Now married0.0% Separated23.6% Widowed0.0% DivorcedWomen who did not give birth in the past 12 months Now married:
57.3% (138)Unmarried:
42.7% (103)
Marital status - Native Hawaiian / Pacific Islander population 15 years and over
Males 100.0% Never married0.0% Now married0.0% Separated0.0% Widowed0.0% DivorcedFemales 100.0% Never married0.0% Now married0.0% Separated0.0% Widowed0.0% DivorcedWomen who did not give birth in the past 12 months Now married:
0.0% (0)Unmarried:
100.0% (4)
Marital status - Other race population 15 years and over
Males 36.9% Never married63.1% Now married0.0% Separated0.0% Widowed0.0% DivorcedFemales 26.5% Never married8.1% Now married41.3% Separated8.3% Widowed15.8% DivorcedWomen who gave birth in the past 12 months Now married:
100.0% (24)Unmarried:
0.0% (0)
Women who did not give birth in the past 12 months Now married:
20.4% (54)Unmarried:
79.6% (210)
Marital status - Two or more races population 15 years and over
Males 69.3% Never married24.3% Now married2.3% Separated2.2% Widowed1.8% DivorcedFemales 55.0% Never married17.2% Now married12.7% Separated7.0% Widowed8.2% DivorcedWomen who gave birth in the past 12 months Now married:
41.2% (36)Unmarried:
58.8% (51)
Women who did not give birth in the past 12 months Now married:
27.1% (345)Unmarried:
72.9% (929)
Marital status - White alone, not Hispanic / Latino population 15 years and over
Males 42.4% Never married39.8% Now married3.0% Separated2.9% Widowed11.9% DivorcedFemales 28.0% Never married41.7% Now married1.6% Separated14.8% Widowed13.9% DivorcedWomen who gave birth in the past 12 months Now married:
62.0% (86)Unmarried:
38.0% (53)
Women who did not give birth in the past 12 months Now married:
36.4% (1,187)Unmarried:
63.6% (2,071)
Marital status - Hispanic or Latino population 15 years and over
Males 51.2% Never married48.8% Now married0.0% Separated0.0% Widowed0.0% DivorcedFemales 47.5% Never married24.4% Now married21.9% Separated3.7% Widowed2.4% DivorcedWomen who gave birth in the past 12 months Now married:
50.5% (49)Unmarried:
49.5% (48)
Women who did not give birth in the past 12 months Now married:
39.3% (457)Unmarried:
60.7% (705)
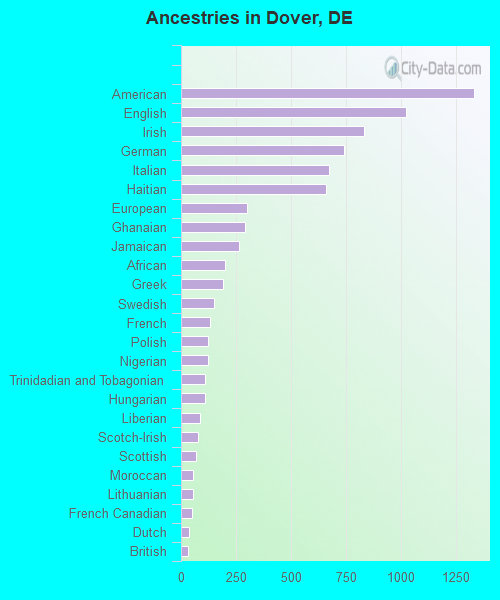
Ancestries in Dover
1,334 6.0% American1,021 4.6% English830 3.8% Irish740 3.4% German674 3.1% Italian661 3.0% Haitian302 1.4% European289 1.3% Ghanaian264 1.2% Jamaican199 0.9% African193 0.9% Greek150 0.7% Swedish132 0.6% French125 0.6% Polish122 0.6% Nigerian110 0.5% Trinidadian and Tobagonian110 0.5% Hungarian87 0.4% Liberian78 0.4% Scotch-Irish68 0.3% Scottish56 0.3% Moroccan56 0.3% Lithuanian50 0.2% French Canadian35 0.2% Dutch33 0.1% British32 0.1% Guyanese29 0.1% Yugoslavian27 0.1% Eastern European26 0.1% West Indian25 0.1% Canadian24 0.1% Austrian23 0.1% Czech21 0.10% Macedonian19 0.09% Norwegian19 0.09% Russian18 0.08% Barbadian17 0.08% Welsh15 0.07% Slovak14 0.06% Ukrainian8 0.04% Brazilian5 0.02% Northern European4 0.02% Israeli
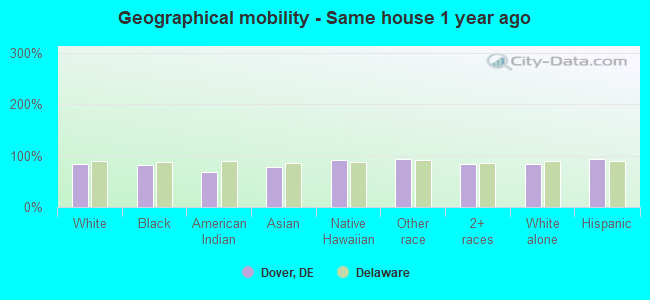
Geographical mobility in Dover Same house 1 year ago 13,022 84.7% White (Caucasian)14,083 81.8% Black or African American161 68.4% American Indian / Alaska Native1,000 78.2% Asian39 91.0% Native Hawaiian / Pacific Islander1,214 93.5% Other race4,658 84.4% Two or more races12,350 83.5% White alone, not Hispanic / Latino3,588 92.7% Hispanic or LatinoMoved within same county 1,577 10.3% White / Caucasian1,318 7.7% Black or African American8 3.6% American Indian / Alaska Native22 1.7% Asian96 7.4% Other race594 10.8% Two or more races1,592 10.8% White alone, not Hispanic / Latino209 5.4% Hispanic or LatinoMoved within same state 139 0.9% White / Caucasian172 1.0% Black or African American64 27.4% American Indian / Alaska Native11 0.2% Two or more races142 1.0% White alone, not Hispanic / Latino30 0.8% Hispanic or LatinoMoved from different state 703 4.6% White / Caucasian1,443 8.4% Black or African American251 19.6% Asian4 9.9% Native Hawaiian / Pacific Islander9 0.7% Other race307 5.6% Two or more races874 5.9% White alone, not Hispanic / Latino100 2.6% Hispanic or LatinoMoved from abroad 29 0.2% White2 0.0% Black or African American16 1.3% Asian35 0.2% White alone, not Hispanic / Latino
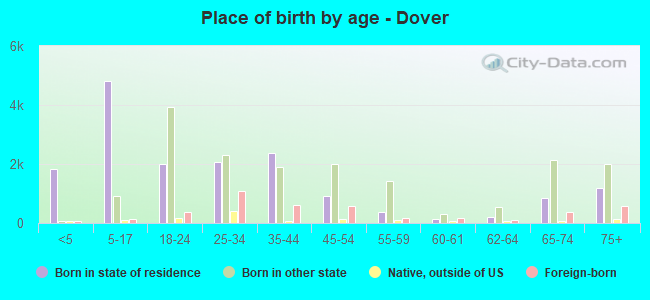
Children Nativity (place of birth) in Dover
Children under 6 years - Living with two parents Both parents native 433 100.0% NativeBoth parents foreign-born 171 100.0% NativeOne native, one foreign-born parent 95 100.0% NativeChildren under 6 years - Living with one parent Native parent 1,312 100.0% NativeForeign-born parent 29 100.0% NativeChildren 6 to 17 years - Living with two parents Both parents native 1,346 100.0% NativeBoth parents foreign-born 262 76.1% Native83 23.9% Foreign-bornOne native, one foreign-born parent 88 100.0% NativeChildren 6 to 17 years - Living with one parent Native parent 2,732 100.0% NativeForeign-born parent 307 54.3% Native259 45.7% Foreign-born
Grandparents responsible for own grandchildren in Dover
Grandparents (30 to 59 years) White / Caucasian 15 15.4% Responsible for grandchildren85 84.6% Not responsible for grandchildrenBlack or African American 137 45.3% Responsible for grandchildren166 54.7% Not responsible for grandchildrenAsian 13 100.0% Responsible for grandchildrenOther race 220 100.0% Responsible for grandchildrenTwo or more races 78 100.0% Responsible for grandchildrenWhite alone, not Hispanic / Latino 15 15.2% Responsible for grandchildren86 84.8% Not responsible for grandchildrenHispanic or Latino 293 100.0% Responsible for grandchildrenGrandparents (60 years and over) White / Caucasian 99 49.7% Responsible for grandchildren100 50.3% Not responsible for grandchildrenBlack or African American 198 55.8% Responsible for grandchildren157 44.2% Not responsible for grandchildrenTwo or more races 30 58.2% Responsible for grandchildren22 41.8% Not responsible for grandchildrenWhite alone, not Hispanic / Latino 99 49.6% Responsible for grandchildren101 50.4% Not responsible for grandchildren