Races in Echo Lake, Washington (WA) Detailed Stats
Ancestries, Foreign-born residents, place of birth

Recent posts about races in Echo Lake, Washington on our local forum with over 2,400,000 registered users:
 | Horse property close to town? (7 replies) |
| Cottages in the woods near Woodinville, WA (6 replies) |
| Commute times to Microsoft? (12 replies) |
| Woodinville (Harbor homes) or Issaquah highlands (14 replies) |
3.1% of Echo Lake, WA residents are foreign-born (1.5% born in Asia, 0.8% born in Latin America, 0.7% born in Africa), which is 389.8% less than the foreign-born rate of 15.0% across the entire state of Washington.
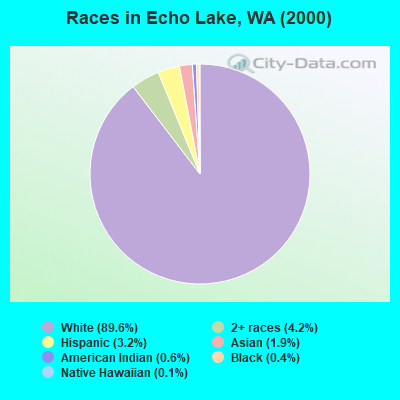
Race distribution in Echo Lake

- 76189.6%White alone
- 364.2%Two or more races
- 273.2%Hispanic
- 161.9%Asian alone
- 50.6%American Indian alone
- 30.4%Black alone
- 10.1%Native Hawaiian and Other
Pacific Islander alone
2000
2022
-
- 4,652,49078.9%White alone
- 441,5097.5%Hispanic
- 319,4015.4%Asian alone
- 184,6313.1%Black alone
- 175,9263.0%Two or more races
- 85,3961.4%American Indian alone
- 22,7790.4%Native Hawaiian and Other
Pacific Islander alone - 11,9890.2%Other race alone

-
- 4,941,45663.5%White alone
- 1,093,31314.0%Hispanic
- 755,8329.7%Asian alone
- 523,4486.7%Two or more races
- 299,5373.8%Black alone
- 69,0240.9%American Indian alone
- 52,2310.7%Native Hawaiian and Other
Pacific Islander alone - 50,9450.7%Other race alone

Income and house value in Echo Lake
- Median household income in 2022
- $130,069White non-Hispanic householders
- $110,068Two or more races householders
- Median 2022 house value
- $980,177White Non-Hispanic householders
Household income for White non-Hispanic householders

Household income for Two or more races householders

Foreign-born residents in Echo Lake
26 residents are foreign born (1.5% Asia, 0.8% Latin America, 0.7% Africa).
| This city: | 3.1% |
| Washington: | 10.4% |
Ancestries in Echo Lake

- 21820.6%German
- 17316.4%Other
- 15214.4%English
- 13913.2%Irish
- 736.9%Swedish
- 575.4%Norwegian
- 575.4%United States
- 403.8%Scotch-Irish
- 323.0%Danish
- 312.9%Dutch
- 242.3%Polish
- 201.9%Swiss
- 121.1%Welsh
- 100.9%Subsaharan African
- 70.7%Hungarian
- 60.6%French
- 50.5%Czech

Zip codes: 98296.