Races in Everett, Georgia (GA) Detailed Stats
Ancestries, Foreign-born residents, place of birth
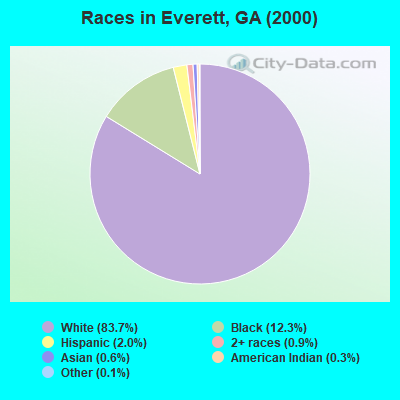
Race distribution in Everett

- 12,71183.7%White alone
- 1,87412.3%Black alone
- 2972.0%Hispanic
- 1420.9%Two or more races
- 880.6%Asian alone
- 480.3%American Indian alone
- 170.1%Other race alone
- 10.01%Native Hawaiian and Other
Pacific Islander alone
2000
2022
-
- 5,128,66162.6%White alone
- 2,331,46528.5%Black alone
- 435,2275.3%Hispanic
- 171,5132.1%Asian alone
- 87,3641.1%Two or more races
- 17,6700.2%American Indian alone
- 11,2750.1%Other race alone
- 3,2780.04%Native Hawaiian and Other
Pacific Islander alone

-
- 5,415,65749.6%White alone
- 3,349,24030.7%Black alone
- 1,132,60410.4%Hispanic
- 479,1564.4%Asian alone
- 462,9234.2%Two or more races
- 54,4160.5%Other race alone
- 11,9230.1%American Indian alone
- 6,9570.06%Native Hawaiian and Other
Pacific Islander alone

Income and house value in Everett
- Median household income in 2022
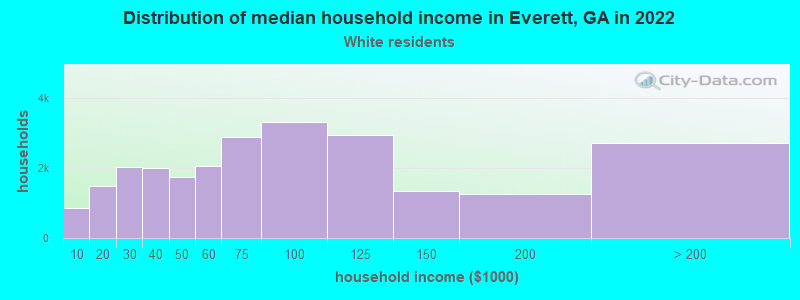
- $71,588White non-Hispanic householders
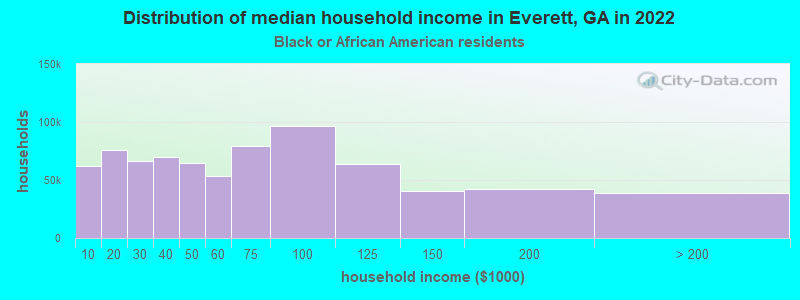
- $75,961Black householders
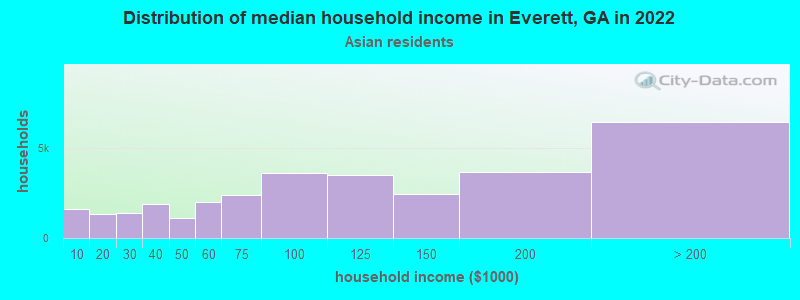
- $40,969Asian householders
- $90,538Some other race householders
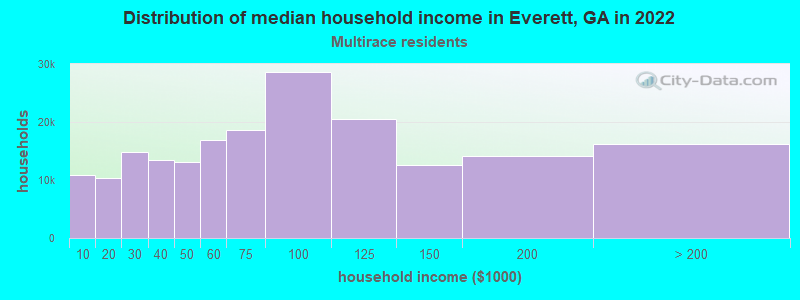
- $126,590Two or more races householders
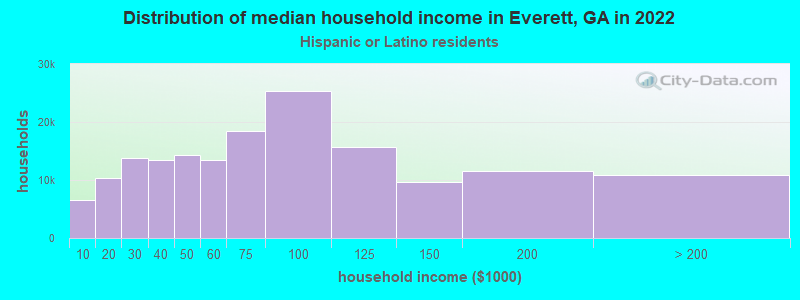
- $51,178Hispanic or Latino race householders
- Median 2022 house value
- $282,566White Non-Hispanic householders
- $241,733Black or African American householders
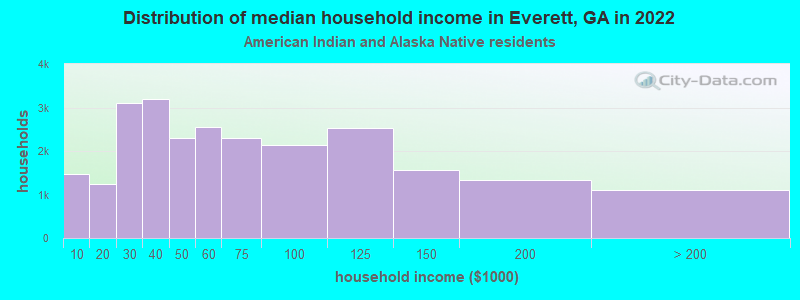
- $313,055American Indian or Alaska Native householders
- $204,166Asian householders
- $216,688Some other race householders
- $241,188Two or more races householders
- $362,872Hispanic or Latino householders
Household income for White non-Hispanic householders
Household income for Black householders
Household income for American Indian and Alaska Native householders
Household income for Asian householders
Household income for Two or more races householders
Household income for Hispanic or Latino race householders
Zip code: 31525