Races in Great Falls, Montana (MT) Detailed Stats
Data:
Races - White alone (%)
Races - White alone (% change since 2000)
Races - Black alone (%)
Races - Black alone (% change since 2000)
Races - American Indian alone (%)
Races - American Indian alone (% change since 2000)
Races - Asian alone (%)
Races - Asian alone (% change since 2000)
Races - Hispanic (%)
Races - Hispanic (% change since 2000)
Races - Native Hawaiian and Other Pacific Islander alone (%)
Races - Native Hawaiian and Other Pacific Islander alone (% change since 2000)
Races - Two or more races(%)
Races - Two or more races(% change since 2000)
Races - Other race alone (%)
Races - Other race alone (% change since 2000)
Racial diversity
Place of birth - Born in state of residence (%)
Place of birth - Born in state of residence (%) - White
Place of birth - Born in state of residence (%) - Black or African American
Place of birth - Born in state of residence (%) - Asian
Place of birth - Born in state of residence (%) - Hispanic or Latino
Place of birth - Born in state of residence (%) - American Indian and Alaska Native
Place of birth - Born in state of residence (%) - Multirace
Place of birth - Born in state of residence (%) - Other Race
Place of birth - Born in other state (%)
Place of birth - Born in other state (%) - White
Place of birth - Born in other state (%) - Black or African American
Place of birth - Born in other state (%) - Asian
Place of birth - Born in other state (%) - Hispanic or Latino
Place of birth - Born in other state (%) - American Indian and Alaska Native
Place of birth - Born in other state (%) - Multirace
Place of birth - Born in other state (%) - Other Race
Place of birth - Native, outside of US (%)
Place of birth - Native, outside of US (%) - White
Place of birth - Native, outside of US (%) - Black or African American
Place of birth - Native, outside of US (%) - Asian
Place of birth - Native, outside of US (%) - Hispanic or Latino
Place of birth - Native, outside of US (%) - American Indian and Alaska Native
Place of birth - Native, outside of US (%) - Multirace
Place of birth - Native, outside of US (%) - Other Race
Place of birth - Foreign born (%)
Place of birth - Foreign born (%) - White
Place of birth - Foreign born (%) - Black or African American
Place of birth - Foreign born (%) - Asian
Place of birth - Foreign born (%) - Hispanic or Latino
Place of birth - Foreign born (%) - American Indian and Alaska Native
Place of birth - Foreign born (%) - Multirace
Place of birth - Foreign born (%) - Other Race
Residents speaking English at home (%)
Residents speaking English at home - Born in the United States (%)
Residents speaking English at home - Native, born elsewhere (%)
Residents speaking English at home - Foreign born (%)
Residents speaking Spanish at home (%)
Residents speaking Spanish at home - Born in the United States (%)
Residents speaking Spanish at home - Native, born elsewhere (%)
Residents speaking Spanish at home - Foreign born (%)
Residents speaking other language at home (%)
Residents speaking other language at home - Born in the United States (%)
Residents speaking other language at home - Native, born elsewhere (%)
Residents speaking other language at home - Foreign born (%)
Marital status - Never married (%)
Marital status - Now married (%)
Marital status - Separated (%)
Marital status - Widowed (%)
Marital status - Divorced (%)
Ancestries Reported - Arab (%)
Ancestries Reported - Czech (%)
Ancestries Reported - Danish (%)
Ancestries Reported - Dutch (%)
Ancestries Reported - English (%)
Ancestries Reported - French (%)
Ancestries Reported - French Canadian (%)
Ancestries Reported - German (%)
Ancestries Reported - Greek (%)
Ancestries Reported - Hungarian (%)
Ancestries Reported - Irish (%)
Ancestries Reported - Italian (%)
Ancestries Reported - Lithuanian (%)
Ancestries Reported - Norwegian (%)
Ancestries Reported - Polish (%)
Ancestries Reported - Portuguese (%)
Ancestries Reported - Russian (%)
Ancestries Reported - Scotch-Irish (%)
Ancestries Reported - Scottish (%)
Ancestries Reported - Slovak (%)
Ancestries Reported - Subsaharan African (%)
Ancestries Reported - Swedish (%)
Ancestries Reported - Swiss (%)
Ancestries Reported - Ukrainian (%)
Ancestries Reported - United States (%)
Ancestries Reported - Welsh (%)
Ancestries Reported - West Indian (%)
Ancestries Reported - Other (%)
Geographical mobility - Same house 1 year ago (%)
Geographical mobility - Same house 1 year ago (%) - White
Geographical mobility - Same house 1 year ago (%) - Black or African American
Geographical mobility - Same house 1 year ago (%) - Asian
Geographical mobility - Same house 1 year ago (%) - Hispanic or Latino
Geographical mobility - Same house 1 year ago (%) - American Indian and Alaska Native
Geographical mobility - Same house 1 year ago (%) - Multirace
Geographical mobility - Same house 1 year ago (%) - Other Race
Geographical mobility - Moved within same county (%)
Geographical mobility - Moved within same county (%) - White
Geographical mobility - Moved within same county (%) - Black or African American
Geographical mobility - Moved within same county (%) - Asian
Geographical mobility - Moved within same county (%) - Hispanic or Latino
Geographical mobility - Moved within same county (%) - American Indian and Alaska Native
Geographical mobility - Moved within same county (%) - Multirace
Geographical mobility - Moved within same county (%) - Other Race
Geographical mobility - Moved from different county within same state (%)
Geographical mobility - Moved from different county within same state (%) - White
Geographical mobility - Moved from different county within same state (%) - Black or African American
Geographical mobility - Moved from different county within same state (%) - Asian
Geographical mobility - Moved from different county within same state (%) - Hispanic or Latino
Geographical mobility - Moved from different county within same state (%) - American Indian and Alaska Native
Geographical mobility - Moved from different county within same state (%) - Multirace
Geographical mobility - Moved from different county within same state (%) - Other Race
Geographical mobility - Moved from different state (%)
Geographical mobility - Moved from different state (%) - White
Geographical mobility - Moved from different state (%) - Black or African American
Geographical mobility - Moved from different state (%) - Asian
Geographical mobility - Moved from different state (%) - Hispanic or Latino
Geographical mobility - Moved from different state (%) - American Indian and Alaska Native
Geographical mobility - Moved from different state (%) - Multirace
Geographical mobility - Moved from different state (%) - Other Race
Geographical mobility - Moved from abroad (%)
Geographical mobility - Moved from abroad (%) - White
Geographical mobility - Moved from abroad (%) - Black or African American
Geographical mobility - Moved from abroad (%) - Asian
Geographical mobility - Moved from abroad (%) - Hispanic or Latino
Geographical mobility - Moved from abroad (%) - American Indian and Alaska Native
Geographical mobility - Moved from abroad (%) - Multirace
Geographical mobility - Moved from abroad (%) - Other Race
Place of birth for the foreign-born population - Ireland (%)
Place of birth for the foreign-born population - Denmark (%)
Place of birth for the foreign-born population - Norway (%)
Place of birth for the foreign-born population - Sweden (%)
Place of birth for the foreign-born population - United Kingdom (%)
Place of birth for the foreign-born population - England (%)
Place of birth for the foreign-born population - Scotland (%)
Place of birth for the foreign-born population - Other Northern Europe (%)
Place of birth for the foreign-born population - Austria (%)
Place of birth for the foreign-born population - Belgium (%)
Place of birth for the foreign-born population - France (%)
Place of birth for the foreign-born population - Germany (%)
Place of birth for the foreign-born population - Netherlands (%)
Place of birth for the foreign-born population - Switzerland (%)
Place of birth for the foreign-born population - Other Western Europe (%)
Place of birth for the foreign-born population - Greece (%)
Place of birth for the foreign-born population - Italy (%)
Place of birth for the foreign-born population - Portugal (%)
Place of birth for the foreign-born population - Spain (%)
Place of birth for the foreign-born population - Other Southern Europe (%)
Place of birth for the foreign-born population - Albania (%)
Place of birth for the foreign-born population - Belarus (%)
Place of birth for the foreign-born population - Bosnia and Herzegovina (%)
Place of birth for the foreign-born population - Bulgaria (%)
Place of birth for the foreign-born population - Croatia (%)
Place of birth for the foreign-born population - Czechoslovakia (%)
Place of birth for the foreign-born population - Hungary (%)
Place of birth for the foreign-born population - Latvia (%)
Place of birth for the foreign-born population - Lithuania (%)
Place of birth for the foreign-born population - North Macedonia (Macedonia) (%)
Place of birth for the foreign-born population - Moldova (%)
Place of birth for the foreign-born population - Poland (%)
Place of birth for the foreign-born population - Romania (%)
Place of birth for the foreign-born population - Russia (%)
Place of birth for the foreign-born population - Serbia (%)
Place of birth for the foreign-born population - Ukraine (%)
Place of birth for the foreign-born population - Other Eastern Europe (%)
Place of birth for the foreign-born population - China (%)
Place of birth for the foreign-born population - Hong Kong (%)
Place of birth for the foreign-born population - Taiwan (%)
Place of birth for the foreign-born population - Japan (%)
Place of birth for the foreign-born population - Korea (%)
Place of birth for the foreign-born population - Other Eastern Asia (%)
Place of birth for the foreign-born population - Afghanistan (%)
Place of birth for the foreign-born population - Bangladesh (%)
Place of birth for the foreign-born population - India (%)
Place of birth for the foreign-born population - Iran (%)
Place of birth for the foreign-born population - Kazakhstan (%)
Place of birth for the foreign-born population - Nepal (%)
Place of birth for the foreign-born population - Pakistan (%)
Place of birth for the foreign-born population - Sri Lanka (%)
Place of birth for the foreign-born population - Uzbekistan (%)
Place of birth for the foreign-born population - Other South Central Asia (%)
Place of birth for the foreign-born population - Burma (%)
Place of birth for the foreign-born population - Cambodia (%)
Place of birth for the foreign-born population - Indonesia (%)
Place of birth for the foreign-born population - Laos (%)
Place of birth for the foreign-born population - Malaysia (%)
Place of birth for the foreign-born population - Philippines (%)
Place of birth for the foreign-born population - Singapore (%)
Place of birth for the foreign-born population - Thailand (%)
Place of birth for the foreign-born population - Vietnam (%)
Place of birth for the foreign-born population - Other South Eastern Asia (%)
Place of birth for the foreign-born population - Armenia (%)
Place of birth for the foreign-born population - Iraq (%)
Place of birth for the foreign-born population - Israel (%)
Place of birth for the foreign-born population - Jordan (%)
Place of birth for the foreign-born population - Kuwait (%)
Place of birth for the foreign-born population - Lebanon (%)
Place of birth for the foreign-born population - Saudi Arabia (%)
Place of birth for the foreign-born population - Syria (%)
Place of birth for the foreign-born population - Turkey (%)
Place of birth for the foreign-born population - Yemen (%)
Place of birth for the foreign-born population - Other Western Asia (%)
Place of birth for the foreign-born population - Eritrea (%)
Place of birth for the foreign-born population - Ethiopia (%)
Place of birth for the foreign-born population - Kenya (%)
Place of birth for the foreign-born population - Somalia (%)
Place of birth for the foreign-born population - Uganda (%)
Place of birth for the foreign-born population - Zimbabwe (%)
Place of birth for the foreign-born population - Other Eastern Africa (%)
Place of birth for the foreign-born population - Cameroon (%)
Place of birth for the foreign-born population - Congo (%)
Place of birth for the foreign-born population - Democratic Republic of Congo (Zaire) (%)
Place of birth for the foreign-born population - Other Middle Africa (%)
Place of birth for the foreign-born population - Egypt (%)
Place of birth for the foreign-born population - Morocco (%)
Place of birth for the foreign-born population - Sudan (%)
Place of birth for the foreign-born population - Other Northern Africa (%)
Place of birth for the foreign-born population - South Africa (%)
Place of birth for the foreign-born population - Other Southern Africa (%)
Place of birth for the foreign-born population - Cabo Verde (%)
Place of birth for the foreign-born population - Ghana (%)
Place of birth for the foreign-born population - Liberia (%)
Place of birth for the foreign-born population - Nigeria (%)
Place of birth for the foreign-born population - Senegal (%)
Place of birth for the foreign-born population - Sierra Leone (%)
Place of birth for the foreign-born population - Other Western Africa (%)
Place of birth for the foreign-born population - Australia (%)
Place of birth for the foreign-born population - New Zealand (%)
Place of birth for the foreign-born population - Fiji (%)
Place of birth for the foreign-born population - Micronesia (%)
Place of birth for the foreign-born population - Bahamas (%)
Place of birth for the foreign-born population - Barbados (%)
Place of birth for the foreign-born population - Cuba (%)
Place of birth for the foreign-born population - Dominica (%)
Place of birth for the foreign-born population - Dominican Republic (%)
Place of birth for the foreign-born population - Grenada (%)
Place of birth for the foreign-born population - Haiti (%)
Place of birth for the foreign-born population - Jamaica (%)
Place of birth for the foreign-born population - St. Vincent and the Grenadines (%)
Place of birth for the foreign-born population - Trinidad and Tobago (%)
Place of birth for the foreign-born population - West Indies (%)
Place of birth for the foreign-born population - Other Caribbean (%)
Place of birth for the foreign-born population - Belize (%)
Place of birth for the foreign-born population - Costa Rica (%)
Place of birth for the foreign-born population - El Salvador (%)
Place of birth for the foreign-born population - Guatemala (%)
Place of birth for the foreign-born population - Honduras (%)
Place of birth for the foreign-born population - Mexico (%)
Place of birth for the foreign-born population - Nicaragua (%)
Place of birth for the foreign-born population - Panama (%)
Place of birth for the foreign-born population - Other Central America (%)
Place of birth for the foreign-born population - Argentina (%)
Place of birth for the foreign-born population - Bolivia (%)
Place of birth for the foreign-born population - Brazil (%)
Place of birth for the foreign-born population - Chile (%)
Place of birth for the foreign-born population - Colombia (%)
Place of birth for the foreign-born population - Ecuador (%)
Place of birth for the foreign-born population - Guyana (%)
Place of birth for the foreign-born population - Peru (%)
Place of birth for the foreign-born population - Uruguay (%)
Place of birth for the foreign-born population - Venezuela (%)
Place of birth for the foreign-born population - Other South America (%)
Place of birth for the foreign-born population - Canada (%)
Place of birth for the foreign-born population - Other Northern America (%)
Place of birth for the foreign-born population - Other (%)
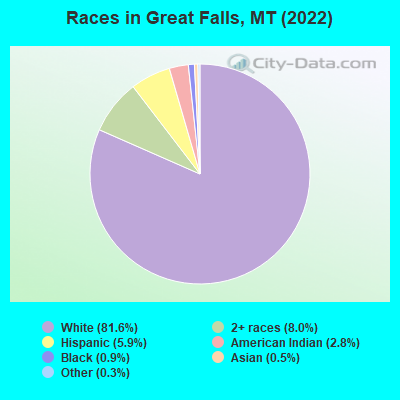
According to 2022 data, the most numerous races in Great Falls, MT are White alone (49,522 residents), American Indian alone (1,692 residents), and Two or more races (4,832 residents). 96.6% of Great Falls residents speak English at home. 1.5% of Great Falls, MT residents are foreign-born , which is 29.4% less than the foreign-born rate of 2.0% across the entire state of Montana.
Race distribution in Great Falls
2000 2022
807,823 89.5% White alone 54,426 6.0% American Indian alone 18,081 2.0% Hispanic 13,768 1.5% Two or more races 4,569 0.5% Asian alone 2,534 0.3% Black alone 569 0.06% Other race alone 425 0.05% Native Hawaiian and Other
937,365 83.5% White alone 58,748 5.2% American Indian alone 55,172 4.9% Two or more races 49,830 4.4% Hispanic 9,012 0.8% Other race alone 7,700 0.7% Asian alone 3,428 0.3% Black alone 1,612 0.1% Native Hawaiian and Other
Income and house value in Great Falls Median household income in 2022 $56,729 White non-Hispanic householders$60,789 Black householders$22,843 American Indian and Alaska Native householders$37,239 Asian householders$58,003 Some other race householders$64,650 Two or more races householders$49,139 Hispanic or Latino race householdersMedian 2022 house value $249,634 White Non-Hispanic householders$200,899 Black or African American householders$214,978 American Indian or Alaska Native householders $203,065 Asian householders$240,158 Some other race householders$242,324 Two or more races householders$246,927 Hispanic or Latino householders
Median age by race in Great Falls
42.7 Median age for White residents40.3 44.5 48.0 Median age for Black or African American residents30.5 45.8 33.3 Median age for American Indian / Alaska Native residents44.2 27.6 43.8 Median age for Asian residents37.2 25.5 -666,666,666.0 Median age for Native Hawaiian / Pacific Islander residents-666,666,666.0 -666,666,666.0 27.0 Median age for Other race residents28.1 24.2 24.5 Median age for Two or more races residents20.2 38.1 43.3 Median age for White alone residents41.0 45.0 26.4 Median age for Hispanic or Latino residents27.0 24.0
Owner/renter occupied households by race in Great Falls
House owners and renters - White residents 15,646 70.1% Owner occupied6,682 29.9% Renter occupiedHouse owners and renters - Black or African American residents 112 65.0% Owner occupied61 35.0% Renter occupiedHouse owners and renters - American Indian / Alaska Native residents 111 13.9% Owner occupied688 86.1% Renter occupiedHouse owners and renters - Asian residents 169 56.3% Owner occupied131 43.7% Renter occupiedHouse owners and renters - Other race residents 255 69.0% Owner occupied115 31.0% Renter occupiedHouse owners and renters - Two or more races residents 1,718 67.8% Owner occupied816 32.2% Renter occupiedHouse owners and renters - White alone residents 15,520 71.1% Owner occupied6,323 28.9% Renter occupiedHouse owners and renters - Hispanic or Latino residents 557 44.9% Owner occupied684 55.1% Renter occupied
Language usage in Great Falls
English speakers - Total 96.6% of residents of Great Falls speak English at home.
1.1% of residents speak Spanish at home 393 58.7% Speak English very well277 41.3% Speak English less than very well2.2% of residents speak other language at home 881 67.4% Speak English very well426 32.6% Speak English less than very well
English speakers - Born in the United States 97.5% of residents of Great Falls speak English at home.
1.1% of residents speak Spanish at home 88 32.6% Speak English very well182 67.4% Speak English less than very well1.2% of residents speak other language at home 225 81.2% Speak English very well52 18.8% Speak English less than very well
English speakers - Native, born elsewhere 80.9% of residents of Great Falls speak English at home.
19.8% of residents speak Spanish at home 144 82.8% Speak English very well30 17.2% Speak English less than very well2.0% of residents speak other language at home 18 100.0% Speak English very well
English speakers - Foreign-born 39.8% of residents of Great Falls speak English at home.
14.5% of residents speak Spanish at home 133 93.7% Speak English very well9 6.3% Speak English less than very well44.8% of residents speak other language at home 211 48.3% Speak English very well226 51.7% Speak English less than very well
White (Caucasian) - Speak only English Native:
98.0% (47,027)Foreign-born:
69.2% (352)
White (Caucasian) - Speak another language Native:
1.8% (888)Foreign-born:
27.7% (141)
Black or African American - Speak only English Native:
100.0% (625)Foreign-born:
97.4% (1)
Asian - Speak only English Native:
100.0% (214)Foreign-born:
19.0% (49)
Asian - Speak another language Native:
3.7% (8)Foreign-born:
82.0% (214)
Other race - Speak another language Native:
18.5% (278)Foreign-born:
94.9% (68)
Two or more races - Speak only English Native:
92.1% (4,260)Foreign-born:
21.5% (19)
Two or more races - Speak another language Native:
7.9% (366)Foreign-born:
75.8% (67)
White alone - Speak only English Native:
98.1% (46,043)Foreign-born:
76.0% (352)
White alone - Speak another language Native:
1.7% (798)Foreign-born:
21.8% (101)
Hispanic or Latino - Speak another language Native:
10.6% (307)Foreign-born:
100.0% (136)
Foreign-born residents in Great Falls 938 residents are foreign born
This city:
1.5%Montana:
2.3%
Marital status for residents in Great Falls Marital status - White (Caucasian) population 15 years and over
Males 31.9% Never married47.6% Now married1.4% Separated3.4% Widowed15.7% DivorcedFemales 24.6% Never married45.3% Now married1.2% Separated12.1% Widowed16.9% DivorcedWomen who gave birth in the past 12 months Now married:
50.2% (569)Unmarried:
49.8% (565)
Women who did not give birth in the past 12 months Now married:
42.1% (4,188)Unmarried:
57.9% (5,767)
Marital status - Black or African American population 15 years and over
Males 60.6% Never married34.6% Now married0.0% Separated2.3% Widowed2.5% DivorcedFemales 26.4% Never married58.6% Now married10.0% Separated0.0% Widowed5.0% DivorcedWomen who did not give birth in the past 12 months Now married:
65.1% (42)Unmarried:
34.9% (22)
Marital status - American Indian / Alaska Native population 15 years and over
Males 56.2% Never married21.6% Now married1.2% Separated0.5% Widowed20.6% DivorcedFemales 46.7% Never married28.4% Now married11.2% Separated7.7% Widowed6.0% DivorcedWomen who gave birth in the past 12 months Now married:
0.0% (0)Unmarried:
100.0% (50)
Women who did not give birth in the past 12 months Now married:
48.9% (304)Unmarried:
51.1% (318)
Marital status - Asian population 15 years and over
Males 31.4% Never married50.5% Now married0.0% Separated0.0% Widowed18.1% DivorcedFemales 18.1% Never married62.9% Now married7.1% Separated1.6% Widowed10.3% DivorcedWomen who did not give birth in the past 12 months Now married:
57.6% (97)Unmarried:
42.4% (72)
Marital status - Other race population 15 years and over
Males 67.4% Never married25.1% Now married0.0% Separated1.2% Widowed6.2% DivorcedFemales 38.5% Never married50.5% Now married4.6% Separated0.0% Widowed6.4% DivorcedWomen who gave birth in the past 12 months Now married:
100.0% (117)Unmarried:
0.0% (0)
Women who did not give birth in the past 12 months Now married:
27.9% (81)Unmarried:
72.1% (209)
Marital status - Two or more races population 15 years and over
Males 46.4% Never married48.0% Now married0.0% Separated0.6% Widowed4.9% DivorcedFemales 44.6% Never married29.4% Now married1.5% Separated7.0% Widowed17.6% DivorcedWomen who gave birth in the past 12 months Now married:
90.6% (80)Unmarried:
9.4% (8)
Women who did not give birth in the past 12 months Now married:
23.4% (253)Unmarried:
76.6% (826)
Marital status - White alone, not Hispanic / Latino population 15 years and over
Males 31.7% Never married47.9% Now married1.4% Separated3.3% Widowed15.7% DivorcedFemales 24.1% Never married45.5% Now married1.2% Separated12.3% Widowed16.9% DivorcedWomen who gave birth in the past 12 months Now married:
58.3% (563)Unmarried:
41.7% (402)
Women who did not give birth in the past 12 months Now married:
41.9% (4,034)Unmarried:
58.1% (5,591)
Marital status - Hispanic or Latino population 15 years and over
Males 49.0% Never married33.5% Now married0.0% Separated5.4% Widowed12.2% DivorcedFemales 48.4% Never married36.3% Now married0.7% Separated1.6% Widowed12.9% DivorcedWomen who gave birth in the past 12 months Now married:
25.2% (78)Unmarried:
74.8% (231)
Women who did not give birth in the past 12 months Now married:
40.1% (276)Unmarried:
59.9% (411)
Ancestries in Great Falls
4,053 15.2% German3,406 12.8% American2,843 10.7% English2,128 8.0% Irish1,982 7.4% Norwegian1,073 4.0% Italian648 2.4% Scandinavian592 2.2% European525 2.0% Scottish490 1.8% Scotch-Irish331 1.2% Polish208 0.8% Dutch207 0.8% French Canadian181 0.7% Finnish152 0.6% Welsh136 0.5% Swedish127 0.5% Russian118 0.4% Danish113 0.4% French100 0.4% Croatian88 0.3% Czech81 0.3% Northern European76 0.3% Iranian58 0.2% British53 0.2% Austrian50 0.2% Eastern European44 0.2% Slovene36 0.1% Slavic28 0.1% Lithuanian26 0.10% Ukrainian26 0.10% Jamaican25 0.09% Yugoslavian24 0.09% Portuguese22 0.08% Romanian21 0.08% Czechoslovakian17 0.06% Greek16 0.06% Slovak16 0.06% Canadian15 0.06% Basque14 0.05% Cajun11 0.04% Armenian9 0.03% Hungarian9 0.03% Haitian6 0.02% Latvian6 0.02% Luxembourger5 0.02% Turkish4 0.02% Bulgarian
Geographical mobility in Great Falls Same house 1 year ago 42,418 84.3% White (Caucasian)465 74.3% Black or African American1,640 69.2% American Indian / Alaska Native432 76.1% Asian1,248 74.3% Other race4,131 81.8% Two or more races41,662 84.8% White alone, not Hispanic / Latino2,381 71.9% Hispanic or LatinoMoved within same county 4,334 8.6% White / Caucasian90 14.4% Black or African American145 6.1% American Indian / Alaska Native59 10.4% Asian166 9.9% Other race463 9.2% Two or more races4,301 8.8% White alone, not Hispanic / Latino230 6.9% Hispanic or LatinoMoved within same state 1,071 2.1% White / Caucasian567 23.9% American Indian / Alaska Native23 4.1% Asian52 1.0% Two or more races1,063 2.2% White alone, not Hispanic / Latino95 2.9% Hispanic or LatinoMoved from different state 2,172 4.3% White / Caucasian66 10.5% Black or African American47 2.0% American Indian / Alaska Native53 9.3% Asian2 99.3% Native Hawaiian / Pacific Islander81 4.8% Other race340 6.7% Two or more races1,825 3.7% White alone, not Hispanic / Latino593 17.9% Hispanic or LatinoMoved from abroad 126 0.3% White62 2.6% American Indian / Alaska Native21 0.4% Two or more races126 0.3% White alone, not Hispanic / Latino17 0.5% Hispanic or Latino
Children Nativity (place of birth) in Great Falls
Children under 6 years - Living with two parents Both parents native 2,365 100.0% NativeOne native, one foreign-born parent 65 100.0% NativeChildren under 6 years - Living with one parent Native parent 1,261 100.0% Native
Children 6 to 17 years - Living with two parents Both parents native 4,736 99.8% Native10 0.2% Foreign-bornOne native, one foreign-born parent 371 97.5% Native10 2.5% Foreign-bornChildren 6 to 17 years - Living with one parent Native parent 3,084 100.0% Native
Grandparents responsible for own grandchildren in Great Falls
Grandparents (30 to 59 years) White / Caucasian 52 23.5% Responsible for grandchildren169 76.5% Not responsible for grandchildrenAmerican Indian / Alaska Native 14 51.6% Responsible for grandchildren13 48.4% Not responsible for grandchildrenOther race 17 100.0% Not responsible for grandchildrenTwo or more races 35 67.9% Responsible for grandchildren16 32.1% Not responsible for grandchildrenWhite alone, not Hispanic / Latino 55 32.0% Responsible for grandchildren117 68.0% Not responsible for grandchildrenHispanic or Latino 32 100.0% Not responsible for grandchildrenGrandparents (60 years and over) White / Caucasian 123 25.6% Responsible for grandchildren359 74.4% Not responsible for grandchildrenAmerican Indian / Alaska Native 11 100.0% Responsible for grandchildrenTwo or more races 36 100.0% Responsible for grandchildrenWhite alone, not Hispanic / Latino 125 27.7% Responsible for grandchildren326 72.3% Not responsible for grandchildrenHispanic or Latino 24 100.0% Not responsible for grandchildren