Races in Island Lake, Illinois (IL) Detailed Stats
Data:
Races - White alone (%)
Races - White alone (% change since 2000)
Races - Black alone (%)
Races - Black alone (% change since 2000)
Races - American Indian alone (%)
Races - American Indian alone (% change since 2000)
Races - Asian alone (%)
Races - Asian alone (% change since 2000)
Races - Hispanic (%)
Races - Hispanic (% change since 2000)
Races - Native Hawaiian and Other Pacific Islander alone (%)
Races - Native Hawaiian and Other Pacific Islander alone (% change since 2000)
Races - Two or more races(%)
Races - Two or more races(% change since 2000)
Races - Other race alone (%)
Races - Other race alone (% change since 2000)
Racial diversity
Place of birth - Born in state of residence (%)
Place of birth - Born in state of residence (%) - White
Place of birth - Born in state of residence (%) - Black or African American
Place of birth - Born in state of residence (%) - Asian
Place of birth - Born in state of residence (%) - Hispanic or Latino
Place of birth - Born in state of residence (%) - American Indian and Alaska Native
Place of birth - Born in state of residence (%) - Multirace
Place of birth - Born in state of residence (%) - Other Race
Place of birth - Born in other state (%)
Place of birth - Born in other state (%) - White
Place of birth - Born in other state (%) - Black or African American
Place of birth - Born in other state (%) - Asian
Place of birth - Born in other state (%) - Hispanic or Latino
Place of birth - Born in other state (%) - American Indian and Alaska Native
Place of birth - Born in other state (%) - Multirace
Place of birth - Born in other state (%) - Other Race
Place of birth - Native, outside of US (%)
Place of birth - Native, outside of US (%) - White
Place of birth - Native, outside of US (%) - Black or African American
Place of birth - Native, outside of US (%) - Asian
Place of birth - Native, outside of US (%) - Hispanic or Latino
Place of birth - Native, outside of US (%) - American Indian and Alaska Native
Place of birth - Native, outside of US (%) - Multirace
Place of birth - Native, outside of US (%) - Other Race
Place of birth - Foreign born (%)
Place of birth - Foreign born (%) - White
Place of birth - Foreign born (%) - Black or African American
Place of birth - Foreign born (%) - Asian
Place of birth - Foreign born (%) - Hispanic or Latino
Place of birth - Foreign born (%) - American Indian and Alaska Native
Place of birth - Foreign born (%) - Multirace
Place of birth - Foreign born (%) - Other Race
Residents speaking English at home (%)
Residents speaking English at home - Born in the United States (%)
Residents speaking English at home - Native, born elsewhere (%)
Residents speaking English at home - Foreign born (%)
Residents speaking Spanish at home (%)
Residents speaking Spanish at home - Born in the United States (%)
Residents speaking Spanish at home - Native, born elsewhere (%)
Residents speaking Spanish at home - Foreign born (%)
Residents speaking other language at home (%)
Residents speaking other language at home - Born in the United States (%)
Residents speaking other language at home - Native, born elsewhere (%)
Residents speaking other language at home - Foreign born (%)
Marital status - Never married (%)
Marital status - Now married (%)
Marital status - Separated (%)
Marital status - Widowed (%)
Marital status - Divorced (%)
Ancestries Reported - Arab (%)
Ancestries Reported - Czech (%)
Ancestries Reported - Danish (%)
Ancestries Reported - Dutch (%)
Ancestries Reported - English (%)
Ancestries Reported - French (%)
Ancestries Reported - French Canadian (%)
Ancestries Reported - German (%)
Ancestries Reported - Greek (%)
Ancestries Reported - Hungarian (%)
Ancestries Reported - Irish (%)
Ancestries Reported - Italian (%)
Ancestries Reported - Lithuanian (%)
Ancestries Reported - Norwegian (%)
Ancestries Reported - Polish (%)
Ancestries Reported - Portuguese (%)
Ancestries Reported - Russian (%)
Ancestries Reported - Scotch-Irish (%)
Ancestries Reported - Scottish (%)
Ancestries Reported - Slovak (%)
Ancestries Reported - Subsaharan African (%)
Ancestries Reported - Swedish (%)
Ancestries Reported - Swiss (%)
Ancestries Reported - Ukrainian (%)
Ancestries Reported - United States (%)
Ancestries Reported - Welsh (%)
Ancestries Reported - West Indian (%)
Ancestries Reported - Other (%)
Geographical mobility - Same house 1 year ago (%)
Geographical mobility - Same house 1 year ago (%) - White
Geographical mobility - Same house 1 year ago (%) - Black or African American
Geographical mobility - Same house 1 year ago (%) - Asian
Geographical mobility - Same house 1 year ago (%) - Hispanic or Latino
Geographical mobility - Same house 1 year ago (%) - American Indian and Alaska Native
Geographical mobility - Same house 1 year ago (%) - Multirace
Geographical mobility - Same house 1 year ago (%) - Other Race
Geographical mobility - Moved within same county (%)
Geographical mobility - Moved within same county (%) - White
Geographical mobility - Moved within same county (%) - Black or African American
Geographical mobility - Moved within same county (%) - Asian
Geographical mobility - Moved within same county (%) - Hispanic or Latino
Geographical mobility - Moved within same county (%) - American Indian and Alaska Native
Geographical mobility - Moved within same county (%) - Multirace
Geographical mobility - Moved within same county (%) - Other Race
Geographical mobility - Moved from different county within same state (%)
Geographical mobility - Moved from different county within same state (%) - White
Geographical mobility - Moved from different county within same state (%) - Black or African American
Geographical mobility - Moved from different county within same state (%) - Asian
Geographical mobility - Moved from different county within same state (%) - Hispanic or Latino
Geographical mobility - Moved from different county within same state (%) - American Indian and Alaska Native
Geographical mobility - Moved from different county within same state (%) - Multirace
Geographical mobility - Moved from different county within same state (%) - Other Race
Geographical mobility - Moved from different state (%)
Geographical mobility - Moved from different state (%) - White
Geographical mobility - Moved from different state (%) - Black or African American
Geographical mobility - Moved from different state (%) - Asian
Geographical mobility - Moved from different state (%) - Hispanic or Latino
Geographical mobility - Moved from different state (%) - American Indian and Alaska Native
Geographical mobility - Moved from different state (%) - Multirace
Geographical mobility - Moved from different state (%) - Other Race
Geographical mobility - Moved from abroad (%)
Geographical mobility - Moved from abroad (%) - White
Geographical mobility - Moved from abroad (%) - Black or African American
Geographical mobility - Moved from abroad (%) - Asian
Geographical mobility - Moved from abroad (%) - Hispanic or Latino
Geographical mobility - Moved from abroad (%) - American Indian and Alaska Native
Geographical mobility - Moved from abroad (%) - Multirace
Geographical mobility - Moved from abroad (%) - Other Race
Place of birth for the foreign-born population - Ireland (%)
Place of birth for the foreign-born population - Denmark (%)
Place of birth for the foreign-born population - Norway (%)
Place of birth for the foreign-born population - Sweden (%)
Place of birth for the foreign-born population - United Kingdom (%)
Place of birth for the foreign-born population - England (%)
Place of birth for the foreign-born population - Scotland (%)
Place of birth for the foreign-born population - Other Northern Europe (%)
Place of birth for the foreign-born population - Austria (%)
Place of birth for the foreign-born population - Belgium (%)
Place of birth for the foreign-born population - France (%)
Place of birth for the foreign-born population - Germany (%)
Place of birth for the foreign-born population - Netherlands (%)
Place of birth for the foreign-born population - Switzerland (%)
Place of birth for the foreign-born population - Other Western Europe (%)
Place of birth for the foreign-born population - Greece (%)
Place of birth for the foreign-born population - Italy (%)
Place of birth for the foreign-born population - Portugal (%)
Place of birth for the foreign-born population - Spain (%)
Place of birth for the foreign-born population - Other Southern Europe (%)
Place of birth for the foreign-born population - Albania (%)
Place of birth for the foreign-born population - Belarus (%)
Place of birth for the foreign-born population - Bosnia and Herzegovina (%)
Place of birth for the foreign-born population - Bulgaria (%)
Place of birth for the foreign-born population - Croatia (%)
Place of birth for the foreign-born population - Czechoslovakia (%)
Place of birth for the foreign-born population - Hungary (%)
Place of birth for the foreign-born population - Latvia (%)
Place of birth for the foreign-born population - Lithuania (%)
Place of birth for the foreign-born population - North Macedonia (Macedonia) (%)
Place of birth for the foreign-born population - Moldova (%)
Place of birth for the foreign-born population - Poland (%)
Place of birth for the foreign-born population - Romania (%)
Place of birth for the foreign-born population - Russia (%)
Place of birth for the foreign-born population - Serbia (%)
Place of birth for the foreign-born population - Ukraine (%)
Place of birth for the foreign-born population - Other Eastern Europe (%)
Place of birth for the foreign-born population - China (%)
Place of birth for the foreign-born population - Hong Kong (%)
Place of birth for the foreign-born population - Taiwan (%)
Place of birth for the foreign-born population - Japan (%)
Place of birth for the foreign-born population - Korea (%)
Place of birth for the foreign-born population - Other Eastern Asia (%)
Place of birth for the foreign-born population - Afghanistan (%)
Place of birth for the foreign-born population - Bangladesh (%)
Place of birth for the foreign-born population - India (%)
Place of birth for the foreign-born population - Iran (%)
Place of birth for the foreign-born population - Kazakhstan (%)
Place of birth for the foreign-born population - Nepal (%)
Place of birth for the foreign-born population - Pakistan (%)
Place of birth for the foreign-born population - Sri Lanka (%)
Place of birth for the foreign-born population - Uzbekistan (%)
Place of birth for the foreign-born population - Other South Central Asia (%)
Place of birth for the foreign-born population - Burma (%)
Place of birth for the foreign-born population - Cambodia (%)
Place of birth for the foreign-born population - Indonesia (%)
Place of birth for the foreign-born population - Laos (%)
Place of birth for the foreign-born population - Malaysia (%)
Place of birth for the foreign-born population - Philippines (%)
Place of birth for the foreign-born population - Singapore (%)
Place of birth for the foreign-born population - Thailand (%)
Place of birth for the foreign-born population - Vietnam (%)
Place of birth for the foreign-born population - Other South Eastern Asia (%)
Place of birth for the foreign-born population - Armenia (%)
Place of birth for the foreign-born population - Iraq (%)
Place of birth for the foreign-born population - Israel (%)
Place of birth for the foreign-born population - Jordan (%)
Place of birth for the foreign-born population - Kuwait (%)
Place of birth for the foreign-born population - Lebanon (%)
Place of birth for the foreign-born population - Saudi Arabia (%)
Place of birth for the foreign-born population - Syria (%)
Place of birth for the foreign-born population - Turkey (%)
Place of birth for the foreign-born population - Yemen (%)
Place of birth for the foreign-born population - Other Western Asia (%)
Place of birth for the foreign-born population - Eritrea (%)
Place of birth for the foreign-born population - Ethiopia (%)
Place of birth for the foreign-born population - Kenya (%)
Place of birth for the foreign-born population - Somalia (%)
Place of birth for the foreign-born population - Uganda (%)
Place of birth for the foreign-born population - Zimbabwe (%)
Place of birth for the foreign-born population - Other Eastern Africa (%)
Place of birth for the foreign-born population - Cameroon (%)
Place of birth for the foreign-born population - Congo (%)
Place of birth for the foreign-born population - Democratic Republic of Congo (Zaire) (%)
Place of birth for the foreign-born population - Other Middle Africa (%)
Place of birth for the foreign-born population - Egypt (%)
Place of birth for the foreign-born population - Morocco (%)
Place of birth for the foreign-born population - Sudan (%)
Place of birth for the foreign-born population - Other Northern Africa (%)
Place of birth for the foreign-born population - South Africa (%)
Place of birth for the foreign-born population - Other Southern Africa (%)
Place of birth for the foreign-born population - Cabo Verde (%)
Place of birth for the foreign-born population - Ghana (%)
Place of birth for the foreign-born population - Liberia (%)
Place of birth for the foreign-born population - Nigeria (%)
Place of birth for the foreign-born population - Senegal (%)
Place of birth for the foreign-born population - Sierra Leone (%)
Place of birth for the foreign-born population - Other Western Africa (%)
Place of birth for the foreign-born population - Australia (%)
Place of birth for the foreign-born population - New Zealand (%)
Place of birth for the foreign-born population - Fiji (%)
Place of birth for the foreign-born population - Micronesia (%)
Place of birth for the foreign-born population - Bahamas (%)
Place of birth for the foreign-born population - Barbados (%)
Place of birth for the foreign-born population - Cuba (%)
Place of birth for the foreign-born population - Dominica (%)
Place of birth for the foreign-born population - Dominican Republic (%)
Place of birth for the foreign-born population - Grenada (%)
Place of birth for the foreign-born population - Haiti (%)
Place of birth for the foreign-born population - Jamaica (%)
Place of birth for the foreign-born population - St. Vincent and the Grenadines (%)
Place of birth for the foreign-born population - Trinidad and Tobago (%)
Place of birth for the foreign-born population - West Indies (%)
Place of birth for the foreign-born population - Other Caribbean (%)
Place of birth for the foreign-born population - Belize (%)
Place of birth for the foreign-born population - Costa Rica (%)
Place of birth for the foreign-born population - El Salvador (%)
Place of birth for the foreign-born population - Guatemala (%)
Place of birth for the foreign-born population - Honduras (%)
Place of birth for the foreign-born population - Mexico (%)
Place of birth for the foreign-born population - Nicaragua (%)
Place of birth for the foreign-born population - Panama (%)
Place of birth for the foreign-born population - Other Central America (%)
Place of birth for the foreign-born population - Argentina (%)
Place of birth for the foreign-born population - Bolivia (%)
Place of birth for the foreign-born population - Brazil (%)
Place of birth for the foreign-born population - Chile (%)
Place of birth for the foreign-born population - Colombia (%)
Place of birth for the foreign-born population - Ecuador (%)
Place of birth for the foreign-born population - Guyana (%)
Place of birth for the foreign-born population - Peru (%)
Place of birth for the foreign-born population - Uruguay (%)
Place of birth for the foreign-born population - Venezuela (%)
Place of birth for the foreign-born population - Other South America (%)
Place of birth for the foreign-born population - Canada (%)
Place of birth for the foreign-born population - Other Northern America (%)
Place of birth for the foreign-born population - Other (%)
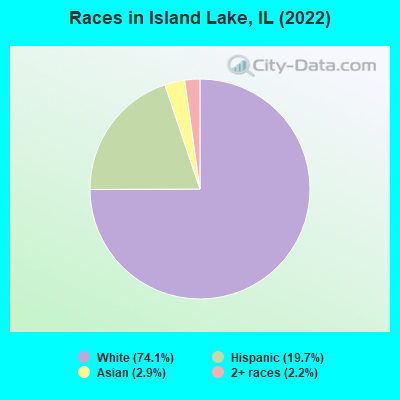
According to 2022 data, the most numerous races in Island Lake, IL are White alone (5,925 residents), Hispanic (1,576 residents), and Black alone (0 residents). 77.2% of Island Lake residents speak English at home. 14.6% of Island Lake, IL residents are foreign-born (7.9% born in Latin America, 3.9% born in Europe, 2.4% born in Asia), which is 3.9% greater than the foreign-born rate of 14.0% across the entire state of Illinois.
Race distribution in Island Lake
2000 2022
8,424,140 67.8% White alone 1,856,152 14.9% Black alone 1,530,262 12.3% Hispanic 419,916 3.4% Asian alone 153,996 1.2% Two or more races 13,479 0.1% Other race alone 18,232 0.1% American Indian alone 3,116 0.03% Native Hawaiian and Other
7,356,301 58.5% White alone 2,299,726 18.3% Hispanic 1,660,423 13.2% Black alone 747,296 5.9% Asian alone 458,599 3.6% Two or more races 45,386 0.4% Other race alone 10,405 0.08% American Indian alone 3,896 0.03% Native Hawaiian and Other
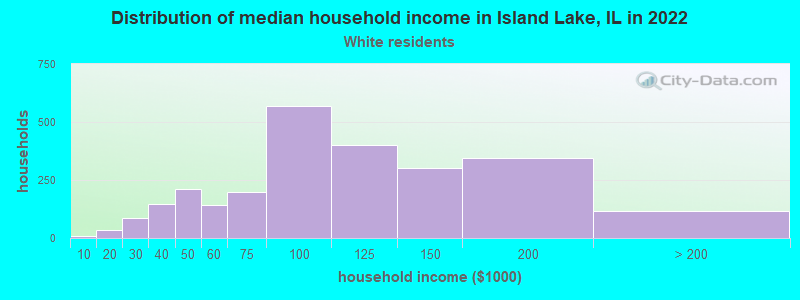
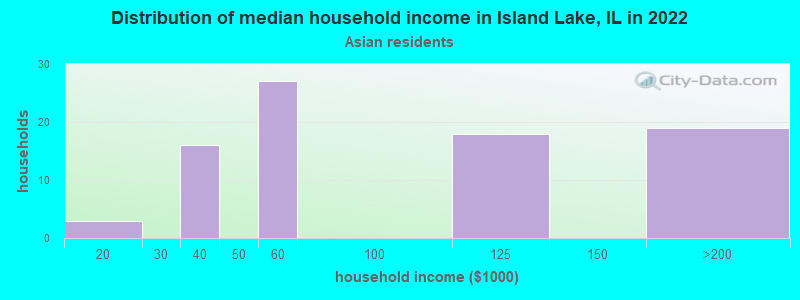
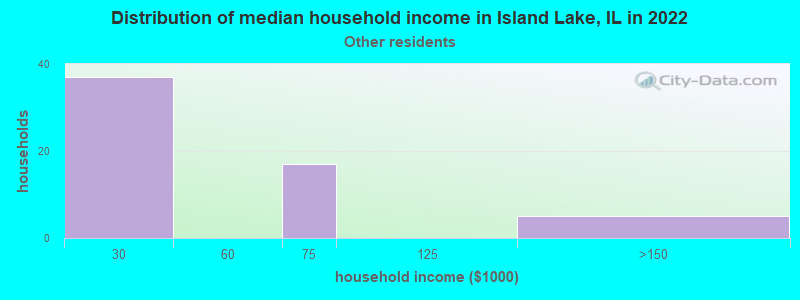
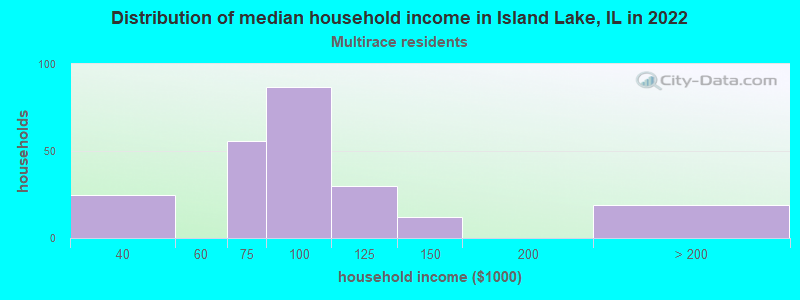
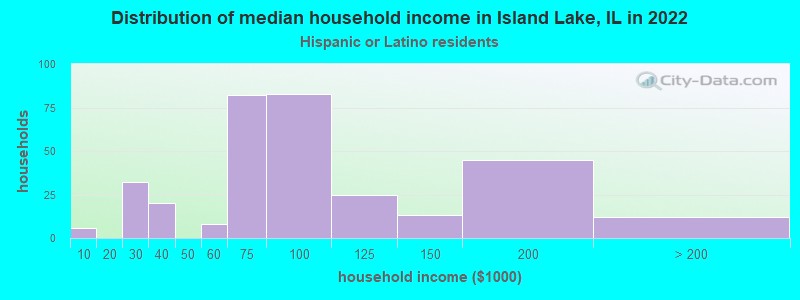
Income and house value in Island Lake Median household income in 2022 $94,926 White non-Hispanic householders$73,155 Two or more races householders$86,777 Hispanic or Latino race householdersMedian 2022 house value $231,684 White Non-Hispanic householders$298,704 Black or African American householders $360,754 Asian householders$198,655 Some other race householders$220,461 Two or more races householders$220,942 Hispanic or Latino householders
Median age by race in Island Lake
41.9 Median age for White residents44.4 39.7 -683,333,332.6 Median age for Black or African American residents-679,528,402.3 -712,990,935.8 -657,243,815.6 Median age for American Indian / Alaska Native residents-671,532,846.0 -638,251,365.5 52.6 Median age for Asian residents52.6 56.9 -593,236,714.4 Median age for Native Hawaiian / Pacific Islander residents-658,536,584.7 -576,015,108.0 23.4 Median age for Other race residents49.4 19.2 35.7 Median age for Two or more races residents51.8 35.6 44.2 Median age for White alone residents46.5 40.3 27.2 Median age for Hispanic or Latino residents32.0 20.1
Owner/renter occupied households by race in Island Lake
House owners and renters - White residents 2,022 80.8% Owner occupied481 19.2% Renter occupiedHouse owners and renters - Asian residents 78 90.0% Owner occupied9 10.0% Renter occupiedHouse owners and renters - Other race residents 47 83.1% Owner occupied10 16.9% Renter occupiedHouse owners and renters - Two or more races residents 239 83.7% Owner occupied47 16.3% Renter occupiedHouse owners and renters - White alone residents 1,912 79.0% Owner occupied510 21.0% Renter occupiedHouse owners and renters - Hispanic or Latino residents 310 89.7% Owner occupied36 10.3% Renter occupied
Language usage in Island Lake
English speakers - Total 77.2% of residents of Island Lake speak English at home.
16.6% of residents speak Spanish at home 841 68.8% Speak English very well382 31.2% Speak English less than very well5.6% of residents speak other language at home 290 70.7% Speak English very well120 29.3% Speak English less than very well
English speakers - Born in the United States 96.5% of residents of Island Lake speak English at home.
1.7% of residents speak Spanish at home 19 100.0% Speak English very well1.3% of residents speak other language at home 15 100.0% Speak English very well
English speakers - Native, born elsewhere 17.3% of residents of Island Lake speak English at home.
77.8% of residents speak Spanish at home 25 39.7% Speak English very well38 60.3% Speak English less than very well
English speakers - Foreign-born 21.5% of residents of Island Lake speak English at home.
50.9% of residents speak Spanish at home 333 53.8% Speak English very well286 46.2% Speak English less than very well25.3% of residents speak other language at home 186 60.4% Speak English very well122 39.6% Speak English less than very well
White (Caucasian) - Speak only English Native:
95.3% (5,010)Foreign-born:
42.8% (230)
White (Caucasian) - Speak another language Native:
5.2% (274)Foreign-born:
62.5% (336)
Asian - Speak only English Native:
32.9% (23)Foreign-born:
8.6% (14)
Asian - Speak another language Native:
75.3% (53)Foreign-born:
91.4% (144)
Other race - Speak another language Native:
86.6% (160)Foreign-born:
94.8% (103)
Two or more races - Speak another language Native:
22.2% (96)Foreign-born:
100.0% (363)
White alone - Speak only English Native:
98.5% (4,922)Foreign-born:
58.6% (228)
White alone - Speak another language Native:
1.7% (83)Foreign-born:
43.1% (168)
Hispanic or Latino - Speak only English Native:
34.5% (292)Foreign-born:
1.6% (11)
Hispanic or Latino - Speak another language Native:
65.4% (554)Foreign-born:
96.3% (644)
Foreign-born residents in Island Lake 1,165 residents are foreign born (7.9% Latin America , 3.9% Europe , 2.4% Asia ).
This city:
14.6%Illinois:
14.1%
Marital status for residents in Island Lake Marital status - White (Caucasian) population 15 years and over
Males 25.8% Never married54.9% Now married0.3% Separated0.8% Widowed18.2% DivorcedFemales 21.5% Never married55.8% Now married0.3% Separated7.2% Widowed15.1% DivorcedWomen who gave birth in the past 12 months Now married:
86.9% (65)Unmarried:
13.1% (10)
Women who did not give birth in the past 12 months Now married:
56.0% (638)Unmarried:
44.0% (500)
Marital status - Asian population 15 years and over
Males 40.3% Never married48.7% Now married0.0% Separated0.0% Widowed10.9% DivorcedFemales 14.2% Never married85.8% Now married0.0% Separated0.0% Widowed0.0% DivorcedWomen who did not give birth in the past 12 months Now married:
67.4% (30)Unmarried:
32.6% (15)
Marital status - Other race population 15 years and over
Males 38.8% Never married61.2% Now married0.0% Separated0.0% Widowed0.0% DivorcedFemales 81.6% Never married18.4% Now married0.0% Separated0.0% Widowed0.0% DivorcedWomen who did not give birth in the past 12 months Now married:
18.4% (27)Unmarried:
81.6% (121)
Marital status - Two or more races population 15 years and over
Males 37.0% Never married43.5% Now married0.0% Separated0.0% Widowed19.6% DivorcedFemales 48.5% Never married45.5% Now married2.7% Separated0.0% Widowed3.3% DivorcedWomen who gave birth in the past 12 months Now married:
100.0% (16)Unmarried:
0.0% (0)
Women who did not give birth in the past 12 months Now married:
44.2% (172)Unmarried:
55.8% (217)
Marital status - White alone, not Hispanic / Latino population 15 years and over
Males 23.3% Never married54.6% Now married0.4% Separated1.0% Widowed20.8% DivorcedFemales 19.1% Never married56.5% Now married0.3% Separated7.6% Widowed16.4% DivorcedWomen who gave birth in the past 12 months Now married:
86.9% (69)Unmarried:
13.1% (10)
Women who did not give birth in the past 12 months Now married:
58.5% (598)Unmarried:
41.5% (425)
Marital status - Hispanic or Latino population 15 years and over
Males 42.0% Never married55.1% Now married0.0% Separated0.0% Widowed2.8% DivorcedFemales 51.5% Never married43.5% Now married1.3% Separated1.7% Widowed2.0% DivorcedWomen who gave birth in the past 12 months Now married:
100.0% (11)Unmarried:
0.0% (0)
Women who did not give birth in the past 12 months Now married:
38.1% (194)Unmarried:
61.9% (315)
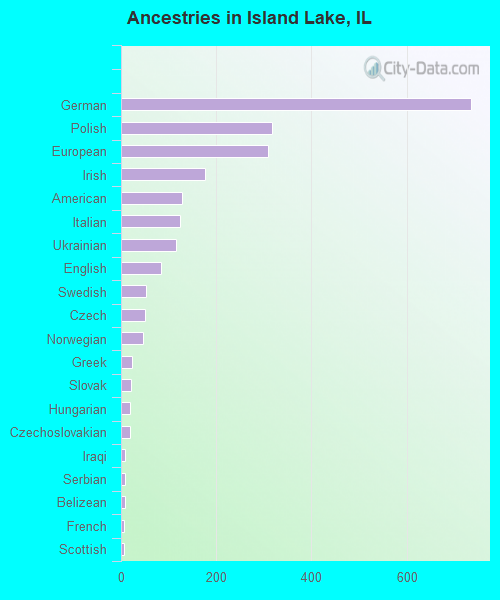
Ancestries in Island Lake
736 19.5% German318 8.4% Polish308 8.2% European176 4.7% Irish129 3.4% American123 3.3% Italian116 3.1% Ukrainian85 2.3% English52 1.4% Swedish50 1.3% Czech47 1.2% Norwegian23 0.6% Greek22 0.6% Slovak19 0.5% Hungarian18 0.5% Czechoslovakian9 0.2% Iraqi8 0.2% Serbian8 0.2% Belizean7 0.2% French7 0.2% Scottish6 0.2% Danish5 0.1% British
Children Nativity (place of birth) in Island Lake
Children under 6 years - Living with two parents Both parents native 542 100.0% NativeBoth parents foreign-born 7 100.0% NativeOne native, one foreign-born parent 75 100.0% NativeChildren under 6 years - Living with one parent Native parent 53 100.0% NativeForeign-born parent 69 100.0% NativeChildren 6 to 17 years - Living with two parents Both parents native 391 100.0% NativeBoth parents foreign-born 236 90.6% Native25 9.4% Foreign-bornOne native, one foreign-born parent 91 100.0% NativeChildren 6 to 17 years - Living with one parent Native parent 57 100.0% NativeForeign-born parent 65 51.8% Native61 48.2% Foreign-born
Grandparents responsible for own grandchildren in Island Lake
Grandparents (30 to 59 years) White / Caucasian 6 100.0% Not responsible for grandchildrenTwo or more races 13 100.0% Not responsible for grandchildrenWhite alone, not Hispanic / Latino 7 100.0% Not responsible for grandchildrenHispanic or Latino 8 100.0% Not responsible for grandchildrenGrandparents (60 years and over) White / Caucasian 8 67.1% Responsible for grandchildren4 32.9% Not responsible for grandchildrenWhite alone, not Hispanic / Latino 9 63.8% Responsible for grandchildren5 36.2% Not responsible for grandchildren