Races in Isle La Motte, Vermont (VT) Detailed Stats
Ancestries, Foreign-born residents, place of birth
10.2% of Isle La Motte, VT residents are foreign-born (7.4% born in North America, 2.9% born in Europe), which is 61.0% greater than the foreign-born rate of 4.0% across the entire state of Vermont.
Race distribution in Isle La Motte

- 47797.7%White alone
- 61.2%American Indian alone
- 40.8%Two or more races
- 10.2%Asian alone

2000
2022
-
- 585,43196.2%White alone
- 6,8091.1%Two or more races
- 5,5040.9%Hispanic
- 5,1600.8%Asian alone
- 2,9210.5%Black alone
- 2,3250.4%American Indian alone
- 5570.09%Other race alone
- 1200.02%Native Hawaiian and Other
Pacific Islander alone

-
- 583,54690.2%White alone
- 27,3404.2%Two or more races
- 14,7702.3%Hispanic
- 11,5121.8%Asian alone
- 6,2641.0%Black alone
- 2,5210.4%Other race alone
- 1,0520.2%American Indian alone
- 590.01%Native Hawaiian and Other
Pacific Islander alone

Income and house value in Isle La Motte
- Median household income in 2022
- $64,657White non-Hispanic householders
- Median 2022 house value
- $310,828White Non-Hispanic householders
Household income for White non-Hispanic householders

Foreign-born residents in Isle La Motte
50 residents are foreign born (7.4% North America, 2.9% Europe).
| This city: | 10.2% |
| Vermont: | 3.8% |
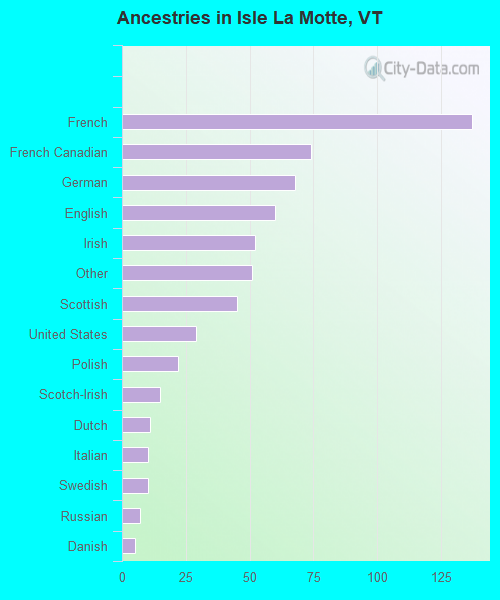
Ancestries in Isle La Motte

- 13722.9%French
- 7412.4%French Canadian
- 6811.4%German
- 6010.1%English
- 528.7%Irish
- 518.5%Other
- 457.5%Scottish
- 294.9%United States
- 223.7%Polish
- 152.5%Scotch-Irish
- 111.8%Dutch
- 101.7%Italian
- 101.7%Swedish
- 71.2%Russian
- 50.8%Danish
- 10.2%Norwegian
Zip codes: 05440.