Races in Keystone, Florida (FL) Detailed Stats
Data:
Races - White alone (%)
Races - White alone (% change since 2000)
Races - Black alone (%)
Races - Black alone (% change since 2000)
Races - American Indian alone (%)
Races - American Indian alone (% change since 2000)
Races - Asian alone (%)
Races - Asian alone (% change since 2000)
Races - Hispanic (%)
Races - Hispanic (% change since 2000)
Races - Native Hawaiian and Other Pacific Islander alone (%)
Races - Native Hawaiian and Other Pacific Islander alone (% change since 2000)
Races - Two or more races(%)
Races - Two or more races(% change since 2000)
Races - Other race alone (%)
Races - Other race alone (% change since 2000)
Racial diversity
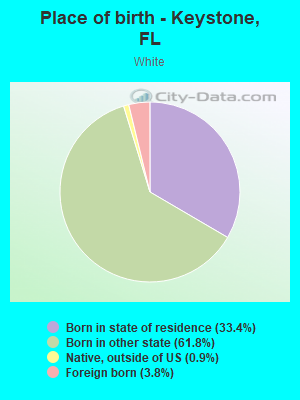
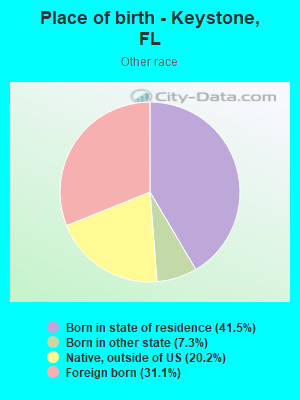
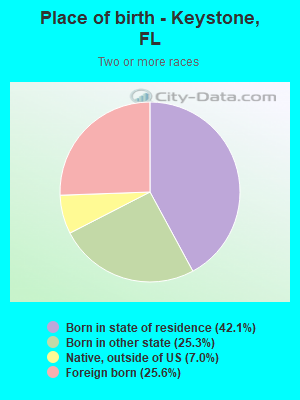
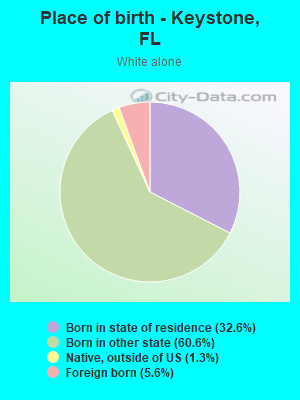
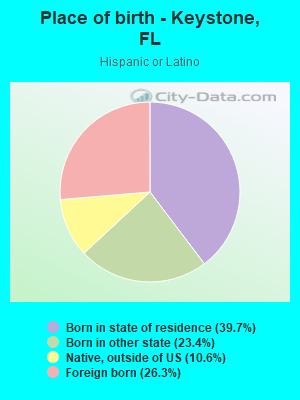
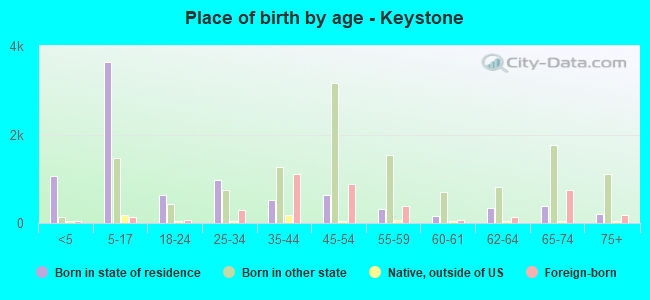
Place of birth - Born in state of residence (%)
Place of birth - Born in state of residence (%) - White
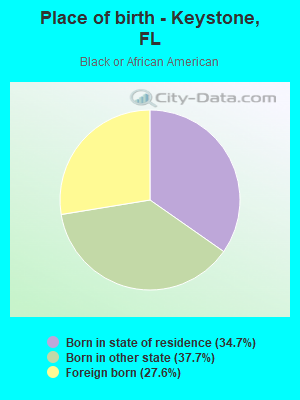
Place of birth - Born in state of residence (%) - Black or African American
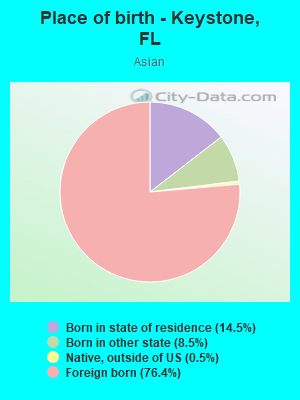
Place of birth - Born in state of residence (%) - Asian
Place of birth - Born in state of residence (%) - Hispanic or Latino
Place of birth - Born in state of residence (%) - American Indian and Alaska Native
Place of birth - Born in state of residence (%) - Multirace
Place of birth - Born in state of residence (%) - Other Race
Place of birth - Born in other state (%)
Place of birth - Born in other state (%) - White
Place of birth - Born in other state (%) - Black or African American
Place of birth - Born in other state (%) - Asian
Place of birth - Born in other state (%) - Hispanic or Latino
Place of birth - Born in other state (%) - American Indian and Alaska Native
Place of birth - Born in other state (%) - Multirace
Place of birth - Born in other state (%) - Other Race
Place of birth - Native, outside of US (%)
Place of birth - Native, outside of US (%) - White
Place of birth - Native, outside of US (%) - Black or African American
Place of birth - Native, outside of US (%) - Asian
Place of birth - Native, outside of US (%) - Hispanic or Latino
Place of birth - Native, outside of US (%) - American Indian and Alaska Native
Place of birth - Native, outside of US (%) - Multirace
Place of birth - Native, outside of US (%) - Other Race
Place of birth - Foreign born (%)
Place of birth - Foreign born (%) - White
Place of birth - Foreign born (%) - Black or African American
Place of birth - Foreign born (%) - Asian
Place of birth - Foreign born (%) - Hispanic or Latino
Place of birth - Foreign born (%) - American Indian and Alaska Native
Place of birth - Foreign born (%) - Multirace
Place of birth - Foreign born (%) - Other Race
Residents speaking English at home (%)
Residents speaking English at home - Born in the United States (%)
Residents speaking English at home - Native, born elsewhere (%)
Residents speaking English at home - Foreign born (%)
Residents speaking Spanish at home (%)
Residents speaking Spanish at home - Born in the United States (%)
Residents speaking Spanish at home - Native, born elsewhere (%)
Residents speaking Spanish at home - Foreign born (%)
Residents speaking other language at home (%)
Residents speaking other language at home - Born in the United States (%)
Residents speaking other language at home - Native, born elsewhere (%)
Residents speaking other language at home - Foreign born (%)
Marital status - Never married (%)
Marital status - Now married (%)
Marital status - Separated (%)
Marital status - Widowed (%)
Marital status - Divorced (%)
Ancestries Reported - Arab (%)
Ancestries Reported - Czech (%)
Ancestries Reported - Danish (%)
Ancestries Reported - Dutch (%)
Ancestries Reported - English (%)
Ancestries Reported - French (%)
Ancestries Reported - French Canadian (%)
Ancestries Reported - German (%)
Ancestries Reported - Greek (%)
Ancestries Reported - Hungarian (%)
Ancestries Reported - Irish (%)
Ancestries Reported - Italian (%)
Ancestries Reported - Lithuanian (%)
Ancestries Reported - Norwegian (%)
Ancestries Reported - Polish (%)
Ancestries Reported - Portuguese (%)
Ancestries Reported - Russian (%)
Ancestries Reported - Scotch-Irish (%)
Ancestries Reported - Scottish (%)
Ancestries Reported - Slovak (%)
Ancestries Reported - Subsaharan African (%)
Ancestries Reported - Swedish (%)
Ancestries Reported - Swiss (%)
Ancestries Reported - Ukrainian (%)
Ancestries Reported - United States (%)
Ancestries Reported - Welsh (%)
Ancestries Reported - West Indian (%)
Ancestries Reported - Other (%)
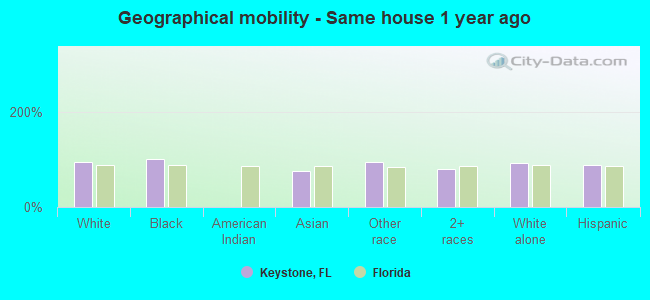
Geographical mobility - Same house 1 year ago (%)
Geographical mobility - Same house 1 year ago (%) - White
Geographical mobility - Same house 1 year ago (%) - Black or African American
Geographical mobility - Same house 1 year ago (%) - Asian
Geographical mobility - Same house 1 year ago (%) - Hispanic or Latino
Geographical mobility - Same house 1 year ago (%) - American Indian and Alaska Native
Geographical mobility - Same house 1 year ago (%) - Multirace
Geographical mobility - Same house 1 year ago (%) - Other Race
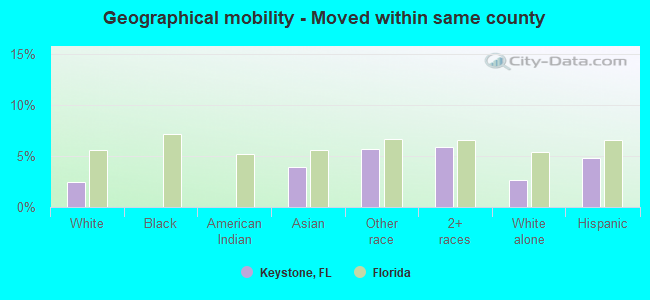
Geographical mobility - Moved within same county (%)
Geographical mobility - Moved within same county (%) - White
Geographical mobility - Moved within same county (%) - Black or African American
Geographical mobility - Moved within same county (%) - Asian
Geographical mobility - Moved within same county (%) - Hispanic or Latino
Geographical mobility - Moved within same county (%) - American Indian and Alaska Native
Geographical mobility - Moved within same county (%) - Multirace
Geographical mobility - Moved within same county (%) - Other Race
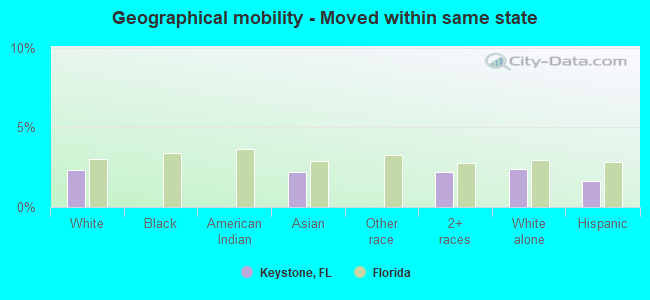
Geographical mobility - Moved from different county within same state (%)
Geographical mobility - Moved from different county within same state (%) - White
Geographical mobility - Moved from different county within same state (%) - Black or African American
Geographical mobility - Moved from different county within same state (%) - Asian
Geographical mobility - Moved from different county within same state (%) - Hispanic or Latino
Geographical mobility - Moved from different county within same state (%) - American Indian and Alaska Native
Geographical mobility - Moved from different county within same state (%) - Multirace
Geographical mobility - Moved from different county within same state (%) - Other Race
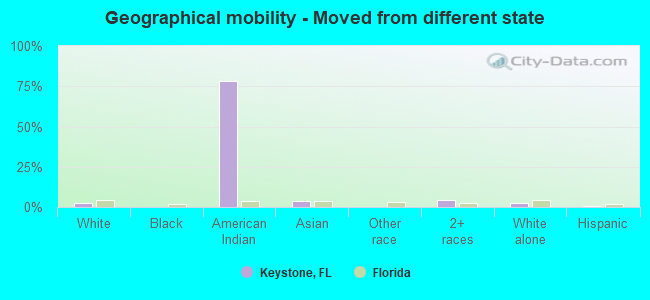
Geographical mobility - Moved from different state (%)
Geographical mobility - Moved from different state (%) - White
Geographical mobility - Moved from different state (%) - Black or African American
Geographical mobility - Moved from different state (%) - Asian
Geographical mobility - Moved from different state (%) - Hispanic or Latino
Geographical mobility - Moved from different state (%) - American Indian and Alaska Native
Geographical mobility - Moved from different state (%) - Multirace
Geographical mobility - Moved from different state (%) - Other Race
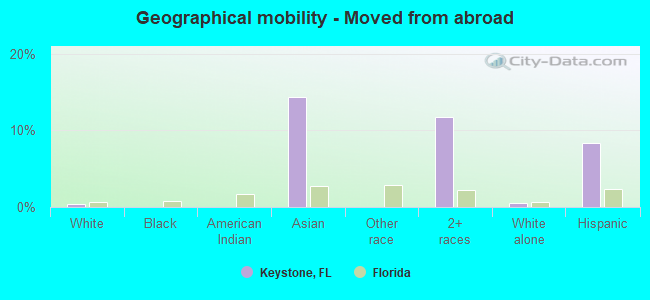
Geographical mobility - Moved from abroad (%)
Geographical mobility - Moved from abroad (%) - White
Geographical mobility - Moved from abroad (%) - Black or African American
Geographical mobility - Moved from abroad (%) - Asian
Geographical mobility - Moved from abroad (%) - Hispanic or Latino
Geographical mobility - Moved from abroad (%) - American Indian and Alaska Native
Geographical mobility - Moved from abroad (%) - Multirace
Geographical mobility - Moved from abroad (%) - Other Race
Place of birth for the foreign-born population - Ireland (%)
Place of birth for the foreign-born population - Denmark (%)
Place of birth for the foreign-born population - Norway (%)
Place of birth for the foreign-born population - Sweden (%)
Place of birth for the foreign-born population - United Kingdom (%)
Place of birth for the foreign-born population - England (%)
Place of birth for the foreign-born population - Scotland (%)
Place of birth for the foreign-born population - Other Northern Europe (%)
Place of birth for the foreign-born population - Austria (%)
Place of birth for the foreign-born population - Belgium (%)
Place of birth for the foreign-born population - France (%)
Place of birth for the foreign-born population - Germany (%)
Place of birth for the foreign-born population - Netherlands (%)
Place of birth for the foreign-born population - Switzerland (%)
Place of birth for the foreign-born population - Other Western Europe (%)
Place of birth for the foreign-born population - Greece (%)
Place of birth for the foreign-born population - Italy (%)
Place of birth for the foreign-born population - Portugal (%)
Place of birth for the foreign-born population - Spain (%)
Place of birth for the foreign-born population - Other Southern Europe (%)
Place of birth for the foreign-born population - Albania (%)
Place of birth for the foreign-born population - Belarus (%)
Place of birth for the foreign-born population - Bosnia and Herzegovina (%)
Place of birth for the foreign-born population - Bulgaria (%)
Place of birth for the foreign-born population - Croatia (%)
Place of birth for the foreign-born population - Czechoslovakia (%)
Place of birth for the foreign-born population - Hungary (%)
Place of birth for the foreign-born population - Latvia (%)
Place of birth for the foreign-born population - Lithuania (%)
Place of birth for the foreign-born population - North Macedonia (Macedonia) (%)
Place of birth for the foreign-born population - Moldova (%)
Place of birth for the foreign-born population - Poland (%)
Place of birth for the foreign-born population - Romania (%)
Place of birth for the foreign-born population - Russia (%)
Place of birth for the foreign-born population - Serbia (%)
Place of birth for the foreign-born population - Ukraine (%)
Place of birth for the foreign-born population - Other Eastern Europe (%)
Place of birth for the foreign-born population - China (%)
Place of birth for the foreign-born population - Hong Kong (%)
Place of birth for the foreign-born population - Taiwan (%)
Place of birth for the foreign-born population - Japan (%)
Place of birth for the foreign-born population - Korea (%)
Place of birth for the foreign-born population - Other Eastern Asia (%)
Place of birth for the foreign-born population - Afghanistan (%)
Place of birth for the foreign-born population - Bangladesh (%)
Place of birth for the foreign-born population - India (%)
Place of birth for the foreign-born population - Iran (%)
Place of birth for the foreign-born population - Kazakhstan (%)
Place of birth for the foreign-born population - Nepal (%)
Place of birth for the foreign-born population - Pakistan (%)
Place of birth for the foreign-born population - Sri Lanka (%)
Place of birth for the foreign-born population - Uzbekistan (%)
Place of birth for the foreign-born population - Other South Central Asia (%)
Place of birth for the foreign-born population - Burma (%)
Place of birth for the foreign-born population - Cambodia (%)
Place of birth for the foreign-born population - Indonesia (%)
Place of birth for the foreign-born population - Laos (%)
Place of birth for the foreign-born population - Malaysia (%)
Place of birth for the foreign-born population - Philippines (%)
Place of birth for the foreign-born population - Singapore (%)
Place of birth for the foreign-born population - Thailand (%)
Place of birth for the foreign-born population - Vietnam (%)
Place of birth for the foreign-born population - Other South Eastern Asia (%)
Place of birth for the foreign-born population - Armenia (%)
Place of birth for the foreign-born population - Iraq (%)
Place of birth for the foreign-born population - Israel (%)
Place of birth for the foreign-born population - Jordan (%)
Place of birth for the foreign-born population - Kuwait (%)
Place of birth for the foreign-born population - Lebanon (%)
Place of birth for the foreign-born population - Saudi Arabia (%)
Place of birth for the foreign-born population - Syria (%)
Place of birth for the foreign-born population - Turkey (%)
Place of birth for the foreign-born population - Yemen (%)
Place of birth for the foreign-born population - Other Western Asia (%)
Place of birth for the foreign-born population - Eritrea (%)
Place of birth for the foreign-born population - Ethiopia (%)
Place of birth for the foreign-born population - Kenya (%)
Place of birth for the foreign-born population - Somalia (%)
Place of birth for the foreign-born population - Uganda (%)
Place of birth for the foreign-born population - Zimbabwe (%)
Place of birth for the foreign-born population - Other Eastern Africa (%)
Place of birth for the foreign-born population - Cameroon (%)
Place of birth for the foreign-born population - Congo (%)
Place of birth for the foreign-born population - Democratic Republic of Congo (Zaire) (%)
Place of birth for the foreign-born population - Other Middle Africa (%)
Place of birth for the foreign-born population - Egypt (%)
Place of birth for the foreign-born population - Morocco (%)
Place of birth for the foreign-born population - Sudan (%)
Place of birth for the foreign-born population - Other Northern Africa (%)
Place of birth for the foreign-born population - South Africa (%)
Place of birth for the foreign-born population - Other Southern Africa (%)
Place of birth for the foreign-born population - Cabo Verde (%)
Place of birth for the foreign-born population - Ghana (%)
Place of birth for the foreign-born population - Liberia (%)
Place of birth for the foreign-born population - Nigeria (%)
Place of birth for the foreign-born population - Senegal (%)
Place of birth for the foreign-born population - Sierra Leone (%)
Place of birth for the foreign-born population - Other Western Africa (%)
Place of birth for the foreign-born population - Australia (%)
Place of birth for the foreign-born population - New Zealand (%)
Place of birth for the foreign-born population - Fiji (%)
Place of birth for the foreign-born population - Micronesia (%)
Place of birth for the foreign-born population - Bahamas (%)
Place of birth for the foreign-born population - Barbados (%)
Place of birth for the foreign-born population - Cuba (%)
Place of birth for the foreign-born population - Dominica (%)
Place of birth for the foreign-born population - Dominican Republic (%)
Place of birth for the foreign-born population - Grenada (%)
Place of birth for the foreign-born population - Haiti (%)
Place of birth for the foreign-born population - Jamaica (%)
Place of birth for the foreign-born population - St. Vincent and the Grenadines (%)
Place of birth for the foreign-born population - Trinidad and Tobago (%)
Place of birth for the foreign-born population - West Indies (%)
Place of birth for the foreign-born population - Other Caribbean (%)
Place of birth for the foreign-born population - Belize (%)
Place of birth for the foreign-born population - Costa Rica (%)
Place of birth for the foreign-born population - El Salvador (%)
Place of birth for the foreign-born population - Guatemala (%)
Place of birth for the foreign-born population - Honduras (%)
Place of birth for the foreign-born population - Mexico (%)
Place of birth for the foreign-born population - Nicaragua (%)
Place of birth for the foreign-born population - Panama (%)
Place of birth for the foreign-born population - Other Central America (%)
Place of birth for the foreign-born population - Argentina (%)
Place of birth for the foreign-born population - Bolivia (%)
Place of birth for the foreign-born population - Brazil (%)
Place of birth for the foreign-born population - Chile (%)
Place of birth for the foreign-born population - Colombia (%)
Place of birth for the foreign-born population - Ecuador (%)
Place of birth for the foreign-born population - Guyana (%)
Place of birth for the foreign-born population - Peru (%)
Place of birth for the foreign-born population - Uruguay (%)
Place of birth for the foreign-born population - Venezuela (%)
Place of birth for the foreign-born population - Other South America (%)
Place of birth for the foreign-born population - Canada (%)
Place of birth for the foreign-born population - Other Northern America (%)
Place of birth for the foreign-born population - Other (%)
Latest news about races in Keystone, FL collected exclusively by city-data.com from local newspapers, TV, and radio stations
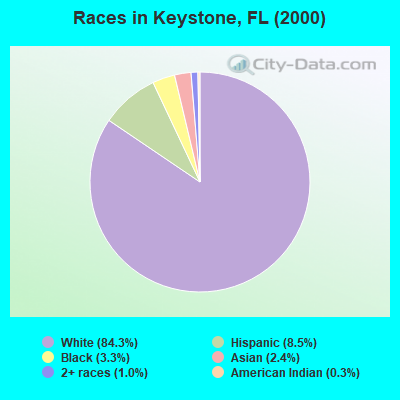
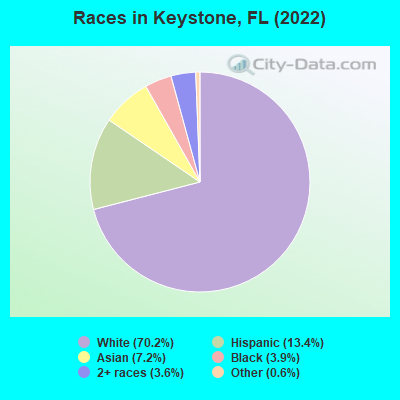
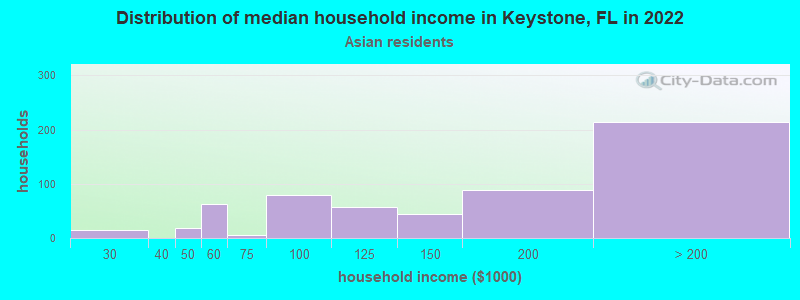
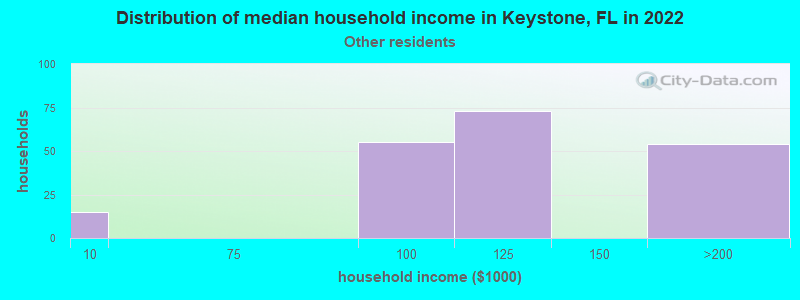
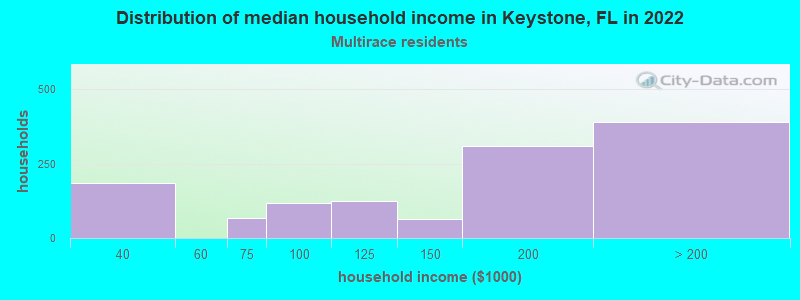
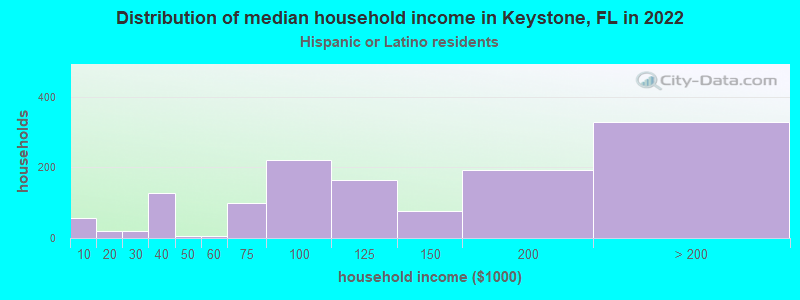
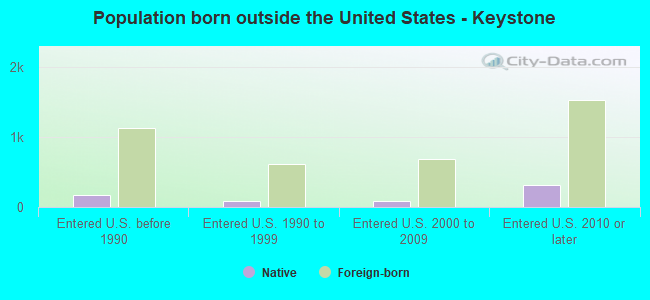
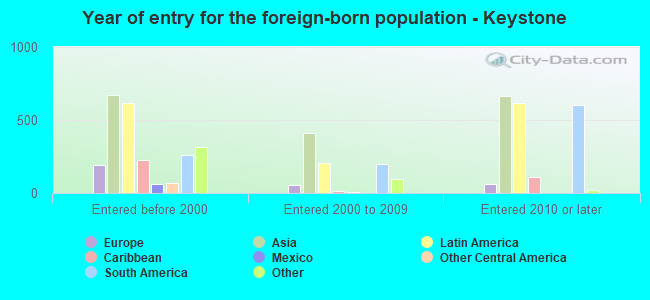
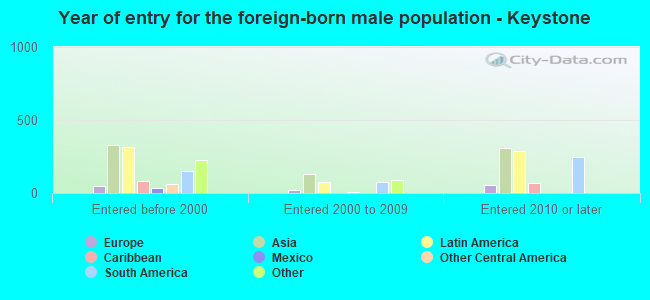
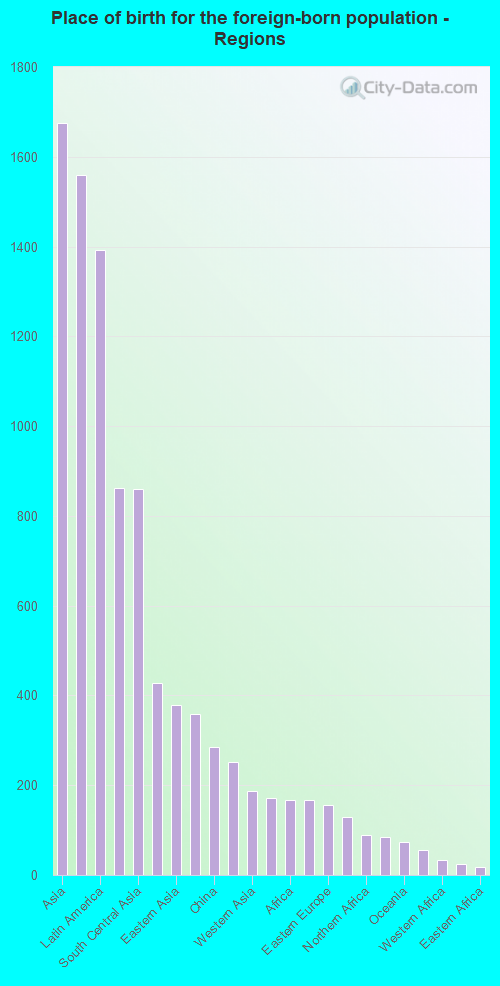
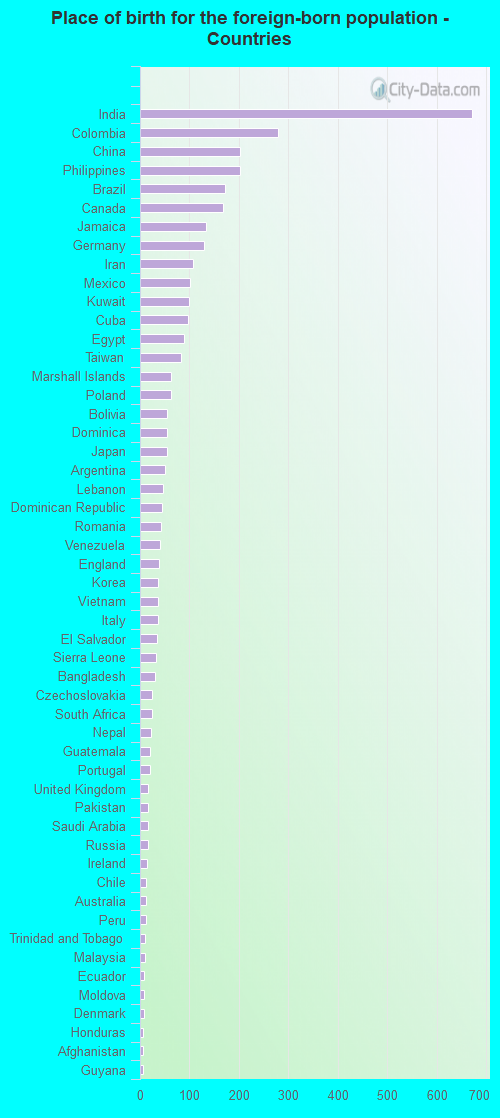
According to 2022 data, the most numerous races in Keystone, FL are White alone (18,847 residents), Hispanic (3,610 residents), and Black alone (1,059 residents). 82.1% of Keystone residents speak English at home. 14.5% of Keystone, FL residents are foreign-born (6.1% born in Asia, 5.1% born in Latin America, 1.6% born in Europe), which is 44.4% less than the foreign-born rate of 21.0% across the entire state of Florida.
Race distribution in Keystone
2000 2022
10,458,509 65.4% White alone 2,682,715 16.8% Hispanic 2,264,268 14.2% Black alone 261,693 1.6% Asian alone 236,954 1.5% Two or more races 42,358 0.3% American Indian alone 28,994 0.2% Other race alone 6,887 0.04% Native Hawaiian and Other
11,309,403 50.8% White alone 6,025,039 27.1% Hispanic 3,241,015 14.6% Black alone 861,630 3.9% Two or more races 623,692 2.8% Asian alone 152,054 0.7% Other race alone 22,504 0.1% American Indian alone 9,486 0.04% Native Hawaiian and Other
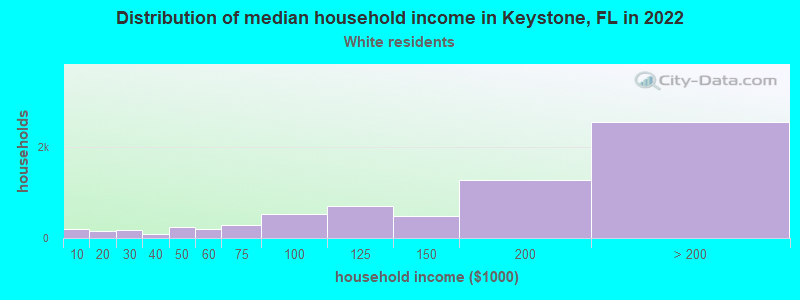
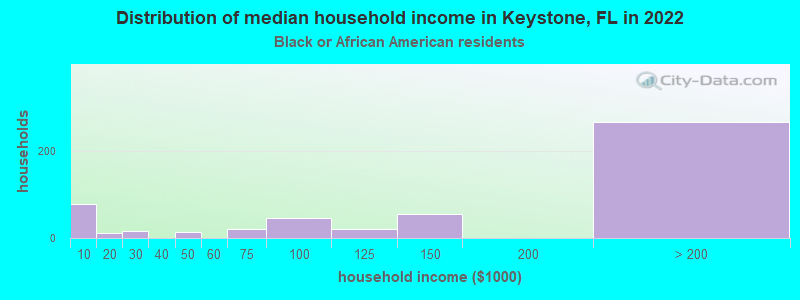
Income and house value in Keystone Median household income in 2022 $163,698 White non-Hispanic householders$141,873 Black householders$137,571 Asian householders$120,288 Some other race householders$153,478 Two or more races householders$116,997 Hispanic or Latino race householdersMedian 2022 house value $668,577 White Non-Hispanic householders$593,013 Black or African American householdersover $1,000,000 American Indian or Alaska Native householders $676,237 Asian householders$495,164 Some other race householders$551,227 Two or more races householders$625,398 Hispanic or Latino householders
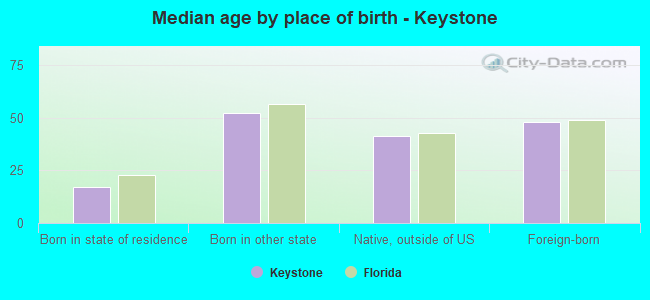
Median age by race in Keystone
47.7 Median age for White residents48.7 46.9 53.2 Median age for Black or African American residents54.3 49.8 -670,487,105.3 Median age for American Indian / Alaska Native residents-676,245,210.1 -655,399,060.4 47.0 Median age for Asian residents44.1 47.9 -848,484,847.6 Median age for Native Hawaiian / Pacific Islander residents-776,729,559.0 -490,118,576.6 32.7 Median age for Other race residents43.8 11.1 31.9 Median age for Two or more races residents19.6 42.0 46.8 Median age for White alone residents47.5 45.9 39.9 Median age for Hispanic or Latino residents40.3 40.0
Owner/renter occupied households by race in Keystone
House owners and renters - White residents 6,277 93.7% Owner occupied425 6.3% Renter occupiedHouse owners and renters - Black or African American residents 511 98.1% Owner occupied10 1.9% Renter occupiedHouse owners and renters - Asian residents 589 93.3% Owner occupied42 6.7% Renter occupiedHouse owners and renters - Other race residents 119 64.6% Owner occupied65 35.4% Renter occupiedHouse owners and renters - Two or more races residents 1,021 88.3% Owner occupied135 11.7% Renter occupiedHouse owners and renters - White alone residents 6,400 93.9% Owner occupied419 6.1% Renter occupiedHouse owners and renters - Hispanic or Latino residents 987 81.2% Owner occupied228 18.8% Renter occupied
Language usage in Keystone
English speakers - Total 82.1% of residents of Keystone speak English at home.
6.7% of residents speak Spanish at home 1,177 68.2% Speak English very well548 31.8% Speak English less than very well11.6% of residents speak other language at home 2,101 70.7% Speak English very well869 29.3% Speak English less than very well
English speakers - Born in the United States 93.9% of residents of Keystone speak English at home.
2.9% of residents speak Spanish at home 320 84.4% Speak English very well59 15.6% Speak English less than very well3.4% of residents speak other language at home 401 90.3% Speak English very well43 9.7% Speak English less than very well
English speakers - Native, born elsewhere 38.3% of residents of Keystone speak English at home.
43.5% of residents speak Spanish at home 204 74.5% Speak English very well70 25.5% Speak English less than very well29.0% of residents speak other language at home 176 96.2% Speak English very well7 3.8% Speak English less than very well
English speakers - Foreign-born 27.1% of residents of Keystone speak English at home.
21.9% of residents speak Spanish at home 565 63.9% Speak English very well319 36.1% Speak English less than very well49.9% of residents speak other language at home 1,247 62.0% Speak English very well765 38.0% Speak English less than very well
White (Caucasian) - Speak only English Native:
100.0% (16,585)Foreign-born:
58.5% (407)
White (Caucasian) - Speak another language Native:
2.9% (483)Foreign-born:
56.5% (393)
Black or African American - Speak only English Native:
98.9% (771)Foreign-born:
94.9% (281)
Black or African American - Speak another language Native:
1.2% (10)Foreign-born:
4.3% (13)
Asian - Speak only English Native:
44.7% (156)Foreign-born:
15.6% (232)
Asian - Speak another language Native:
56.4% (197)Foreign-born:
84.4% (1,257)
Other race - Speak only English Native:
58.2% (198)Foreign-born:
44.8% (83)
Other race - Speak another language Native:
43.7% (148)Foreign-born:
44.8% (84)
Two or more races - Speak only English Native:
74.7% (2,014)Foreign-born:
3.7% (34)
Two or more races - Speak another language Native:
23.4% (630)Foreign-born:
97.6% (884)
White alone - Speak only English Native:
95.9% (16,205)Foreign-born:
45.1% (475)
White alone - Speak another language Native:
4.1% (686)Foreign-born:
55.5% (584)
Hispanic or Latino - Speak only English Native:
76.6% (1,902)Foreign-born:
8.9% (81)
Hispanic or Latino - Speak another language Native:
30.0% (744)Foreign-born:
90.7% (827)
Foreign-born residents in Keystone 3,905 residents are foreign born (6.1% Asia , 5.1% Latin America , 1.6% Europe ).
This city:
14.5%Florida:
21.1%
Marital status for residents in Keystone Marital status - White (Caucasian) population 15 years and over
Males 21.0% Never married68.8% Now married0.3% Separated1.6% Widowed8.3% DivorcedFemales 18.9% Never married68.8% Now married1.5% Separated3.8% Widowed6.9% DivorcedWomen who gave birth in the past 12 months Now married:
100.0% (133)Unmarried:
0.0% (0)
Women who did not give birth in the past 12 months Now married:
61.6% (2,070)Unmarried:
38.4% (1,289)
Marital status - Black or African American population 15 years and over
Males 24.5% Never married58.8% Now married0.0% Separated5.4% Widowed11.3% DivorcedFemales 27.2% Never married57.0% Now married0.0% Separated11.5% Widowed4.2% DivorcedWomen who did not give birth in the past 12 months Now married:
40.1% (75)Unmarried:
59.9% (111)
Marital status - Asian population 15 years and over
Males 10.9% Never married85.3% Now married1.1% Separated0.0% Widowed2.8% DivorcedFemales 4.2% Never married87.9% Now married0.0% Separated4.4% Widowed3.6% DivorcedWomen who gave birth in the past 12 months Now married:
100.0% (22)Unmarried:
0.0% (0)
Women who did not give birth in the past 12 months Now married:
88.6% (407)Unmarried:
11.4% (52)
Marital status - Other race population 15 years and over
Males 28.5% Never married71.5% Now married0.0% Separated0.0% Widowed0.0% DivorcedFemales 19.4% Never married76.7% Now married0.0% Separated0.0% Widowed3.9% DivorcedWomen who did not give birth in the past 12 months Now married:
71.0% (67)Unmarried:
29.0% (27)
Marital status - Two or more races population 15 years and over
Males 29.4% Never married58.0% Now married0.0% Separated1.4% Widowed11.1% DivorcedFemales 28.7% Never married48.4% Now married7.7% Separated9.8% Widowed5.4% DivorcedWomen who did not give birth in the past 12 months Now married:
50.2% (404)Unmarried:
49.8% (401)
Marital status - White alone, not Hispanic / Latino population 15 years and over
Males 19.8% Never married70.1% Now married0.3% Separated1.5% Widowed8.3% DivorcedFemales 17.7% Never married70.1% Now married1.4% Separated4.1% Widowed6.7% DivorcedWomen who gave birth in the past 12 months Now married:
100.0% (151)Unmarried:
0.0% (0)
Women who did not give birth in the past 12 months Now married:
62.8% (2,246)Unmarried:
37.2% (1,331)
Marital status - Hispanic or Latino population 15 years and over
Males 29.8% Never married57.6% Now married0.0% Separated2.3% Widowed10.3% DivorcedFemales 31.9% Never married50.8% Now married5.3% Separated5.8% Widowed6.2% DivorcedWomen who gave birth in the past 12 months Now married:
100.0% (6)Unmarried:
0.0% (0)
Women who did not give birth in the past 12 months Now married:
51.2% (461)Unmarried:
48.8% (439)
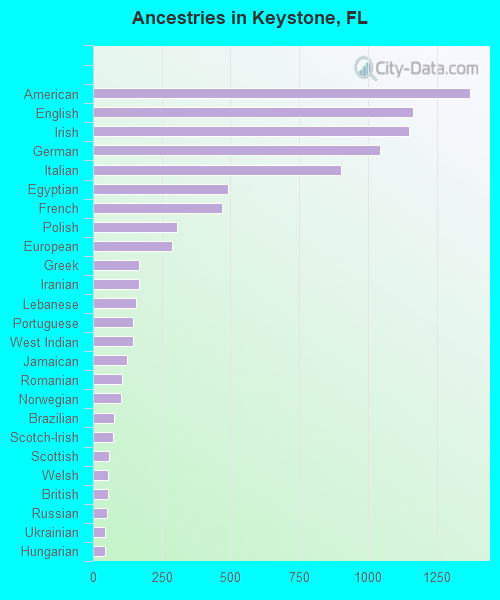
Ancestries in Keystone
1,372 10.4% American1,165 8.9% English1,151 8.7% Irish1,044 7.9% German903 6.9% Italian492 3.7% Egyptian471 3.6% French304 2.3% Polish288 2.2% European168 1.3% Greek166 1.3% Iranian155 1.2% Lebanese146 1.1% Portuguese145 1.1% West Indian125 1.0% Jamaican105 0.8% Romanian101 0.8% Norwegian77 0.6% Brazilian73 0.6% Scotch-Irish57 0.4% Scottish55 0.4% Welsh55 0.4% British51 0.4% Russian45 0.3% Ukrainian44 0.3% Hungarian38 0.3% Czech37 0.3% Canadian34 0.3% Lithuanian32 0.2% Swedish29 0.2% Yugoslavian28 0.2% Dutch28 0.2% Czechoslovakian28 0.2% Australian18 0.1% African17 0.1% French Canadian15 0.1% Scandinavian14 0.1% Eastern European12 0.09% British West Indian10 0.08% Northern European10 0.08% Slovene10 0.08% Icelander8 0.06% Danish6 0.05% Belgian6 0.05% Slovak6 0.05% Assyrian
Geographical mobility in Keystone Same house 1 year ago 16,488 93.8% White (Caucasian)1,101 100.0% Black or African American1,456 76.3% Asian576 94.3% Other race3,068 79.4% Two or more races17,435 93.0% White alone, not Hispanic / Latino3,126 87.1% Hispanic or LatinoMoved within same county 431 2.5% White / Caucasian75 4.0% Asian35 5.7% Other race228 5.9% Two or more races488 2.6% White alone, not Hispanic / Latino172 4.8% Hispanic or LatinoMoved within same state 403 2.3% White / Caucasian42 2.2% Asian85 2.2% Two or more races450 2.4% White alone, not Hispanic / Latino59 1.6% Hispanic or LatinoMoved from different state 422 2.4% White / Caucasian4 78.3% American Indian / Alaska Native75 3.9% Asian160 4.1% Two or more races453 2.4% White alone, not Hispanic / Latino14 0.4% Hispanic or LatinoMoved from abroad 64 0.4% White274 14.4% Asian452 11.7% Two or more races109 0.6% White alone, not Hispanic / Latino299 8.3% Hispanic or Latino
Children Nativity (place of birth) in Keystone
Children under 6 years - Living with two parents Both parents native 1,028 100.0% NativeBoth parents foreign-born 250 91.1% Native24 8.9% Foreign-bornOne native, one foreign-born parent 95 100.0% NativeChildren under 6 years - Living with one parent Native parent 73 100.0% NativeForeign-born parent 30 100.0% NativeChildren 6 to 17 years - Living with two parents Both parents native 3,062 100.0% NativeBoth parents foreign-born 523 80.4% Native128 19.6% Foreign-bornOne native, one foreign-born parent 742 100.0% NativeChildren 6 to 17 years - Living with one parent Native parent 558 100.0% NativeForeign-born parent 159 54.5% Native133 45.5% Foreign-born
Grandparents responsible for own grandchildren in Keystone
Grandparents (30 to 59 years) White / Caucasian 8 100.0% Responsible for grandchildrenWhite alone, not Hispanic / Latino 9 100.0% Responsible for grandchildrenGrandparents (60 years and over) White / Caucasian 58 23.5% Responsible for grandchildren188 76.5% Not responsible for grandchildrenWhite alone, not Hispanic / Latino 71 22.0% Responsible for grandchildren252 78.0% Not responsible for grandchildren