Races in Kirkland, Washington (WA) Detailed Stats
Data:
Races - White alone (%)
Races - White alone (% change since 2000)
Races - Black alone (%)
Races - Black alone (% change since 2000)
Races - American Indian alone (%)
Races - American Indian alone (% change since 2000)
Races - Asian alone (%)
Races - Asian alone (% change since 2000)
Races - Hispanic (%)
Races - Hispanic (% change since 2000)
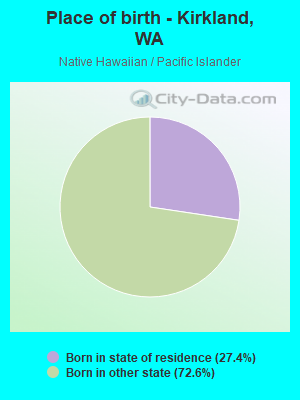
Races - Native Hawaiian and Other Pacific Islander alone (%)
Races - Native Hawaiian and Other Pacific Islander alone (% change since 2000)
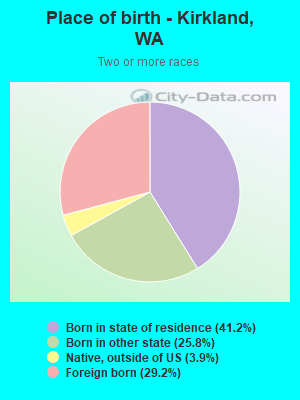
Races - Two or more races(%)
Races - Two or more races(% change since 2000)
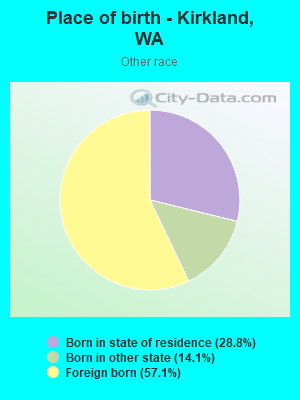
Races - Other race alone (%)
Races - Other race alone (% change since 2000)
Racial diversity
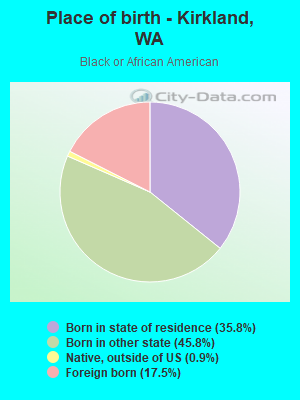
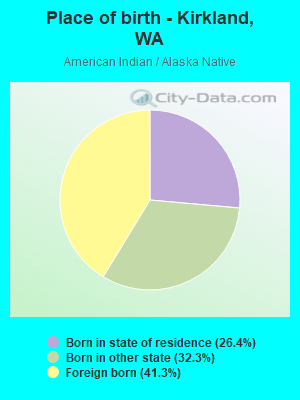
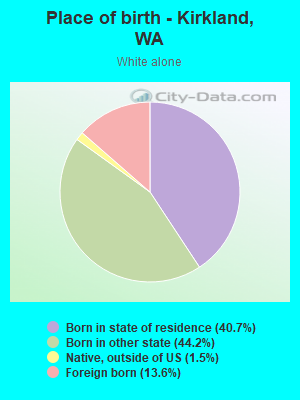
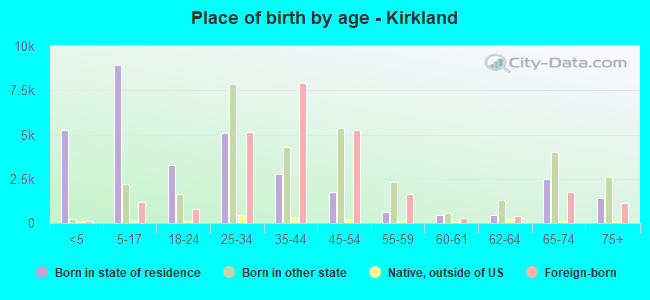
Place of birth - Born in state of residence (%)
Place of birth - Born in state of residence (%) - White
Place of birth - Born in state of residence (%) - Black or African American
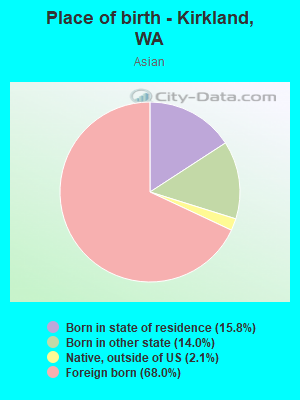
Place of birth - Born in state of residence (%) - Asian
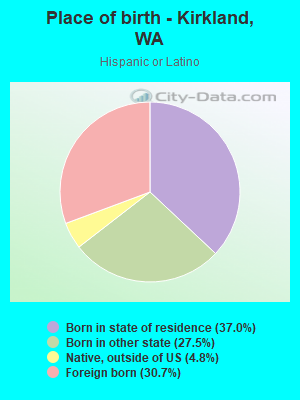
Place of birth - Born in state of residence (%) - Hispanic or Latino
Place of birth - Born in state of residence (%) - American Indian and Alaska Native
Place of birth - Born in state of residence (%) - Multirace
Place of birth - Born in state of residence (%) - Other Race
Place of birth - Born in other state (%)
Place of birth - Born in other state (%) - White
Place of birth - Born in other state (%) - Black or African American
Place of birth - Born in other state (%) - Asian
Place of birth - Born in other state (%) - Hispanic or Latino
Place of birth - Born in other state (%) - American Indian and Alaska Native
Place of birth - Born in other state (%) - Multirace
Place of birth - Born in other state (%) - Other Race
Place of birth - Native, outside of US (%)
Place of birth - Native, outside of US (%) - White
Place of birth - Native, outside of US (%) - Black or African American
Place of birth - Native, outside of US (%) - Asian
Place of birth - Native, outside of US (%) - Hispanic or Latino
Place of birth - Native, outside of US (%) - American Indian and Alaska Native
Place of birth - Native, outside of US (%) - Multirace
Place of birth - Native, outside of US (%) - Other Race
Place of birth - Foreign born (%)
Place of birth - Foreign born (%) - White
Place of birth - Foreign born (%) - Black or African American
Place of birth - Foreign born (%) - Asian
Place of birth - Foreign born (%) - Hispanic or Latino
Place of birth - Foreign born (%) - American Indian and Alaska Native
Place of birth - Foreign born (%) - Multirace
Place of birth - Foreign born (%) - Other Race
Residents speaking English at home (%)
Residents speaking English at home - Born in the United States (%)
Residents speaking English at home - Native, born elsewhere (%)
Residents speaking English at home - Foreign born (%)
Residents speaking Spanish at home (%)
Residents speaking Spanish at home - Born in the United States (%)
Residents speaking Spanish at home - Native, born elsewhere (%)
Residents speaking Spanish at home - Foreign born (%)
Residents speaking other language at home (%)
Residents speaking other language at home - Born in the United States (%)
Residents speaking other language at home - Native, born elsewhere (%)
Residents speaking other language at home - Foreign born (%)
Marital status - Never married (%)
Marital status - Now married (%)
Marital status - Separated (%)
Marital status - Widowed (%)
Marital status - Divorced (%)
Ancestries Reported - Arab (%)
Ancestries Reported - Czech (%)
Ancestries Reported - Danish (%)
Ancestries Reported - Dutch (%)
Ancestries Reported - English (%)
Ancestries Reported - French (%)
Ancestries Reported - French Canadian (%)
Ancestries Reported - German (%)
Ancestries Reported - Greek (%)
Ancestries Reported - Hungarian (%)
Ancestries Reported - Irish (%)
Ancestries Reported - Italian (%)
Ancestries Reported - Lithuanian (%)
Ancestries Reported - Norwegian (%)
Ancestries Reported - Polish (%)
Ancestries Reported - Portuguese (%)
Ancestries Reported - Russian (%)
Ancestries Reported - Scotch-Irish (%)
Ancestries Reported - Scottish (%)
Ancestries Reported - Slovak (%)
Ancestries Reported - Subsaharan African (%)
Ancestries Reported - Swedish (%)
Ancestries Reported - Swiss (%)
Ancestries Reported - Ukrainian (%)
Ancestries Reported - United States (%)
Ancestries Reported - Welsh (%)
Ancestries Reported - West Indian (%)
Ancestries Reported - Other (%)
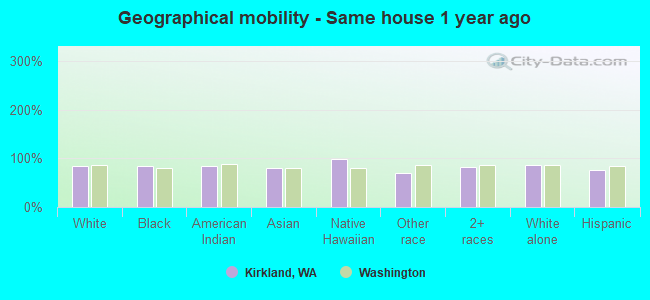
Geographical mobility - Same house 1 year ago (%)
Geographical mobility - Same house 1 year ago (%) - White
Geographical mobility - Same house 1 year ago (%) - Black or African American
Geographical mobility - Same house 1 year ago (%) - Asian
Geographical mobility - Same house 1 year ago (%) - Hispanic or Latino
Geographical mobility - Same house 1 year ago (%) - American Indian and Alaska Native
Geographical mobility - Same house 1 year ago (%) - Multirace
Geographical mobility - Same house 1 year ago (%) - Other Race
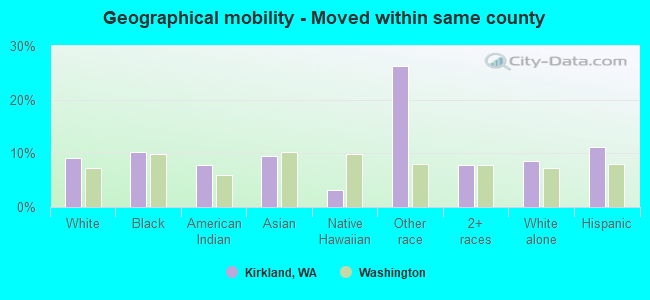
Geographical mobility - Moved within same county (%)
Geographical mobility - Moved within same county (%) - White
Geographical mobility - Moved within same county (%) - Black or African American
Geographical mobility - Moved within same county (%) - Asian
Geographical mobility - Moved within same county (%) - Hispanic or Latino
Geographical mobility - Moved within same county (%) - American Indian and Alaska Native
Geographical mobility - Moved within same county (%) - Multirace
Geographical mobility - Moved within same county (%) - Other Race
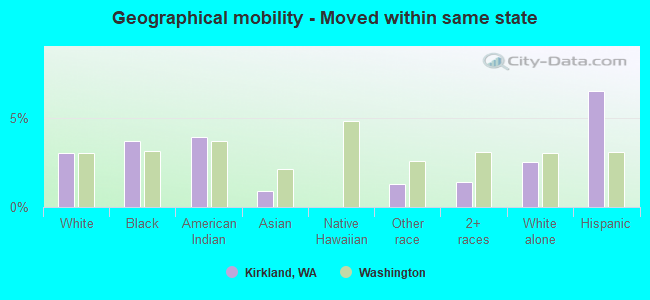
Geographical mobility - Moved from different county within same state (%)
Geographical mobility - Moved from different county within same state (%) - White
Geographical mobility - Moved from different county within same state (%) - Black or African American
Geographical mobility - Moved from different county within same state (%) - Asian
Geographical mobility - Moved from different county within same state (%) - Hispanic or Latino
Geographical mobility - Moved from different county within same state (%) - American Indian and Alaska Native
Geographical mobility - Moved from different county within same state (%) - Multirace
Geographical mobility - Moved from different county within same state (%) - Other Race
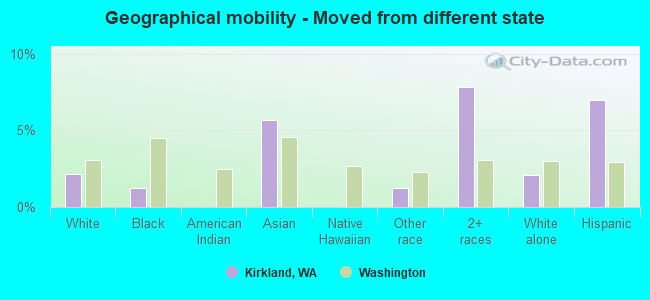
Geographical mobility - Moved from different state (%)
Geographical mobility - Moved from different state (%) - White
Geographical mobility - Moved from different state (%) - Black or African American
Geographical mobility - Moved from different state (%) - Asian
Geographical mobility - Moved from different state (%) - Hispanic or Latino
Geographical mobility - Moved from different state (%) - American Indian and Alaska Native
Geographical mobility - Moved from different state (%) - Multirace
Geographical mobility - Moved from different state (%) - Other Race
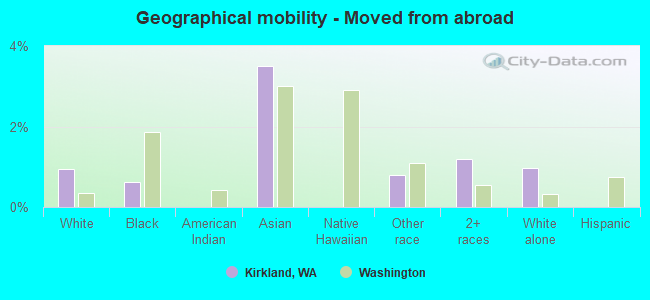
Geographical mobility - Moved from abroad (%)
Geographical mobility - Moved from abroad (%) - White
Geographical mobility - Moved from abroad (%) - Black or African American
Geographical mobility - Moved from abroad (%) - Asian
Geographical mobility - Moved from abroad (%) - Hispanic or Latino
Geographical mobility - Moved from abroad (%) - American Indian and Alaska Native
Geographical mobility - Moved from abroad (%) - Multirace
Geographical mobility - Moved from abroad (%) - Other Race
Place of birth for the foreign-born population - Ireland (%)
Place of birth for the foreign-born population - Denmark (%)
Place of birth for the foreign-born population - Norway (%)
Place of birth for the foreign-born population - Sweden (%)
Place of birth for the foreign-born population - United Kingdom (%)
Place of birth for the foreign-born population - England (%)
Place of birth for the foreign-born population - Scotland (%)
Place of birth for the foreign-born population - Other Northern Europe (%)
Place of birth for the foreign-born population - Austria (%)
Place of birth for the foreign-born population - Belgium (%)
Place of birth for the foreign-born population - France (%)
Place of birth for the foreign-born population - Germany (%)
Place of birth for the foreign-born population - Netherlands (%)
Place of birth for the foreign-born population - Switzerland (%)
Place of birth for the foreign-born population - Other Western Europe (%)
Place of birth for the foreign-born population - Greece (%)
Place of birth for the foreign-born population - Italy (%)
Place of birth for the foreign-born population - Portugal (%)
Place of birth for the foreign-born population - Spain (%)
Place of birth for the foreign-born population - Other Southern Europe (%)
Place of birth for the foreign-born population - Albania (%)
Place of birth for the foreign-born population - Belarus (%)
Place of birth for the foreign-born population - Bosnia and Herzegovina (%)
Place of birth for the foreign-born population - Bulgaria (%)
Place of birth for the foreign-born population - Croatia (%)
Place of birth for the foreign-born population - Czechoslovakia (%)
Place of birth for the foreign-born population - Hungary (%)
Place of birth for the foreign-born population - Latvia (%)
Place of birth for the foreign-born population - Lithuania (%)
Place of birth for the foreign-born population - North Macedonia (Macedonia) (%)
Place of birth for the foreign-born population - Moldova (%)
Place of birth for the foreign-born population - Poland (%)
Place of birth for the foreign-born population - Romania (%)
Place of birth for the foreign-born population - Russia (%)
Place of birth for the foreign-born population - Serbia (%)
Place of birth for the foreign-born population - Ukraine (%)
Place of birth for the foreign-born population - Other Eastern Europe (%)
Place of birth for the foreign-born population - China (%)
Place of birth for the foreign-born population - Hong Kong (%)
Place of birth for the foreign-born population - Taiwan (%)
Place of birth for the foreign-born population - Japan (%)
Place of birth for the foreign-born population - Korea (%)
Place of birth for the foreign-born population - Other Eastern Asia (%)
Place of birth for the foreign-born population - Afghanistan (%)
Place of birth for the foreign-born population - Bangladesh (%)
Place of birth for the foreign-born population - India (%)
Place of birth for the foreign-born population - Iran (%)
Place of birth for the foreign-born population - Kazakhstan (%)
Place of birth for the foreign-born population - Nepal (%)
Place of birth for the foreign-born population - Pakistan (%)
Place of birth for the foreign-born population - Sri Lanka (%)
Place of birth for the foreign-born population - Uzbekistan (%)
Place of birth for the foreign-born population - Other South Central Asia (%)
Place of birth for the foreign-born population - Burma (%)
Place of birth for the foreign-born population - Cambodia (%)
Place of birth for the foreign-born population - Indonesia (%)
Place of birth for the foreign-born population - Laos (%)
Place of birth for the foreign-born population - Malaysia (%)
Place of birth for the foreign-born population - Philippines (%)
Place of birth for the foreign-born population - Singapore (%)
Place of birth for the foreign-born population - Thailand (%)
Place of birth for the foreign-born population - Vietnam (%)
Place of birth for the foreign-born population - Other South Eastern Asia (%)
Place of birth for the foreign-born population - Armenia (%)
Place of birth for the foreign-born population - Iraq (%)
Place of birth for the foreign-born population - Israel (%)
Place of birth for the foreign-born population - Jordan (%)
Place of birth for the foreign-born population - Kuwait (%)
Place of birth for the foreign-born population - Lebanon (%)
Place of birth for the foreign-born population - Saudi Arabia (%)
Place of birth for the foreign-born population - Syria (%)
Place of birth for the foreign-born population - Turkey (%)
Place of birth for the foreign-born population - Yemen (%)
Place of birth for the foreign-born population - Other Western Asia (%)
Place of birth for the foreign-born population - Eritrea (%)
Place of birth for the foreign-born population - Ethiopia (%)
Place of birth for the foreign-born population - Kenya (%)
Place of birth for the foreign-born population - Somalia (%)
Place of birth for the foreign-born population - Uganda (%)
Place of birth for the foreign-born population - Zimbabwe (%)
Place of birth for the foreign-born population - Other Eastern Africa (%)
Place of birth for the foreign-born population - Cameroon (%)
Place of birth for the foreign-born population - Congo (%)
Place of birth for the foreign-born population - Democratic Republic of Congo (Zaire) (%)
Place of birth for the foreign-born population - Other Middle Africa (%)
Place of birth for the foreign-born population - Egypt (%)
Place of birth for the foreign-born population - Morocco (%)
Place of birth for the foreign-born population - Sudan (%)
Place of birth for the foreign-born population - Other Northern Africa (%)
Place of birth for the foreign-born population - South Africa (%)
Place of birth for the foreign-born population - Other Southern Africa (%)
Place of birth for the foreign-born population - Cabo Verde (%)
Place of birth for the foreign-born population - Ghana (%)
Place of birth for the foreign-born population - Liberia (%)
Place of birth for the foreign-born population - Nigeria (%)
Place of birth for the foreign-born population - Senegal (%)
Place of birth for the foreign-born population - Sierra Leone (%)
Place of birth for the foreign-born population - Other Western Africa (%)
Place of birth for the foreign-born population - Australia (%)
Place of birth for the foreign-born population - New Zealand (%)
Place of birth for the foreign-born population - Fiji (%)
Place of birth for the foreign-born population - Micronesia (%)
Place of birth for the foreign-born population - Bahamas (%)
Place of birth for the foreign-born population - Barbados (%)
Place of birth for the foreign-born population - Cuba (%)
Place of birth for the foreign-born population - Dominica (%)
Place of birth for the foreign-born population - Dominican Republic (%)
Place of birth for the foreign-born population - Grenada (%)
Place of birth for the foreign-born population - Haiti (%)
Place of birth for the foreign-born population - Jamaica (%)
Place of birth for the foreign-born population - St. Vincent and the Grenadines (%)
Place of birth for the foreign-born population - Trinidad and Tobago (%)
Place of birth for the foreign-born population - West Indies (%)
Place of birth for the foreign-born population - Other Caribbean (%)
Place of birth for the foreign-born population - Belize (%)
Place of birth for the foreign-born population - Costa Rica (%)
Place of birth for the foreign-born population - El Salvador (%)
Place of birth for the foreign-born population - Guatemala (%)
Place of birth for the foreign-born population - Honduras (%)
Place of birth for the foreign-born population - Mexico (%)
Place of birth for the foreign-born population - Nicaragua (%)
Place of birth for the foreign-born population - Panama (%)
Place of birth for the foreign-born population - Other Central America (%)
Place of birth for the foreign-born population - Argentina (%)
Place of birth for the foreign-born population - Bolivia (%)
Place of birth for the foreign-born population - Brazil (%)
Place of birth for the foreign-born population - Chile (%)
Place of birth for the foreign-born population - Colombia (%)
Place of birth for the foreign-born population - Ecuador (%)
Place of birth for the foreign-born population - Guyana (%)
Place of birth for the foreign-born population - Peru (%)
Place of birth for the foreign-born population - Uruguay (%)
Place of birth for the foreign-born population - Venezuela (%)
Place of birth for the foreign-born population - Other South America (%)
Place of birth for the foreign-born population - Canada (%)
Place of birth for the foreign-born population - Other Northern America (%)
Place of birth for the foreign-born population - Other (%)
Latest news about races in Kirkland, WA collected exclusively by city-data.com from local newspapers, TV, and radio stations
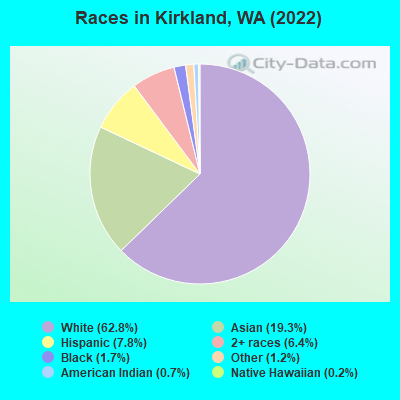
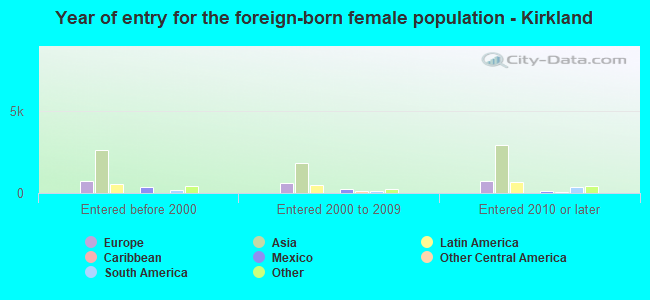
According to 2022 data, the most numerous races in Kirkland, WA are White alone (57,852 residents), Hispanic (7,157 residents), and Asian alone (17,794 residents). 69.1% of Kirkland residents speak English at home. 25.4% of Kirkland, WA residents are foreign-born (13.8% born in Asia, 4.6% born in Europe, 3.9% born in Latin America), which is 40.9% greater than the foreign-born rate of 15.0% across the entire state of Washington.
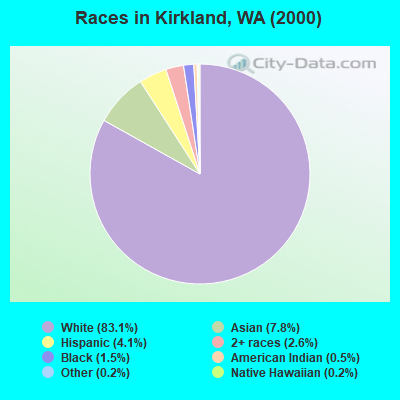
Race distribution in Kirkland
2000 2022
37,438 83.1% White alone 3,497 7.8% Asian alone 1,852 4.1% Hispanic 1,178 2.6% Two or more races 688 1.5% Black alone 211 0.5% American Indian alone 83 0.2% Native Hawaiian and Other 107 0.2% Other race alone
57,852 62.8% White alone 17,794 19.3% Asian alone 7,157 7.8% Hispanic 5,916 6.4% Two or more races 1,536 1.7% Black alone 1,062 1.2% Other race alone 641 0.7% American Indian alone 197 0.2% Native Hawaiian and Other
2000 2022
4,652,490 78.9% White alone 441,509 7.5% Hispanic 319,401 5.4% Asian alone 184,631 3.1% Black alone 175,926 3.0% Two or more races 85,396 1.4% American Indian alone 22,779 0.4% Native Hawaiian and Other 11,989 0.2% Other race alone
4,941,456 63.5% White alone 1,093,313 14.0% Hispanic 755,832 9.7% Asian alone 523,448 6.7% Two or more races 299,537 3.8% Black alone 69,024 0.9% American Indian alone 52,231 0.7% Native Hawaiian and Other 50,945 0.7% Other race alone
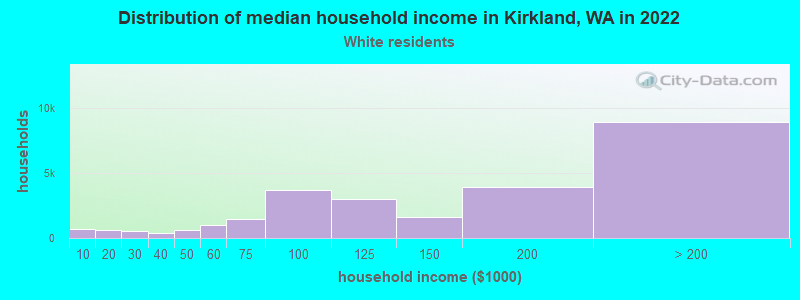
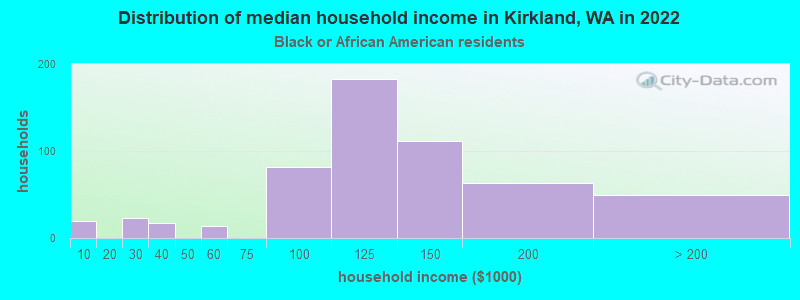
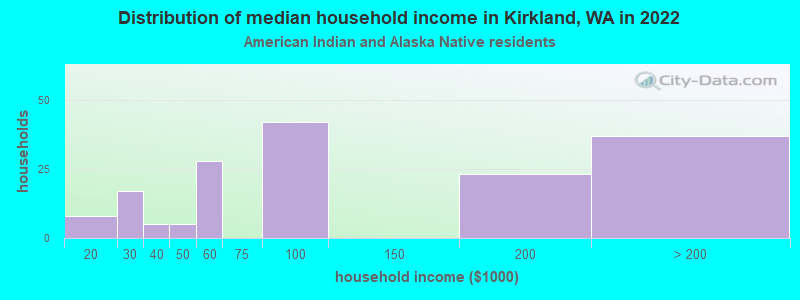
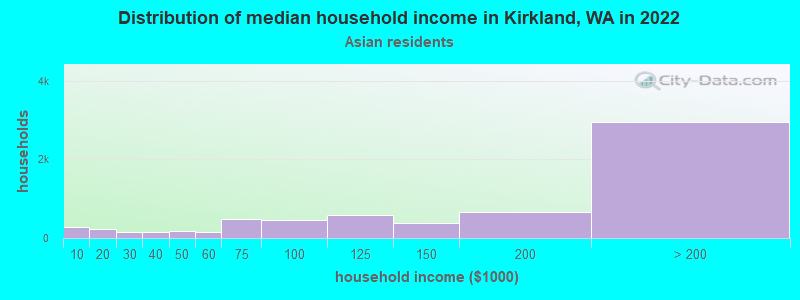
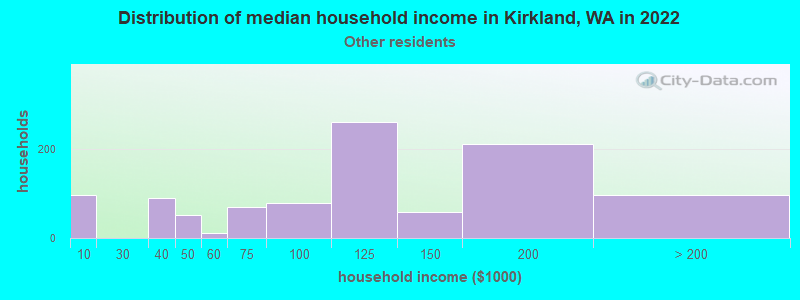
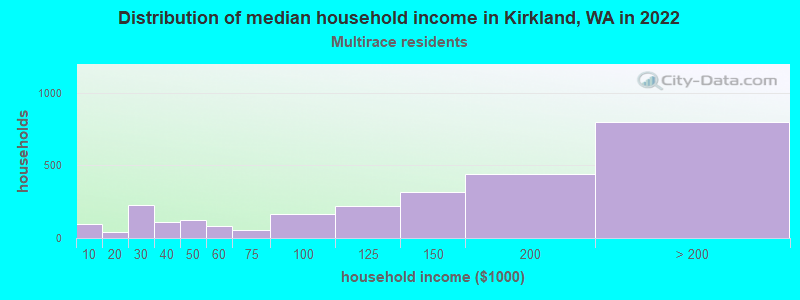
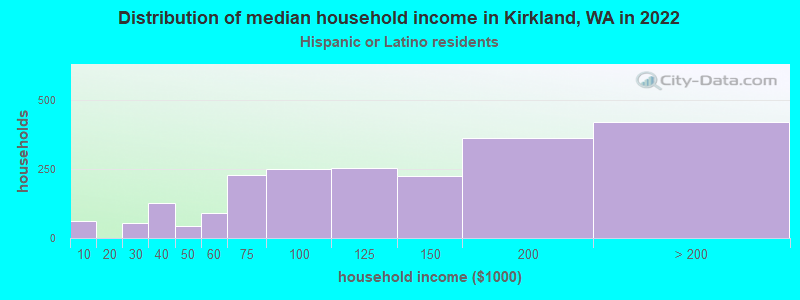
Income and house value in Kirkland Median household income in 2022 $146,610 White non-Hispanic householders$130,096 Black householders$125,938 Asian householders$111,227 Some other race householders$146,366 Two or more races householders$110,561 Hispanic or Latino race householdersMedian 2022 house value over $1,000,000 White Non-Hispanic householdersover $1,000,000 Black or African American householdersover $1,000,000 American Indian or Alaska Native householders over $1,000,000 Asian householders$981,497 Some other race householdersover $1,000,000 Two or more races householders$894,190 Hispanic or Latino householders
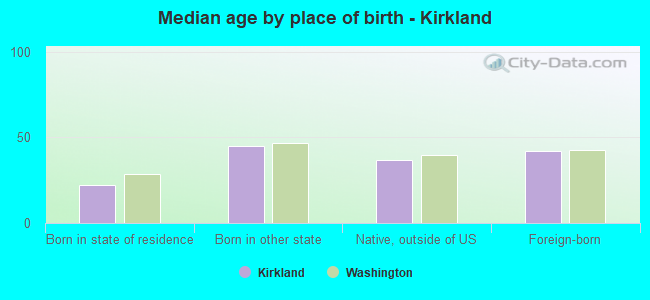
Median age by race in Kirkland
40.6 Median age for White residents40.1 43.0 28.9 Median age for Black or African American residents30.2 26.4 42.2 Median age for American Indian / Alaska Native residents41.1 43.2 35.8 Median age for Asian residents34.5 36.5 69.7 Median age for Native Hawaiian / Pacific Islander residents-666,666,666.0 -666,666,666.0 26.7 Median age for Other race residents21.8 30.0 27.9 Median age for Two or more races residents33.3 25.5 40.9 Median age for White alone residents40.3 43.2 26.8 Median age for Hispanic or Latino residents27.0 26.6
Owner/renter occupied households by race in Kirkland
House owners and renters - White residents 16,720 63.3% Owner occupied9,697 36.7% Renter occupiedHouse owners and renters - Black or African American residents 164 29.8% Owner occupied386 70.2% Renter occupiedHouse owners and renters - American Indian / Alaska Native residents 55 29.4% Owner occupied131 70.6% Renter occupiedHouse owners and renters - Asian residents 5,221 65.8% Owner occupied2,711 34.2% Renter occupiedHouse owners and renters - Native Hawaiian / Pacific Islander residents 47 100.0% Owner occupiedHouse owners and renters - Other race residents 315 34.8% Owner occupied592 65.2% Renter occupiedHouse owners and renters - Two or more races residents 1,638 54.5% Owner occupied1,369 45.5% Renter occupiedHouse owners and renters - White alone residents 16,506 63.6% Owner occupied9,466 36.4% Renter occupiedHouse owners and renters - Hispanic or Latino residents 1,210 42.7% Owner occupied1,624 57.3% Renter occupied
Language usage in Kirkland
English speakers - Total 69.1% of residents of Kirkland speak English at home.
4.2% of residents speak Spanish at home 2,339 64.3% Speak English very well1,301 35.7% Speak English less than very well26.7% of residents speak other language at home 15,983 69.3% Speak English very well7,088 30.7% Speak English less than very well
English speakers - Born in the United States 92.3% of residents of Kirkland speak English at home.
2.1% of residents speak Spanish at home 595 89.6% Speak English very well69 10.4% Speak English less than very well5.6% of residents speak other language at home 1,678 93.3% Speak English very well121 6.7% Speak English less than very well
English speakers - Native, born elsewhere 85.0% of residents of Kirkland speak English at home.
12.2% of residents speak Spanish at home 196 100.0% Speak English very well2.7% of residents speak other language at home 44 100.0% Speak English very well
English speakers - Foreign-born 17.7% of residents of Kirkland speak English at home.
7.9% of residents speak Spanish at home 1,082 53.9% Speak English very well926 46.1% Speak English less than very well74.4% of residents speak other language at home 12,280 64.9% Speak English very well6,631 35.1% Speak English less than very well
White (Caucasian) - Speak only English Native:
94.6% (45,645)Foreign-born:
24.9% (2,024)
White (Caucasian) - Speak another language Native:
5.4% (2,611)Foreign-born:
75.1% (6,103)
Black or African American - Speak only English Native:
99.4% (1,154)Foreign-born:
43.9% (106)
Black or African American - Speak another language Native:
1.0% (11)Foreign-born:
60.8% (147)
American Indian / Alaska Native - Speak another language Native:
24.3% (81)Foreign-born:
100.0% (238)
Asian - Speak only English Native:
60.8% (2,709)Foreign-born:
15.4% (1,886)
Asian - Speak another language Native:
39.2% (1,746)Foreign-born:
84.6% (10,348)
Other race - Speak only English Native:
38.3% (655)Foreign-born:
6.0% (92)
Other race - Speak another language Native:
61.5% (1,054)Foreign-born:
93.9% (1,451)
Two or more races - Speak only English Native:
83.6% (4,334)Foreign-born:
20.4% (506)
Two or more races - Speak another language Native:
16.4% (848)Foreign-born:
79.6% (1,975)
White alone - Speak only English Native:
95.2% (45,200)Foreign-born:
24.8% (1,947)
White alone - Speak another language Native:
4.8% (2,292)Foreign-born:
75.2% (5,899)
Hispanic or Latino - Speak only English Native:
64.1% (2,431)Foreign-born:
5.6% (123)
Hispanic or Latino - Speak another language Native:
35.9% (1,363)Foreign-born:
94.4% (2,073)
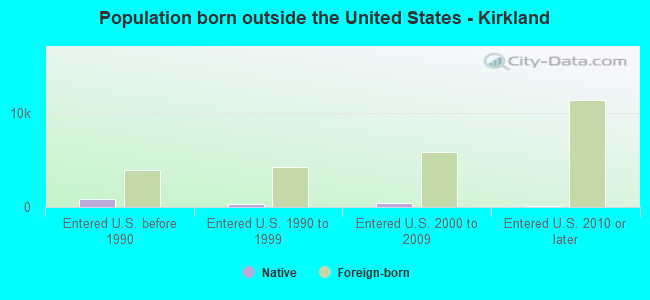
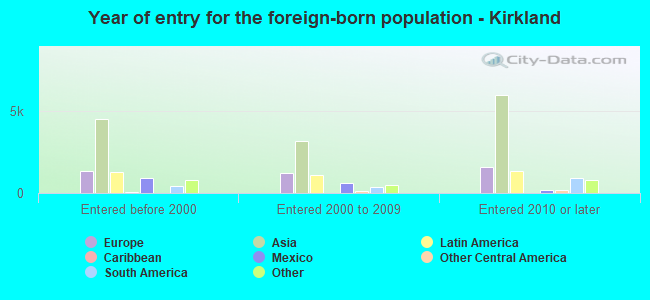
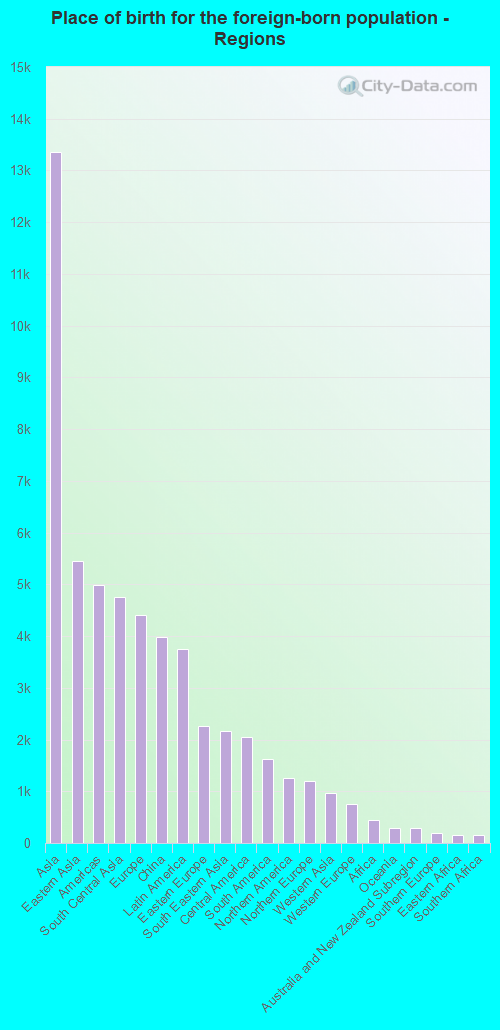
Foreign-born residents in Kirkland 23,491 residents are foreign born (13.8% Asia , 4.6% Europe , 3.9% Latin America ).
This city:
25.4%Washington:
14.9%
Marital status for residents in Kirkland Marital status - White (Caucasian) population 15 years and over
Males 35.8% Never married50.5% Now married0.0% Separated2.0% Widowed11.7% DivorcedFemales 26.1% Never married50.5% Now married0.7% Separated5.8% Widowed16.9% DivorcedWomen who gave birth in the past 12 months Now married:
82.7% (434)Unmarried:
17.3% (91)
Women who did not give birth in the past 12 months Now married:
48.6% (6,191)Unmarried:
51.4% (6,560)
Marital status - Black or African American population 15 years and over
Males 51.3% Never married31.1% Now married3.0% Separated0.0% Widowed14.6% DivorcedFemales 79.3% Never married15.9% Now married0.0% Separated3.1% Widowed1.7% DivorcedWomen who gave birth in the past 12 months Now married:
0.0% (0)Unmarried:
100.0% (58)
Women who did not give birth in the past 12 months Now married:
13.9% (48)Unmarried:
86.1% (296)
Marital status - American Indian / Alaska Native population 15 years and over
Males 47.5% Never married52.5% Now married0.0% Separated0.0% Widowed0.0% DivorcedFemales 23.8% Never married40.7% Now married0.3% Separated13.4% Widowed21.7% DivorcedWomen who gave birth in the past 12 months Now married:
100.0% (18)Unmarried:
0.0% (0)
Women who did not give birth in the past 12 months Now married:
44.4% (66)Unmarried:
55.6% (83)
Marital status - Asian population 15 years and over
Males 35.7% Never married59.9% Now married0.0% Separated0.0% Widowed4.3% DivorcedFemales 28.7% Never married55.0% Now married0.0% Separated4.1% Widowed12.1% DivorcedWomen who gave birth in the past 12 months Now married:
100.0% (316)Unmarried:
0.0% (0)
Women who did not give birth in the past 12 months Now married:
51.6% (2,986)Unmarried:
48.4% (2,800)
Marital status - Native Hawaiian / Pacific Islander population 15 years and over
Males 0.0% Never married100.0% Now married0.0% Separated0.0% Widowed0.0% DivorcedFemales 5.0% Never married95.0% Now married0.0% Separated0.0% Widowed0.0% DivorcedWomen who did not give birth in the past 12 months Now married:
92.9% (28)Unmarried:
7.1% (2)
Marital status - Other race population 15 years and over
Males 47.5% Never married52.5% Now married0.0% Separated0.0% Widowed0.0% DivorcedFemales 35.2% Never married55.6% Now married0.0% Separated2.1% Widowed7.1% DivorcedWomen who gave birth in the past 12 months Now married:
100.0% (25)Unmarried:
0.0% (0)
Women who did not give birth in the past 12 months Now married:
47.1% (507)Unmarried:
52.9% (570)
Marital status - Two or more races population 15 years and over
Males 32.5% Never married55.1% Now married0.0% Separated0.0% Widowed12.4% DivorcedFemales 38.1% Never married45.9% Now married1.7% Separated2.0% Widowed12.4% DivorcedWomen who gave birth in the past 12 months Now married:
100.0% (34)Unmarried:
0.0% (0)
Women who did not give birth in the past 12 months Now married:
46.7% (820)Unmarried:
53.3% (936)
Marital status - White alone, not Hispanic / Latino population 15 years and over
Males 35.6% Never married50.6% Now married0.0% Separated2.0% Widowed11.8% DivorcedFemales 26.3% Never married50.5% Now married0.7% Separated5.6% Widowed16.9% DivorcedWomen who gave birth in the past 12 months Now married:
82.7% (434)Unmarried:
17.3% (91)
Women who did not give birth in the past 12 months Now married:
48.3% (6,053)Unmarried:
51.7% (6,484)
Marital status - Hispanic or Latino population 15 years and over
Males 44.6% Never married37.4% Now married0.0% Separated0.0% Widowed18.0% DivorcedFemales 35.1% Never married47.2% Now married0.0% Separated4.4% Widowed13.3% DivorcedWomen who gave birth in the past 12 months Now married:
100.0% (28)Unmarried:
0.0% (0)
Women who did not give birth in the past 12 months Now married:
50.5% (878)Unmarried:
49.5% (860)
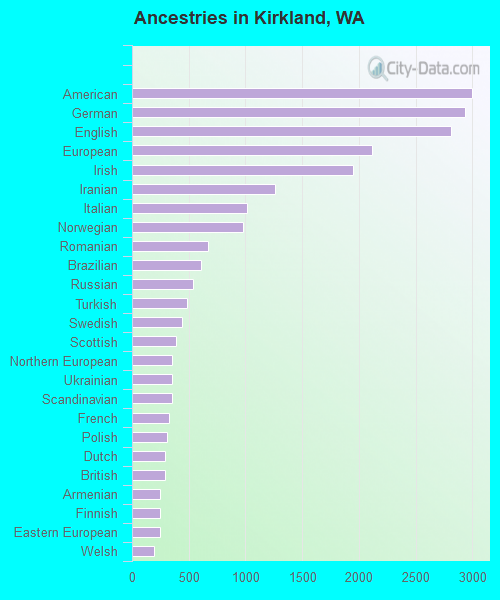
Ancestries in Kirkland
2,997 6.4% American2,938 6.3% German2,810 6.0% English2,114 4.5% European1,948 4.1% Irish1,257 2.7% Iranian1,018 2.2% Italian975 2.1% Norwegian666 1.4% Romanian611 1.3% Brazilian538 1.1% Russian483 1.0% Turkish443 0.9% Swedish387 0.8% Scottish356 0.8% Northern European353 0.8% Ukrainian353 0.8% Scandinavian325 0.7% French309 0.7% Polish291 0.6% Dutch289 0.6% British251 0.5% Armenian250 0.5% Finnish246 0.5% Eastern European197 0.4% Welsh184 0.4% Australian183 0.4% Canadian165 0.4% Iraqi144 0.3% Danish134 0.3% Yugoslavian133 0.3% Israeli133 0.3% Serbian124 0.3% Greek123 0.3% Arab115 0.2% Scotch-Irish111 0.2% Czech110 0.2% Nigerian89 0.2% French Canadian77 0.2% Egyptian67 0.1% Palestinian56 0.1% Austrian51 0.1% Czechoslovakian45 0.10% Lebanese41 0.09% Hungarian38 0.08% Portuguese36 0.08% Slovak34 0.07% Latvian32 0.07% Croatian31 0.07% Bulgarian31 0.07% Ethiopian30 0.06% Jamaican29 0.06% Swiss28 0.06% Jordanian28 0.06% African22 0.05% Slovene22 0.05% South African20 0.04% Guyanese19 0.04% Icelander15 0.03% Kenyan10 0.02% Pennsylvania German8 0.02% New Zealander7 0.01% Lithuanian5 0.01% Afghan5 0.01% Slavic4 0.01% Belgian4 0.01% West Indian3 0.01% Ghanaian
Geographical mobility in Kirkland Same house 1 year ago 49,590 84.7% White (Caucasian)1,204 84.7% Black or African American465 83.4% American Indian / Alaska Native14,384 80.4% Asian55 99.0% Native Hawaiian / Pacific Islander2,400 69.4% Other race6,909 81.7% Two or more races49,170 85.8% White alone, not Hispanic / Latino5,300 75.3% Hispanic or LatinoMoved within same county 5,368 9.2% White / Caucasian145 10.2% Black or African American44 7.8% American Indian / Alaska Native1,711 9.6% Asian2 3.2% Native Hawaiian / Pacific Islander906 26.2% Other race669 7.9% Two or more races4,943 8.6% White alone, not Hispanic / Latino787 11.2% Hispanic or LatinoMoved within same state 1,777 3.0% White / Caucasian53 3.7% Black or African American22 3.9% American Indian / Alaska Native161 0.9% Asian45 1.3% Other race118 1.4% Two or more races1,442 2.5% White alone, not Hispanic / Latino455 6.5% Hispanic or LatinoMoved from different state 1,277 2.2% White / Caucasian18 1.2% Black or African American1,018 5.7% Asian43 1.2% Other race661 7.8% Two or more races1,212 2.1% White alone, not Hispanic / Latino493 7.0% Hispanic or LatinoMoved from abroad 559 1.0% White9 0.6% Black or African American626 3.5% Asian28 0.8% Other race100 1.2% Two or more races559 1.0% White alone, not Hispanic / Latino
Children Nativity (place of birth) in Kirkland
Children under 6 years - Living with two parents Both parents native 2,225 100.0% NativeBoth parents foreign-born 1,989 78.6% Native542 21.4% Foreign-bornOne native, one foreign-born parent 1,070 100.0% NativeChildren under 6 years - Living with one parent Native parent 275 100.0% NativeForeign-born parent 787 100.0% NativeChildren 6 to 17 years - Living with two parents Both parents native 2,985 100.0% NativeBoth parents foreign-born 2,583 87.5% Native368 12.5% Foreign-bornOne native, one foreign-born parent 1,462 95.5% Native69 4.5% Foreign-bornChildren 6 to 17 years - Living with one parent Native parent 1,043 100.0% NativeForeign-born parent 1,812 53.0% Native1,609 47.0% Foreign-born
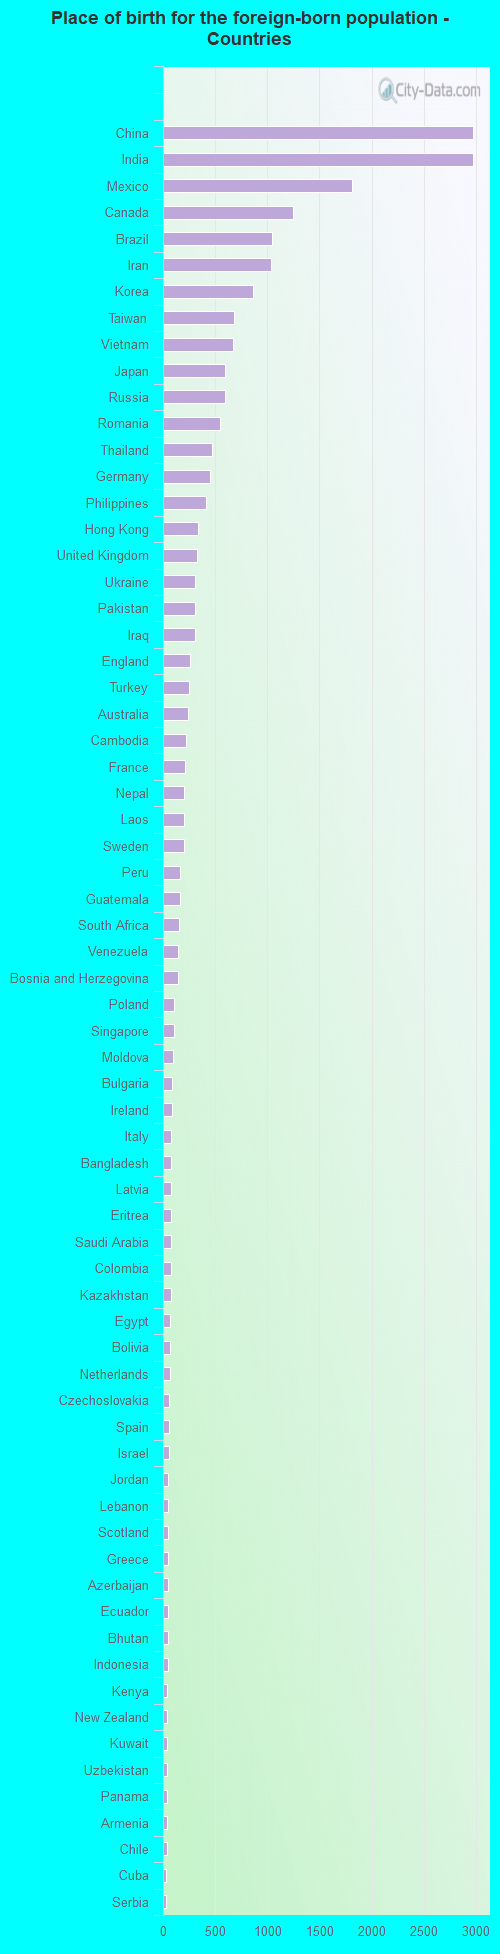
Place of birth for residents in Kirkland 13,354 Asia5,451 Eastern Asia4,994 Americas4,753 South Central Asia4,399 Europe3,991 China3,745 Latin America2,263 Eastern Europe2,165 South Eastern Asia2,043 Central America1,622 South America1,248 Northern America1,196 Northern Europe974 Western Asia754 Western Europe452 Africa290 Oceania283 Australia and New Zealand Subregion184 Southern Europe164 Eastern Africa163 Southern Africa79 Caribbean72 Northern Africa30 Western Africa9 Middle Africa2,976 China2,968 India1,811 Mexico1,248 Canada1,048 Brazil1,033 Iran866 Korea681 Taiwan675 Vietnam593 Japan590 Russia551 Romania473 Thailand448 Germany414 Philippines333 Hong Kong327 United Kingdom309 Ukraine305 Pakistan305 Iraq262 England254 Turkey242 Australia223 Cambodia207 France199 Nepal198 Laos198 Sweden167 Peru164 Guatemala149 South Africa147 Venezuela140 Bosnia and Herzegovina101 Poland101 Singapore95 Moldova87 Bulgaria85 Ireland79 Italy79 Bangladesh78 Latvia78 Eritrea74 Saudi Arabia74 Colombia73 Kazakhstan71 Egypt68 Bolivia66 Netherlands61 Czechoslovakia58 Spain57 Israel52 Jordan52 Lebanon48 Scotland46 Greece46 Azerbaijan46 Ecuador45 Bhutan44 Indonesia42 Kenya40 New Zealand39 Kuwait39 Uzbekistan39 Panama38 Armenia35 Chile29 Cuba28 Serbia27 Jamaica27 El Salvador24 Malaysia24 Ethiopia24 Hungary22 Syria20 Guyana19 Belarus17 Switzerland16 United Arab Emirates14 Belgium14 Trinidad and Tobago13 Denmark12 Argentina10 Burma (Myanmar)9 Democratic Republic of Congo (Zaire)9 Nigeria8 St. Lucia8 Afghanistan7 Fiji5 Ivory Coast5 Norway3 Sierra Leone1 Algeria
Grandparents responsible for own grandchildren in Kirkland
Grandparents (30 to 59 years) White / Caucasian 62 35.4% Responsible for grandchildren112 64.6% Not responsible for grandchildrenBlack or African American 10 100.0% Responsible for grandchildrenAmerican Indian / Alaska Native 1 69.6% Not responsible for grandchildrenAsian 3 8.6% Responsible for grandchildren26 91.4% Not responsible for grandchildrenWhite alone, not Hispanic / Latino 61 36.2% Responsible for grandchildren107 63.8% Not responsible for grandchildrenHispanic or Latino 12 100.0% Not responsible for grandchildrenGrandparents (60 years and over) White / Caucasian 59 17.7% Responsible for grandchildren274 82.3% Not responsible for grandchildrenBlack or African American 49 100.0% Not responsible for grandchildrenAsian 82 24.8% Responsible for grandchildren248 75.2% Not responsible for grandchildrenWhite alone, not Hispanic / Latino 58 17.3% Responsible for grandchildren279 82.7% Not responsible for grandchildrenHispanic or Latino 87 100.0% Not responsible for grandchildren