Races in Kuna, Idaho (ID) Detailed Stats
Data:
Races - White alone (%)
Races - White alone (% change since 2000)
Races - Black alone (%)
Races - Black alone (% change since 2000)
Races - American Indian alone (%)
Races - American Indian alone (% change since 2000)
Races - Asian alone (%)
Races - Asian alone (% change since 2000)
Races - Hispanic (%)
Races - Hispanic (% change since 2000)
Races - Native Hawaiian and Other Pacific Islander alone (%)
Races - Native Hawaiian and Other Pacific Islander alone (% change since 2000)
Races - Two or more races(%)
Races - Two or more races(% change since 2000)
Races - Other race alone (%)
Races - Other race alone (% change since 2000)
Racial diversity
Place of birth - Born in state of residence (%)
Place of birth - Born in state of residence (%) - White
Place of birth - Born in state of residence (%) - Black or African American
Place of birth - Born in state of residence (%) - Asian
Place of birth - Born in state of residence (%) - Hispanic or Latino
Place of birth - Born in state of residence (%) - American Indian and Alaska Native
Place of birth - Born in state of residence (%) - Multirace
Place of birth - Born in state of residence (%) - Other Race
Place of birth - Born in other state (%)
Place of birth - Born in other state (%) - White
Place of birth - Born in other state (%) - Black or African American
Place of birth - Born in other state (%) - Asian
Place of birth - Born in other state (%) - Hispanic or Latino
Place of birth - Born in other state (%) - American Indian and Alaska Native
Place of birth - Born in other state (%) - Multirace
Place of birth - Born in other state (%) - Other Race
Place of birth - Native, outside of US (%)
Place of birth - Native, outside of US (%) - White
Place of birth - Native, outside of US (%) - Black or African American
Place of birth - Native, outside of US (%) - Asian
Place of birth - Native, outside of US (%) - Hispanic or Latino
Place of birth - Native, outside of US (%) - American Indian and Alaska Native
Place of birth - Native, outside of US (%) - Multirace
Place of birth - Native, outside of US (%) - Other Race
Place of birth - Foreign born (%)
Place of birth - Foreign born (%) - White
Place of birth - Foreign born (%) - Black or African American
Place of birth - Foreign born (%) - Asian
Place of birth - Foreign born (%) - Hispanic or Latino
Place of birth - Foreign born (%) - American Indian and Alaska Native
Place of birth - Foreign born (%) - Multirace
Place of birth - Foreign born (%) - Other Race
Residents speaking English at home (%)
Residents speaking English at home - Born in the United States (%)
Residents speaking English at home - Native, born elsewhere (%)
Residents speaking English at home - Foreign born (%)
Residents speaking Spanish at home (%)
Residents speaking Spanish at home - Born in the United States (%)
Residents speaking Spanish at home - Native, born elsewhere (%)
Residents speaking Spanish at home - Foreign born (%)
Residents speaking other language at home (%)
Residents speaking other language at home - Born in the United States (%)
Residents speaking other language at home - Native, born elsewhere (%)
Residents speaking other language at home - Foreign born (%)
Marital status - Never married (%)
Marital status - Now married (%)
Marital status - Separated (%)
Marital status - Widowed (%)
Marital status - Divorced (%)
Ancestries Reported - Arab (%)
Ancestries Reported - Czech (%)
Ancestries Reported - Danish (%)
Ancestries Reported - Dutch (%)
Ancestries Reported - English (%)
Ancestries Reported - French (%)
Ancestries Reported - French Canadian (%)
Ancestries Reported - German (%)
Ancestries Reported - Greek (%)
Ancestries Reported - Hungarian (%)
Ancestries Reported - Irish (%)
Ancestries Reported - Italian (%)
Ancestries Reported - Lithuanian (%)
Ancestries Reported - Norwegian (%)
Ancestries Reported - Polish (%)
Ancestries Reported - Portuguese (%)
Ancestries Reported - Russian (%)
Ancestries Reported - Scotch-Irish (%)
Ancestries Reported - Scottish (%)
Ancestries Reported - Slovak (%)
Ancestries Reported - Subsaharan African (%)
Ancestries Reported - Swedish (%)
Ancestries Reported - Swiss (%)
Ancestries Reported - Ukrainian (%)
Ancestries Reported - United States (%)
Ancestries Reported - Welsh (%)
Ancestries Reported - West Indian (%)
Ancestries Reported - Other (%)
Geographical mobility - Same house 1 year ago (%)
Geographical mobility - Same house 1 year ago (%) - White
Geographical mobility - Same house 1 year ago (%) - Black or African American
Geographical mobility - Same house 1 year ago (%) - Asian
Geographical mobility - Same house 1 year ago (%) - Hispanic or Latino
Geographical mobility - Same house 1 year ago (%) - American Indian and Alaska Native
Geographical mobility - Same house 1 year ago (%) - Multirace
Geographical mobility - Same house 1 year ago (%) - Other Race
Geographical mobility - Moved within same county (%)
Geographical mobility - Moved within same county (%) - White
Geographical mobility - Moved within same county (%) - Black or African American
Geographical mobility - Moved within same county (%) - Asian
Geographical mobility - Moved within same county (%) - Hispanic or Latino
Geographical mobility - Moved within same county (%) - American Indian and Alaska Native
Geographical mobility - Moved within same county (%) - Multirace
Geographical mobility - Moved within same county (%) - Other Race
Geographical mobility - Moved from different county within same state (%)
Geographical mobility - Moved from different county within same state (%) - White
Geographical mobility - Moved from different county within same state (%) - Black or African American
Geographical mobility - Moved from different county within same state (%) - Asian
Geographical mobility - Moved from different county within same state (%) - Hispanic or Latino
Geographical mobility - Moved from different county within same state (%) - American Indian and Alaska Native
Geographical mobility - Moved from different county within same state (%) - Multirace
Geographical mobility - Moved from different county within same state (%) - Other Race
Geographical mobility - Moved from different state (%)
Geographical mobility - Moved from different state (%) - White
Geographical mobility - Moved from different state (%) - Black or African American
Geographical mobility - Moved from different state (%) - Asian
Geographical mobility - Moved from different state (%) - Hispanic or Latino
Geographical mobility - Moved from different state (%) - American Indian and Alaska Native
Geographical mobility - Moved from different state (%) - Multirace
Geographical mobility - Moved from different state (%) - Other Race
Geographical mobility - Moved from abroad (%)
Geographical mobility - Moved from abroad (%) - White
Geographical mobility - Moved from abroad (%) - Black or African American
Geographical mobility - Moved from abroad (%) - Asian
Geographical mobility - Moved from abroad (%) - Hispanic or Latino
Geographical mobility - Moved from abroad (%) - American Indian and Alaska Native
Geographical mobility - Moved from abroad (%) - Multirace
Geographical mobility - Moved from abroad (%) - Other Race
Place of birth for the foreign-born population - Ireland (%)
Place of birth for the foreign-born population - Denmark (%)
Place of birth for the foreign-born population - Norway (%)
Place of birth for the foreign-born population - Sweden (%)
Place of birth for the foreign-born population - United Kingdom (%)
Place of birth for the foreign-born population - England (%)
Place of birth for the foreign-born population - Scotland (%)
Place of birth for the foreign-born population - Other Northern Europe (%)
Place of birth for the foreign-born population - Austria (%)
Place of birth for the foreign-born population - Belgium (%)
Place of birth for the foreign-born population - France (%)
Place of birth for the foreign-born population - Germany (%)
Place of birth for the foreign-born population - Netherlands (%)
Place of birth for the foreign-born population - Switzerland (%)
Place of birth for the foreign-born population - Other Western Europe (%)
Place of birth for the foreign-born population - Greece (%)
Place of birth for the foreign-born population - Italy (%)
Place of birth for the foreign-born population - Portugal (%)
Place of birth for the foreign-born population - Spain (%)
Place of birth for the foreign-born population - Other Southern Europe (%)
Place of birth for the foreign-born population - Albania (%)
Place of birth for the foreign-born population - Belarus (%)
Place of birth for the foreign-born population - Bosnia and Herzegovina (%)
Place of birth for the foreign-born population - Bulgaria (%)
Place of birth for the foreign-born population - Croatia (%)
Place of birth for the foreign-born population - Czechoslovakia (%)
Place of birth for the foreign-born population - Hungary (%)
Place of birth for the foreign-born population - Latvia (%)
Place of birth for the foreign-born population - Lithuania (%)
Place of birth for the foreign-born population - North Macedonia (Macedonia) (%)
Place of birth for the foreign-born population - Moldova (%)
Place of birth for the foreign-born population - Poland (%)
Place of birth for the foreign-born population - Romania (%)
Place of birth for the foreign-born population - Russia (%)
Place of birth for the foreign-born population - Serbia (%)
Place of birth for the foreign-born population - Ukraine (%)
Place of birth for the foreign-born population - Other Eastern Europe (%)
Place of birth for the foreign-born population - China (%)
Place of birth for the foreign-born population - Hong Kong (%)
Place of birth for the foreign-born population - Taiwan (%)
Place of birth for the foreign-born population - Japan (%)
Place of birth for the foreign-born population - Korea (%)
Place of birth for the foreign-born population - Other Eastern Asia (%)
Place of birth for the foreign-born population - Afghanistan (%)
Place of birth for the foreign-born population - Bangladesh (%)
Place of birth for the foreign-born population - India (%)
Place of birth for the foreign-born population - Iran (%)
Place of birth for the foreign-born population - Kazakhstan (%)
Place of birth for the foreign-born population - Nepal (%)
Place of birth for the foreign-born population - Pakistan (%)
Place of birth for the foreign-born population - Sri Lanka (%)
Place of birth for the foreign-born population - Uzbekistan (%)
Place of birth for the foreign-born population - Other South Central Asia (%)
Place of birth for the foreign-born population - Burma (%)
Place of birth for the foreign-born population - Cambodia (%)
Place of birth for the foreign-born population - Indonesia (%)
Place of birth for the foreign-born population - Laos (%)
Place of birth for the foreign-born population - Malaysia (%)
Place of birth for the foreign-born population - Philippines (%)
Place of birth for the foreign-born population - Singapore (%)
Place of birth for the foreign-born population - Thailand (%)
Place of birth for the foreign-born population - Vietnam (%)
Place of birth for the foreign-born population - Other South Eastern Asia (%)
Place of birth for the foreign-born population - Armenia (%)
Place of birth for the foreign-born population - Iraq (%)
Place of birth for the foreign-born population - Israel (%)
Place of birth for the foreign-born population - Jordan (%)
Place of birth for the foreign-born population - Kuwait (%)
Place of birth for the foreign-born population - Lebanon (%)
Place of birth for the foreign-born population - Saudi Arabia (%)
Place of birth for the foreign-born population - Syria (%)
Place of birth for the foreign-born population - Turkey (%)
Place of birth for the foreign-born population - Yemen (%)
Place of birth for the foreign-born population - Other Western Asia (%)
Place of birth for the foreign-born population - Eritrea (%)
Place of birth for the foreign-born population - Ethiopia (%)
Place of birth for the foreign-born population - Kenya (%)
Place of birth for the foreign-born population - Somalia (%)
Place of birth for the foreign-born population - Uganda (%)
Place of birth for the foreign-born population - Zimbabwe (%)
Place of birth for the foreign-born population - Other Eastern Africa (%)
Place of birth for the foreign-born population - Cameroon (%)
Place of birth for the foreign-born population - Congo (%)
Place of birth for the foreign-born population - Democratic Republic of Congo (Zaire) (%)
Place of birth for the foreign-born population - Other Middle Africa (%)
Place of birth for the foreign-born population - Egypt (%)
Place of birth for the foreign-born population - Morocco (%)
Place of birth for the foreign-born population - Sudan (%)
Place of birth for the foreign-born population - Other Northern Africa (%)
Place of birth for the foreign-born population - South Africa (%)
Place of birth for the foreign-born population - Other Southern Africa (%)
Place of birth for the foreign-born population - Cabo Verde (%)
Place of birth for the foreign-born population - Ghana (%)
Place of birth for the foreign-born population - Liberia (%)
Place of birth for the foreign-born population - Nigeria (%)
Place of birth for the foreign-born population - Senegal (%)
Place of birth for the foreign-born population - Sierra Leone (%)
Place of birth for the foreign-born population - Other Western Africa (%)
Place of birth for the foreign-born population - Australia (%)
Place of birth for the foreign-born population - New Zealand (%)
Place of birth for the foreign-born population - Fiji (%)
Place of birth for the foreign-born population - Micronesia (%)
Place of birth for the foreign-born population - Bahamas (%)
Place of birth for the foreign-born population - Barbados (%)
Place of birth for the foreign-born population - Cuba (%)
Place of birth for the foreign-born population - Dominica (%)
Place of birth for the foreign-born population - Dominican Republic (%)
Place of birth for the foreign-born population - Grenada (%)
Place of birth for the foreign-born population - Haiti (%)
Place of birth for the foreign-born population - Jamaica (%)
Place of birth for the foreign-born population - St. Vincent and the Grenadines (%)
Place of birth for the foreign-born population - Trinidad and Tobago (%)
Place of birth for the foreign-born population - West Indies (%)
Place of birth for the foreign-born population - Other Caribbean (%)
Place of birth for the foreign-born population - Belize (%)
Place of birth for the foreign-born population - Costa Rica (%)
Place of birth for the foreign-born population - El Salvador (%)
Place of birth for the foreign-born population - Guatemala (%)
Place of birth for the foreign-born population - Honduras (%)
Place of birth for the foreign-born population - Mexico (%)
Place of birth for the foreign-born population - Nicaragua (%)
Place of birth for the foreign-born population - Panama (%)
Place of birth for the foreign-born population - Other Central America (%)
Place of birth for the foreign-born population - Argentina (%)
Place of birth for the foreign-born population - Bolivia (%)
Place of birth for the foreign-born population - Brazil (%)
Place of birth for the foreign-born population - Chile (%)
Place of birth for the foreign-born population - Colombia (%)
Place of birth for the foreign-born population - Ecuador (%)
Place of birth for the foreign-born population - Guyana (%)
Place of birth for the foreign-born population - Peru (%)
Place of birth for the foreign-born population - Uruguay (%)
Place of birth for the foreign-born population - Venezuela (%)
Place of birth for the foreign-born population - Other South America (%)
Place of birth for the foreign-born population - Canada (%)
Place of birth for the foreign-born population - Other Northern America (%)
Place of birth for the foreign-born population - Other (%)
Latest news about races in Kuna, ID collected exclusively by city-data.com from local newspapers, TV, and radio stations
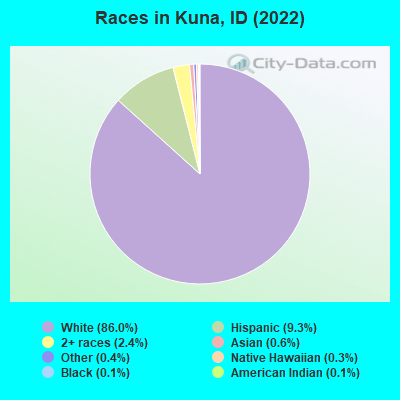
According to 2022 data, the most numerous races in Kuna, ID are White alone (22,283 residents), Hispanic (2,415 residents), and Two or more races (621 residents). 92.6% of Kuna residents speak English at home. 4.5% of Kuna, ID residents are foreign-born (3.8% born in Latin America), which is 11.8% less than the foreign-born rate of 5.0% across the entire state of Idaho.
Race distribution in Kuna
2000 2022
1,139,291 88.0% White alone 101,690 7.9% Hispanic 18,261 1.4% Two or more races 15,789 1.2% American Indian alone 11,641 0.9% Asian alone 4,889 0.4% Black alone 1,192 0.09% Other race alone 1,200 0.09% Native Hawaiian and Other
1,531,219 79.0% White alone 261,921 13.5% Hispanic 81,112 4.2% Two or more races 25,174 1.3% Asian alone 15,825 0.8% American Indian alone 11,868 0.6% Black alone 8,752 0.5% Other race alone 3,162 0.2% Native Hawaiian and Other
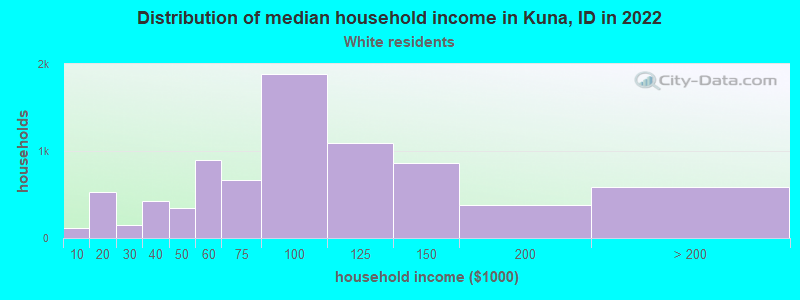
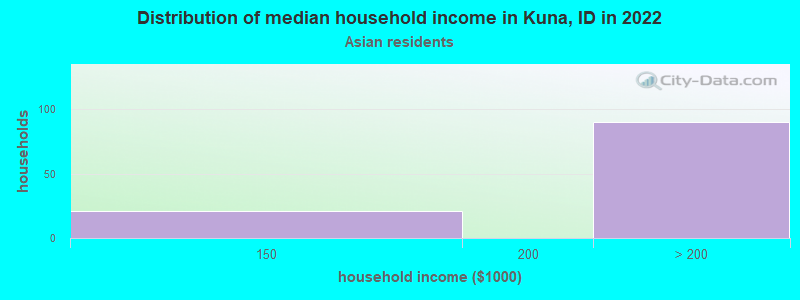
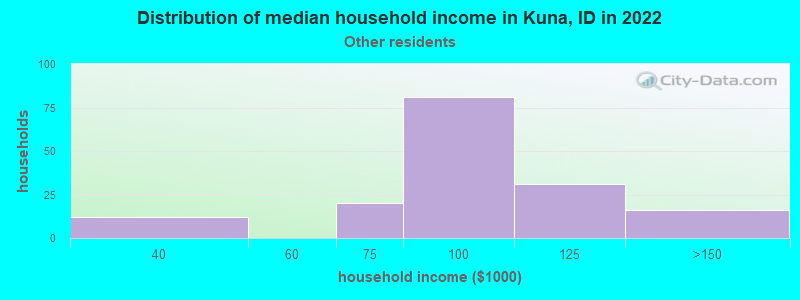
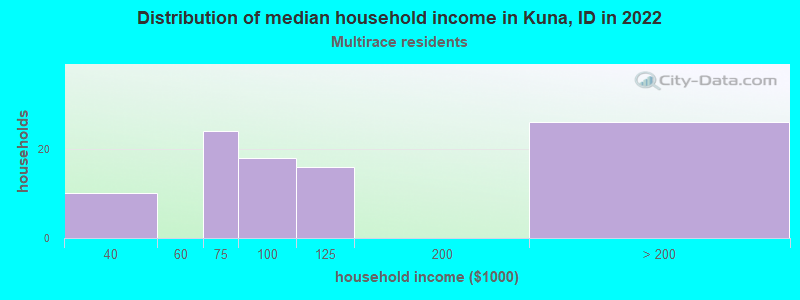
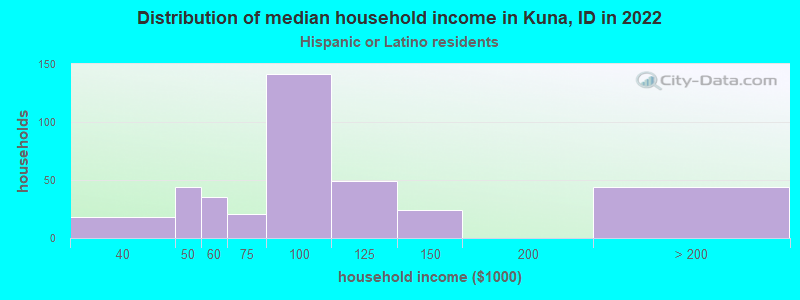
Income and house value in Kuna Median household income in 2022 $86,798 White non-Hispanic householders$88,804 Some other race householders$90,247 Hispanic or Latino race householdersMedian 2022 house value $462,340 White Non-Hispanic householders$157,671 Black or African American householders $545,784 Asian householders$618,555 Native Hawaiian and other Pacific Islander householders$455,063 Some other race householders$493,874 Hispanic or Latino householders
Median age by race in Kuna
30.9 Median age for White residents31.5 29.8 37.4 Median age for Black or African American residents38.0 -848,484,847.6 -733,529,989.4 Median age for American Indian / Alaska Native residents-735,294,116.9 -682,399,212.7 40.8 Median age for Asian residents43.5 38.2 -587,719,297.7 Median age for Native Hawaiian / Pacific Islander residents-438,794,726.5 -1,099,502,486.5 39.6 Median age for Other race residents40.4 51.7 30.1 Median age for Two or more races residents34.2 30.8 31.3 Median age for White alone residents31.5 31.9 26.6 Median age for Hispanic or Latino residents34.2 25.7
Owner/renter occupied households by race in Kuna
House owners and renters - White residents 6,496 81.7% Owner occupied1,451 18.3% Renter occupiedHouse owners and renters - Asian residents 97 100.0% Owner occupiedHouse owners and renters - Other race residents 147 90.9% Owner occupied15 9.1% Renter occupiedHouse owners and renters - Two or more races residents 81 75.0% Owner occupied27 25.0% Renter occupiedHouse owners and renters - White alone residents 6,382 81.6% Owner occupied1,434 18.4% Renter occupiedHouse owners and renters - Hispanic or Latino residents 319 84.2% Owner occupied60 15.8% Renter occupied
Language usage in Kuna
English speakers - Total 92.6% of residents of Kuna speak English at home.
6.3% of residents speak Spanish at home 788 53.0% Speak English very well698 47.0% Speak English less than very well1.0% of residents speak other language at home 240 96.8% Speak English very well8 3.2% Speak English less than very well
English speakers - Born in the United States 98.0% of residents of Kuna speak English at home.
1.8% of residents speak Spanish at home 153 68.0% Speak English very well72 32.0% Speak English less than very well0.3% of residents speak other language at home 40 100.0% Speak English very well
English speakers - Native, born elsewhere 53.6% of residents of Kuna speak English at home.
49.5% of residents speak Spanish at home 109 100.0% Speak English very well4.5% of residents speak other language at home 10 100.0% Speak English very well
English speakers - Foreign-born 5.6% of residents of Kuna speak English at home.
83.6% of residents speak Spanish at home 507 48.1% Speak English very well546 51.9% Speak English less than very well13.4% of residents speak other language at home 160 94.7% Speak English very well9 5.3% Speak English less than very well
White (Caucasian) - Speak only English Native:
98.3% (20,226)Foreign-born:
8.8% (58)
White (Caucasian) - Speak another language Native:
1.8% (368)Foreign-born:
100.0% (657)
Asian - Speak another language Native:
9.8% (9)Foreign-born:
95.6% (116)
Other race - Speak another language Native:
5.6% (23)Foreign-born:
100.0% (287)
Two or more races - Speak another language Native:
14.5% (135)Foreign-born:
98.2% (148)
White alone - Speak only English Native:
98.7% (20,034)Foreign-born:
44.8% (45)
White alone - Speak another language Native:
1.4% (276)Foreign-born:
46.7% (47)
Hispanic or Latino - Speak only English Native:
76.8% (905)Foreign-born:
1.4% (15)
Hispanic or Latino - Speak another language Native:
23.3% (275)Foreign-born:
100.0% (1,078)
Foreign-born residents in Kuna 1,159 residents are foreign born (3.8% Latin America ).
Marital status for residents in Kuna Marital status - White (Caucasian) population 15 years and over
Males 31.2% Never married57.0% Now married1.6% Separated0.5% Widowed9.7% DivorcedFemales 22.3% Never married55.0% Now married1.0% Separated5.3% Widowed16.3% DivorcedWomen who gave birth in the past 12 months Now married:
100.0% (296)Unmarried:
0.0% (0)
Women who did not give birth in the past 12 months Now married:
55.0% (2,918)Unmarried:
45.0% (2,388)
Marital status - Black or African American population 15 years and over
Males 0.0% Never married100.0% Now married0.0% Separated0.0% Widowed0.0% DivorcedFemales 100.0% Never married0.0% Now married0.0% Separated0.0% Widowed0.0% DivorcedWomen who did not give birth in the past 12 months Now married:
0.0% (0)Unmarried:
100.0% (3)
Marital status - Asian population 15 years and over
Males 0.0% Never married100.0% Now married0.0% Separated0.0% Widowed0.0% DivorcedFemales 0.0% Never married100.0% Now married0.0% Separated0.0% Widowed0.0% DivorcedWomen who gave birth in the past 12 months Now married:
100.0% (10)Unmarried:
0.0% (0)
Women who did not give birth in the past 12 months Now married:
100.0% (27)Unmarried:
0.0% (0)
Marital status - Other race population 15 years and over
Males 68.0% Never married29.6% Now married0.0% Separated2.3% Widowed0.0% DivorcedFemales 62.0% Never married38.0% Now married0.0% Separated0.0% Widowed0.0% DivorcedWomen who did not give birth in the past 12 months Now married:
0.0% (0)Unmarried:
100.0% (83)
Marital status - Two or more races population 15 years and over
Males 50.0% Never married50.0% Now married0.0% Separated0.0% Widowed0.0% DivorcedFemales 22.7% Never married53.4% Now married0.0% Separated0.0% Widowed24.0% DivorcedWomen who gave birth in the past 12 months Now married:
100.0% (27)Unmarried:
0.0% (0)
Women who did not give birth in the past 12 months Now married:
45.3% (189)Unmarried:
54.7% (229)
Marital status - White alone, not Hispanic / Latino population 15 years and over
Males 31.3% Never married56.9% Now married1.0% Separated0.5% Widowed10.3% DivorcedFemales 22.1% Never married55.7% Now married1.1% Separated5.6% Widowed15.6% DivorcedWomen who gave birth in the past 12 months Now married:
100.0% (300)Unmarried:
0.0% (0)
Women who did not give birth in the past 12 months Now married:
55.7% (2,825)Unmarried:
44.3% (2,243)
Marital status - Hispanic or Latino population 15 years and over
Males 45.6% Never married49.9% Now married4.5% Separated0.0% Widowed0.0% DivorcedFemales 32.4% Never married34.2% Now married0.0% Separated0.0% Widowed33.4% DivorcedWomen who did not give birth in the past 12 months Now married:
27.1% (141)Unmarried:
72.9% (381)
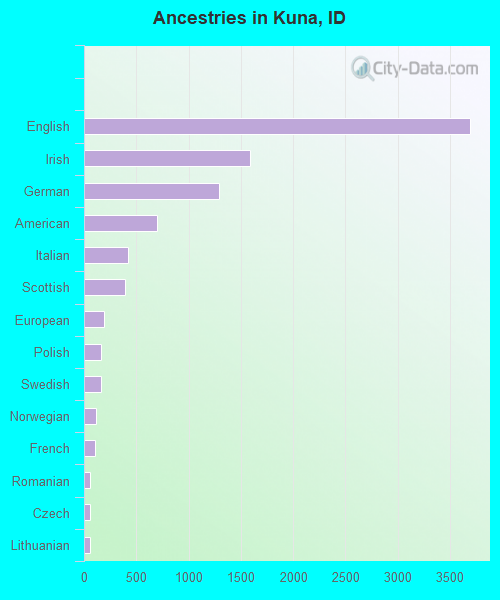
Ancestries in Kuna
3,691 36.2% English1,584 15.6% Irish1,295 12.7% German700 6.9% American425 4.2% Italian388 3.8% Scottish192 1.9% European161 1.6% Polish159 1.6% Swedish111 1.1% Norwegian110 1.1% French58 0.6% Romanian57 0.6% Czech53 0.5% Lithuanian32 0.3% British31 0.3% French Canadian29 0.3% Yugoslavian22 0.2% Swiss15 0.1% Ukrainian11 0.1% Russian10 0.10% Scotch-Irish7 0.07% Danish5 0.05% Dutch
Geographical mobility in Kuna Same house 1 year ago 19,973 87.5% White (Caucasian)35 89.8% Black or African American46 84.2% American Indian / Alaska Native93 43.2% Asian82 100.0% Native Hawaiian / Pacific Islander402 57.0% Other race1,242 93.8% Two or more races19,482 88.6% White alone, not Hispanic / Latino1,791 74.3% Hispanic or LatinoMoved within same county 1,537 6.7% White / Caucasian6 11.7% American Indian / Alaska Native113 52.3% Asian167 23.7% Other race69 5.2% Two or more races1,340 6.1% White alone, not Hispanic / Latino469 19.5% Hispanic or LatinoMoved within same state 221 1.0% White / Caucasian138 0.6% White alone, not Hispanic / Latino103 4.3% Hispanic or LatinoMoved from different state 945 4.1% White / Caucasian16 1.2% Two or more races927 4.2% White alone, not Hispanic / Latino10 0.4% Hispanic or LatinoMoved from abroad 143 0.6% White145 0.7% White alone, not Hispanic / Latino
Children Nativity (place of birth) in Kuna
Children under 6 years - Living with two parents Both parents native 1,951 100.0% NativeOne native, one foreign-born parent 50 100.0% NativeChildren under 6 years - Living with one parent Native parent 221 100.0% NativeForeign-born parent 49 100.0% NativeChildren 6 to 17 years - Living with two parents Both parents native 3,112 100.0% NativeBoth parents foreign-born 42 100.0% NativeOne native, one foreign-born parent 68 100.0% NativeChildren 6 to 17 years - Living with one parent Native parent 2,377 95.4% Native116 4.6% Foreign-bornForeign-born parent 92 100.0% Native
Grandparents responsible for own grandchildren in Kuna
Grandparents (30 to 59 years) White / Caucasian 100 100.0% Responsible for grandchildrenWhite alone, not Hispanic / Latino 107 100.0% Responsible for grandchildren
Grandparents (60 years and over) White / Caucasian 96 100.0% Not responsible for grandchildrenWhite alone, not Hispanic / Latino 106 100.0% Not responsible for grandchildren